

A Critical Role for Immune System Response in Mediating Anti-influenza Drug Synergies Assessed by Mechanistic Modeling
- PMID: 25207611
- PMCID: PMC4211263
- DOI: 10.1038/psp.2014.32
A Critical Role for Immune System Response in Mediating Anti-influenza Drug Synergies Assessed by Mechanistic Modeling
Abstract
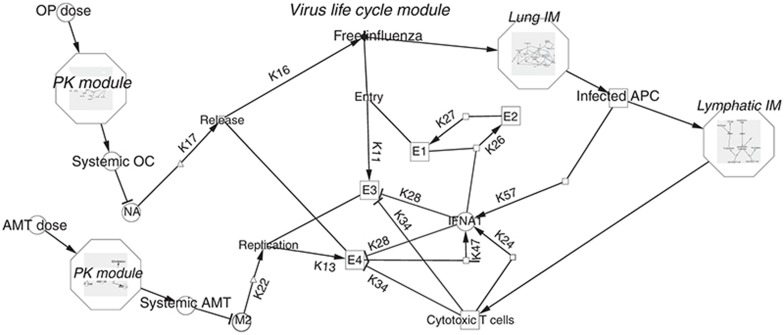
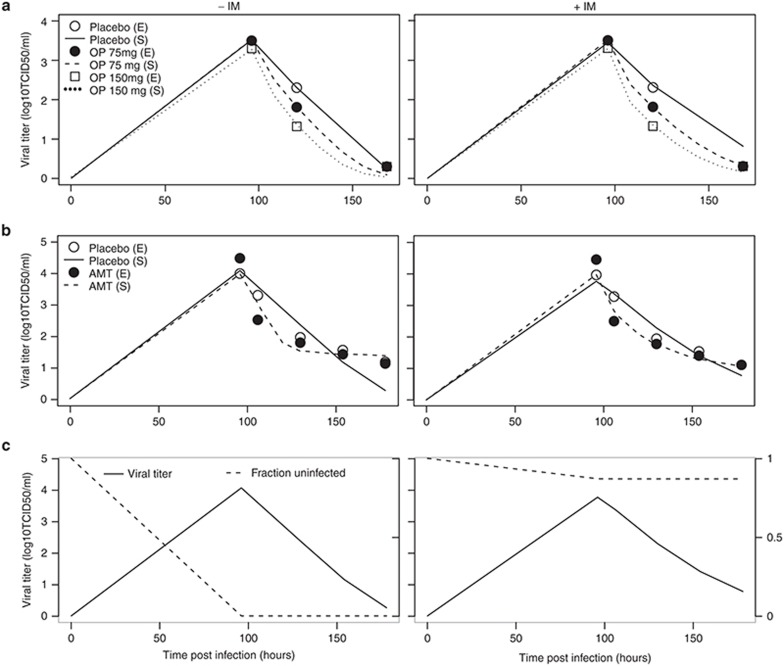
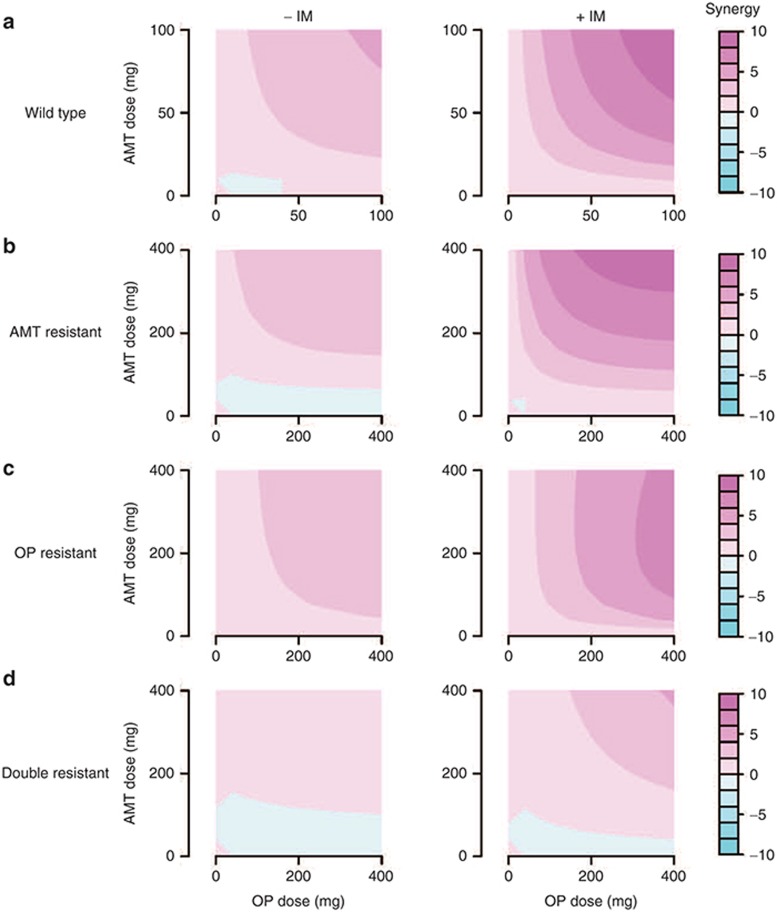
Influenza virus infections represent a serious public health problem worldwide, due to the rapid emergence of drug resistance. One strategy to improve treatment efficacy is to combine drugs that act synergistically. Potentially useful drug combinations are typically identified through empirical testing using in vitro and animal models, but the complexity of the clinical situation warrants the use of more careful analysis and sophisticated approaches. To explore new approaches, we constructed a mechanistic model representing the interaction of antiviral drugs with the viral replication pathway and human immune responses. Simulation of combination therapy using oseltamivir and amantadine predicted significant therapeutic synergy only when immune response was included, in agreement with previous in vitro and in vivo studies using amantadine-resistant strains. Our model can be used to predict the optimal doses for combination therapy, and also raises questions about current drug evaluation methods that do not account for immune system interactions.
Figures
Similar articles
-
Triple combination of amantadine, ribavirin, and oseltamivir is highly active and synergistic against drug resistant influenza virus strains in vitro.PLoS One. 2010 Feb 22;5(2):e9332. doi: 10.1371/journal.pone.0009332. PLoS One. 2010. PMID: 20179772 Free PMC article.
-
Antiviral drugs in influenza: an adjunct to vaccination in some situations.Prescrire Int. 2006 Feb;15(81):21-30. Prescrire Int. 2006. PMID: 16548114
-
Triple combination of oseltamivir, amantadine, and ribavirin displays synergistic activity against multiple influenza virus strains in vitro.Antimicrob Agents Chemother. 2009 Oct;53(10):4115-26. doi: 10.1128/AAC.00476-09. Epub 2009 Jul 20. Antimicrob Agents Chemother. 2009. PMID: 19620324 Free PMC article.
-
Influenza diagnosis and treatment in children: a review of studies on clinically useful tests and antiviral treatment for influenza.Pediatr Infect Dis J. 2003 Feb;22(2):164-77. doi: 10.1097/01.inf.0000050458.35010.b6. Pediatr Infect Dis J. 2003. PMID: 12586981 Review.
-
Antivirals--current trends in fighting influenza.Acta Biochim Pol. 2014;61(3):495-504. Epub 2014 Sep 1. Acta Biochim Pol. 2014. PMID: 25180220 Review.
Cited by
-
Compounds with anti-influenza activity: present and future of strategies for the optimal treatment and management of influenza. Part II: Future compounds against influenza virus.J Prev Med Hyg. 2014 Dec;55(4):109-29. J Prev Med Hyg. 2014. PMID: 26137785 Free PMC article. Review.
-
Systematic synergy modeling: understanding drug synergy from a systems biology perspective.BMC Syst Biol. 2015 Sep 16;9:56. doi: 10.1186/s12918-015-0202-y. BMC Syst Biol. 2015. PMID: 26377814 Free PMC article.
-
A temperature-dependent in silico model of the human ether-à-go-go-related (hERG) gene channel.J Pharmacol Toxicol Methods. 2016 Sep-Oct;81:233-9. doi: 10.1016/j.vascn.2016.05.005. Epub 2016 May 11. J Pharmacol Toxicol Methods. 2016. PMID: 27178106 Free PMC article.
-
Optimization of an In silico Cardiac Cell Model for Proarrhythmia Risk Assessment.Front Physiol. 2017 Aug 23;8:616. doi: 10.3389/fphys.2017.00616. eCollection 2017. Front Physiol. 2017. PMID: 28878692 Free PMC article.
-
Calibration and Validation of a Mechanistic COVID-19 Model for Translational Quantitative Systems Pharmacology - A Proof-of-Concept Model Development for Remdesivir.Clin Pharmacol Ther. 2022 Oct;112(4):882-891. doi: 10.1002/cpt.2686. Epub 2022 Jun 29. Clin Pharmacol Ther. 2022. PMID: 35694844 Free PMC article.
References
-
- Garman E., Laver G. Controlling influenza by inhibiting the virus's neuraminidase. Curr. Drug Targets. 2004;5:119–136. - PubMed
-
- Reuman P.D., Bernstein D.I., Keefer M.C., Young E.C., Sherwood J.R., Schiff G.M. Efficacy and safety of low dosage amantadine hydrochloride as prophylaxis for influenza A. Antiviral Res. 1989;11:27–40. - PubMed
LinkOut - more resources
Full Text Sources
Other Literature Sources
