

Proteome profiling of human cutaneous leishmaniasis lesion
- PMID: 25207817
- PMCID: PMC4291685
- DOI: 10.1038/jid.2014.396
Proteome profiling of human cutaneous leishmaniasis lesion
Abstract
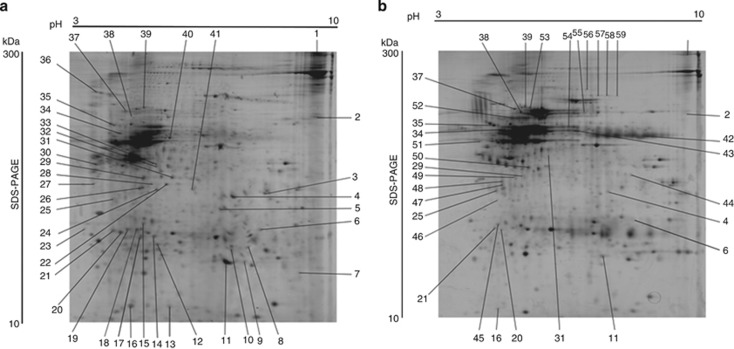
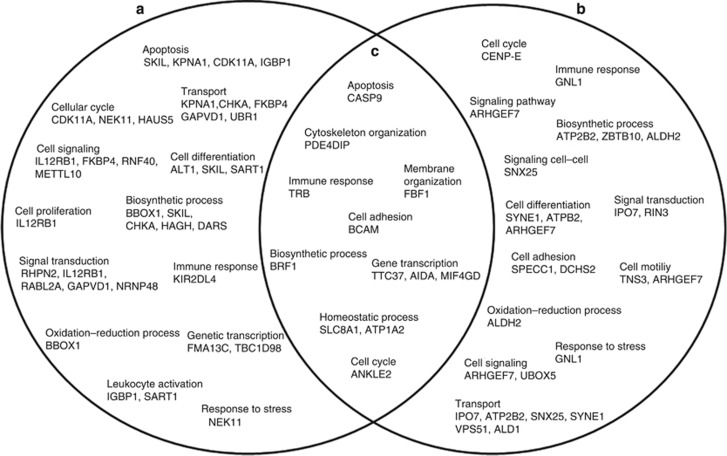
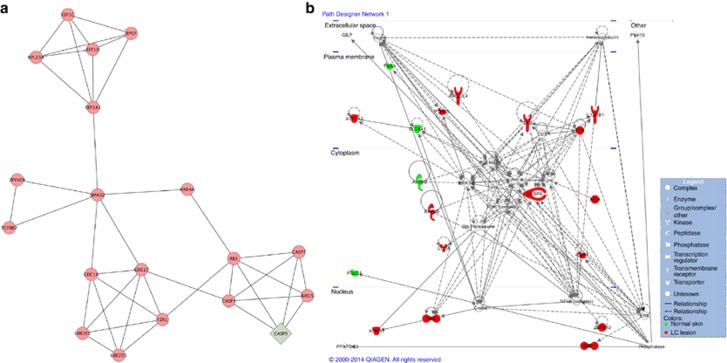
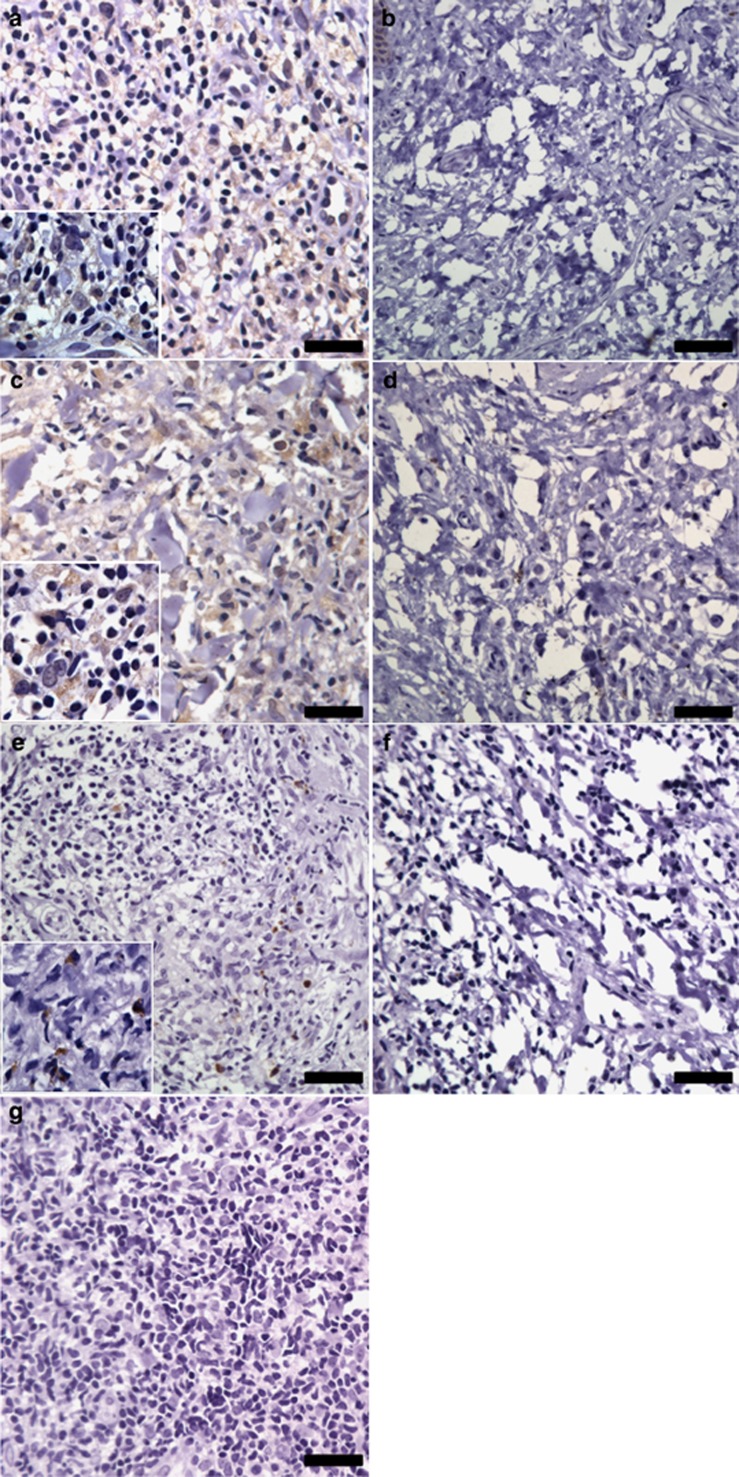
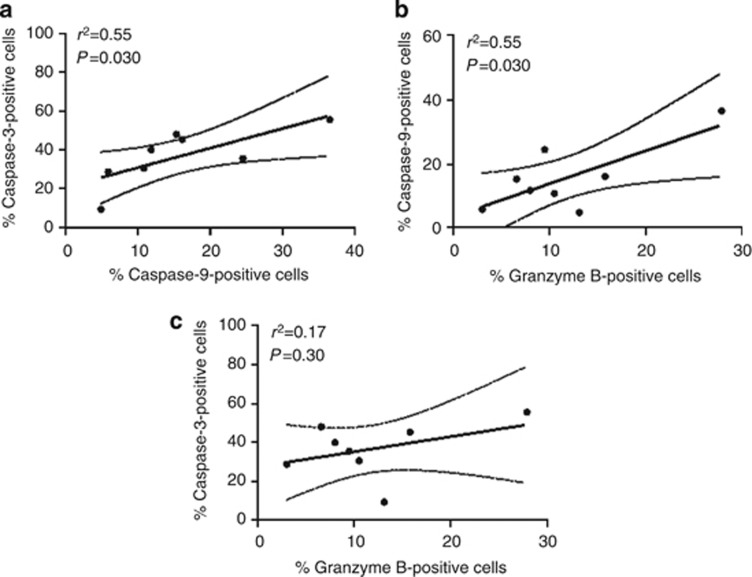
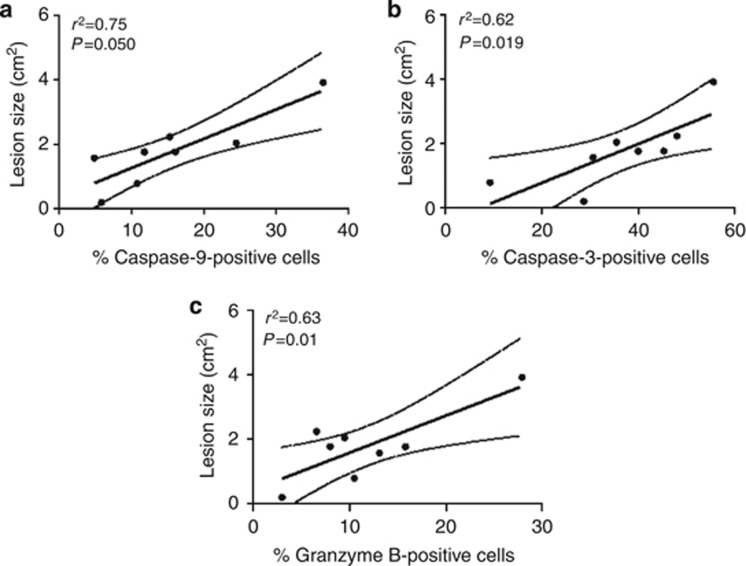
In this study, we used proteomics and biological network analysis to evaluate the potential biological processes and components present in the identified proteins of biopsies from cutaneous leishmaniasis (CL) patients infected by Leishmania braziliensis in comparison with normal skin. We identified 59 proteins differently expressed in samples from infected and normal skin. Biological network analysis employing identified proteins showed the presence of networks that may be involved in the cell death mediated by cytotoxic T lymphocytes. After immunohistochemical analyses, the expression of caspase-9, caspase-3, and granzyme B was validated in the tissue and positively correlated with the lesion size in CL patients. In conclusion, this work identified differentially expressed proteins in the inflammatory site of CL, revealed enhanced expression of caspase-9, and highlighted mechanisms associated with the progression of tissue damage observed in lesions.
Figures
Similar articles
-
CD8(+) granzyme B(+)-mediated tissue injury vs. CD4(+)IFNγ(+)-mediated parasite killing in human cutaneous leishmaniasis.J Invest Dermatol. 2013 Jun;133(6):1533-40. doi: 10.1038/jid.2013.4. Epub 2013 Jan 15. J Invest Dermatol. 2013. PMID: 23321919 Free PMC article.
-
CD3+CD4negCD8neg (double negative) T lymphocytes and NKT cells as the main cytotoxic-related-CD107a+ cells in lesions of cutaneous leishmaniasis caused by Leishmania (Viannia) braziliensis.Parasit Vectors. 2017 May 3;10(1):219. doi: 10.1186/s13071-017-2152-2. Parasit Vectors. 2017. PMID: 28468680 Free PMC article.
-
Recruitment of CD8(+) T cells expressing granzyme A is associated with lesion progression in human cutaneous leishmaniasis.Parasite Immunol. 2009 Aug;31(8):432-9. doi: 10.1111/j.1365-3024.2009.01125.x. Parasite Immunol. 2009. PMID: 19646207 Free PMC article.
-
PKDL and other dermal lesions in HIV co-infected patients with Leishmaniasis: review of clinical presentation in relation to immune responses.PLoS Negl Trop Dis. 2014 Nov 20;8(11):e3258. doi: 10.1371/journal.pntd.0003258. eCollection 2014. PLoS Negl Trop Dis. 2014. PMID: 25412435 Free PMC article. Review.
-
Biomarkers of Cutaneous Leishmaniasis.Front Cell Infect Microbiol. 2018 Jun 26;8:222. doi: 10.3389/fcimb.2018.00222. eCollection 2018. Front Cell Infect Microbiol. 2018. PMID: 29998089 Free PMC article. Review.
Cited by
-
Identification of the Host Substratome of Leishmania-Secreted Casein Kinase 1 Using a SILAC-Based Quantitative Mass Spectrometry Assay.Front Cell Dev Biol. 2022 Jan 3;9:800098. doi: 10.3389/fcell.2021.800098. eCollection 2021. Front Cell Dev Biol. 2022. PMID: 35047509 Free PMC article.
-
Understanding Leishmania parasites through proteomics and implications for the clinic.Expert Rev Proteomics. 2018 May;15(5):371-390. doi: 10.1080/14789450.2018.1468754. Epub 2018 May 2. Expert Rev Proteomics. 2018. PMID: 29717934 Free PMC article. Review.
-
Cytotoxic activity in cutaneous leishmaniasis.Mem Inst Oswaldo Cruz. 2017 Nov;112(11):733-740. doi: 10.1590/0074-02760170109. Mem Inst Oswaldo Cruz. 2017. PMID: 29091132 Free PMC article. Review.
-
Transcriptional Analysis of Human Skin Lesions Identifies Tryptophan-2,3-Deoxygenase as a Restriction Factor for Cutaneous Leishmania.Front Cell Infect Microbiol. 2019 Oct 4;9:338. doi: 10.3389/fcimb.2019.00338. eCollection 2019. Front Cell Infect Microbiol. 2019. PMID: 31637219 Free PMC article.
-
Proteome profiling of cutaneous leishmaniasis lesions due to dermotropic Leishmania donovani in Sri Lanka.bioRxiv [Preprint]. 2024 Jan 8:2024.01.07.574579. doi: 10.1101/2024.01.07.574579. bioRxiv. 2024. Update in: Clin Proteomics. 2024 Jul 5;21(1):48. doi: 10.1186/s12014-024-09499-0. PMID: 38260468 Free PMC article. Updated. Preprint.
References
-
- Assenov Y, Ramírez F, Schelhorn S-E, et al. Computing topological parameters of biological networks. Bioinformatics. 2008;24:282–284. - PubMed
-
- Bittencourt AL, Barral A. Evaluation of the histopathological classifications of American cutaneous and mucocutaneous leishmaniasis. Mem Inst Oswaldo Cruz. 1991;86:51–56. - PubMed
-
- Carneiro FP, De Magalhães AV, De Jesus Abreu Almeida Couto M, et al. Foxp3 expression in lesions of the different clinical forms of American tegumentary leishmaniasis. Parasite Immunol. 2009;31:646–651. - PubMed
-
- Cevik O, Adiguzel Z, Baykal AT, et al. The apoptotic actions of platelets in acute ischemic stroke. Mol Biol Rep. 2013;40:6721–6727. - PubMed
Publication types
MeSH terms
Substances
LinkOut - more resources
Full Text Sources
Other Literature Sources
Research Materials
