. 2014 Oct 21;86(20):10036-43.
doi: 10.1021/ac5014767. Epub 2014 Sep 10.

Development of a GC/Quadrupole-Orbitrap mass spectrometer, part I: design and characterization

Affiliations

Development of a GC/Quadrupole-Orbitrap mass spectrometer, part I: design and characterization

Amelia C Peterson et al. Anal Chem. .

Abstract

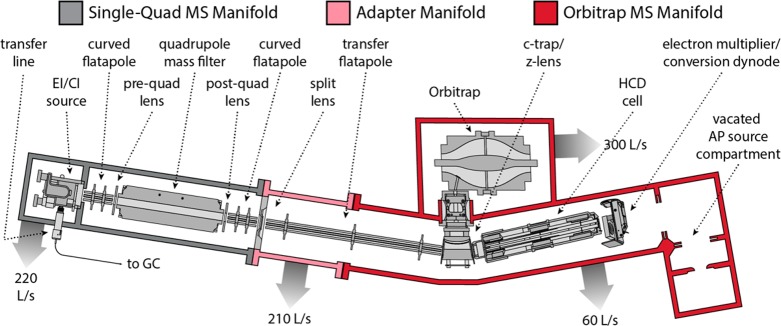
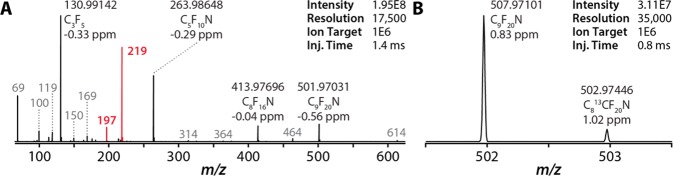
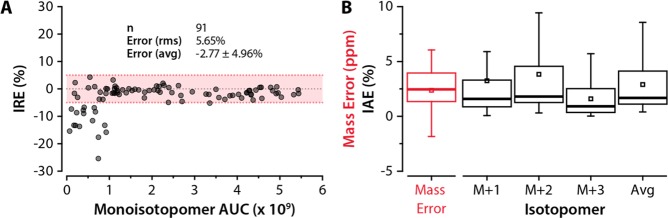
Identification of unknown compounds is of critical importance in GC/MS applications (metabolomics, environmental toxin identification, sports doping, petroleomics, and biofuel analysis, among many others) and remains a technological challenge. Derivation of elemental composition is the first step to determining the identity of an unknown compound by MS, for which high accuracy mass and isotopomer distribution measurements are critical. Here, we report on the development of a dedicated, applications-grade GC/MS employing an Orbitrap mass analyzer, the GC/Quadrupole-Orbitrap. Built from the basis of the benchtop Orbitrap LC/MS, the GC/Quadrupole-Orbitrap maintains the performance characteristics of the Orbitrap, enables quadrupole-based isolation for sensitive analyte detection, and includes numerous analysis modalities to facilitate structural elucidation. We detail the design and construction of the instrument, discuss its key figures-of-merit, and demonstrate its performance for the characterization of unknown compounds and environmental toxins.


Figures

Figure 1
Figure 1
Schematic of the GC/Quadrupole-Orbitrap instrument. The three component manifolds, the Single-Quadrupole MS, adapter, and Exactive, are colored in gray, light red, and dark red, respectively. The main ion optic components and four turbo-molecular pumps (as gray outward arrows) are labeled.
Figure 2
Figure 2
(A) Single-scan full mass range positive EI FC-43 calibration spectrum acquired in profile mode. Mass errors (ppm) and compositions are shown for major ion species. Average mass error with external calibration was 0.24 ppm (σ = 1.04, errorrms = 1.06, n = 38). Mass accuracy and compositions for additional ions are available in Table S2 in the Supporting Information. (B) Zoom-in on FC-43 m/z 502 monoisotope and first isotope acquired at 35 000 resolution in profile mode.
Figure 3
Figure 3
Spectral quality of GC/Q-Orbitrap spectra (top, black) for (A) methyl eicosanoate (average mass error 0.57 ppm, σ = 0.50 ppm, errorrms = 0.75 ppm, n = 16) and (B) hexachloroethane (average mass error 1.14 ppm, σ = 0.39 ppm, errorrms = 1.19 ppm, n = 7). Spectra are juxtaposed with NIST reference spectra (bottom, red). Spectra were matched as the top hit (number in parenthesis) with NIST match scores as indicated. Spectra were acquired at 17 500 resolution with a 1 × 10⁶ ion target.
Figure 4
Figure 4
(A) Quadrupole isolation transmission efficiency. Transmission relative to rf-only (q = 0.706) operation is plotted for four stable FC-43 ions as a function of measured isolation width using an AGC target of 1 × 10⁵, 17 500 resolution, and <100 ms injection times. (B) Chromatographic and spectral performance of 1 pg octafluoronaphthalene (OFN) in 0–5% v/v diesel. Chromatographic peak areas (denoted “A”) and spectral signal-to-noise (S/N) are noted. (C) Response curves (peak area versus amount on column) for 5 of 94 EPA 8270 compounds targeted by scheduled SIM (3 Th) over 6 orders-of-magnitude. Linearity and detection limit data are given Table 1 and Supplemental Figure S4 in the Supporting Information. (D) Quantification of 2,3,7,8-TCDD at 10–15 fg on column in human pooled blood extract. At left, extracted ion chromatograms (±10 ppm, 5 pt Gaussian smoothing) of native congener quantification isotopomers, m/z 320 and m/z 322, analyzed in separate SIM (4 Th) scans, and of 13C-labeled internal standard (IS) congeners analyzed in full scan are plotted. The single-scan SIM mass spectra at the elution apex for the targeted native congener isotopomers are plotted at right.
Figure 5
Figure 5
(A) Percent isotopomer ratio error (IRE) versus extracted ion chromatographic peak area for the monoisotopomeric ion (±5 ppm) for 91 of of 94 EPA 8270 compounds in an analysis at 17 500 resolution. Average IRE was −2.77%. (B) Accuracy and precision of mass errors (ppm) and isotopomer abundance errors (IAE, in percent) for 81 putative metabolites and analysis artifacts from the metabolomics study of Arabidopsis thaliana. M + 1, M + 2, and M + 3 correspond to the individual IAE for the first, second, and third isotopomers, respectively.
Figure 6
Figure 6
Identification of an unknown fatty acid methyl ester. (A) EI mass spectrum of the untreated unknown. (B) EI mass spectrum of the unknown following hydrogenation, indicating that the unknown is monoenoic (2 Th mass shift with hydrogenation), and has a branched structure based on characteristic fragments a and b. The proposed structure of the hydrogenated unknown is depicted above. (C) Acetonitrile PCI MS and MS/MS spectra. The MS spectrum shows several molecular ion adducts, including [M + MIE]+. The [M + MIE]+ ion was isolated and fragmented at 25 eV to generate the MS/MS spectrum. The characteristic α and ω ions localize the double bond. The proposed structure of the unknown is shown above.

References

    1. Fiehn O. TrAC, Trends Anal Chem. 2008, 27, 261–269. - PMC - PubMed
    1. Fiehn O.; Kopka J.; Dormann P.; Altmann T.; Trethewey R. N.; Willmitzer L. Nat. Biotechnol. 2000, 18, 1157–1161. - PubMed
    1. Fiehn O.; Kopka J.; Trethewey R. N.; Willmitzer L. Anal. Chem. 2000, 72, 3573–3580. - PubMed
    1. Kumari S.; Stevens D.; Kind T.; Denkert C.; Fiehn O. Anal. Chem. 2011, 83, 5895–5902. - PMC - PubMed
    1. Kim S.; Rodgers R. P.; Marshall A. G. Int. J. Mass Spectrom. 2006, 251, 260–265.

Publication types

MeSH terms