. 2014 Sep 11:5:4753.
doi: 10.1038/ncomms5753.

Circadian rhythm reprogramming during lung inflammation

Affiliations

Circadian rhythm reprogramming during lung inflammation

Jeffrey A Haspel et al. Nat Commun. .

Abstract

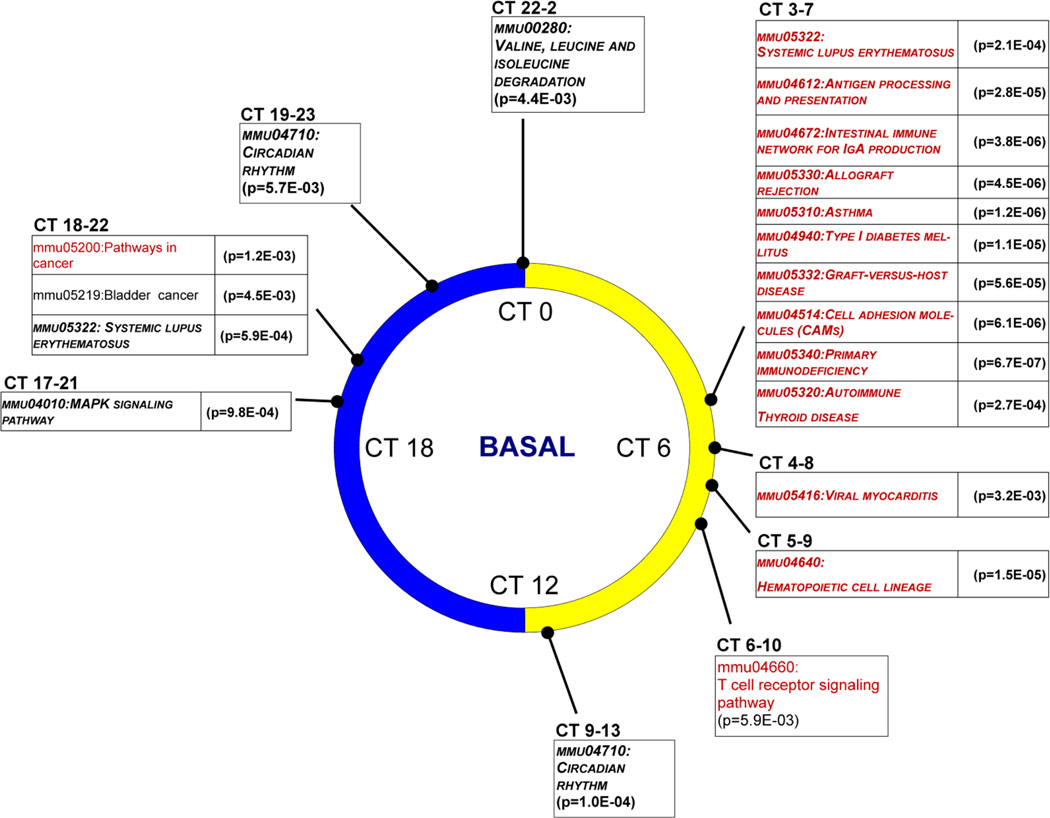
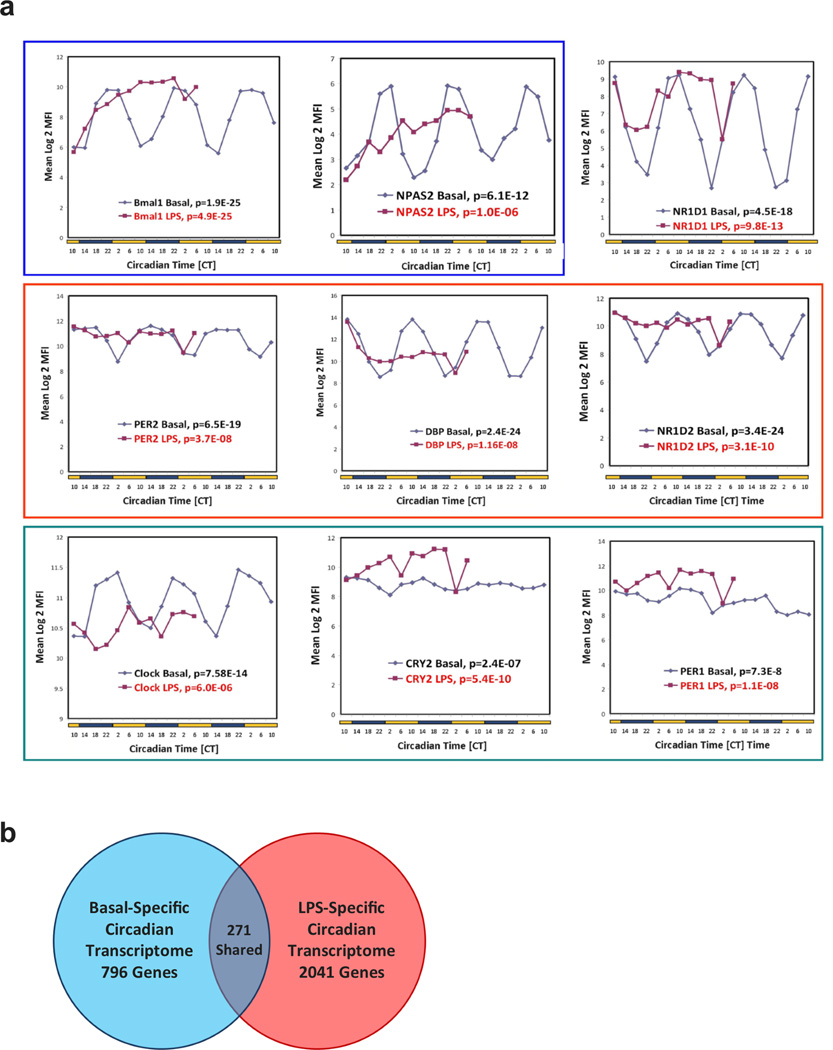
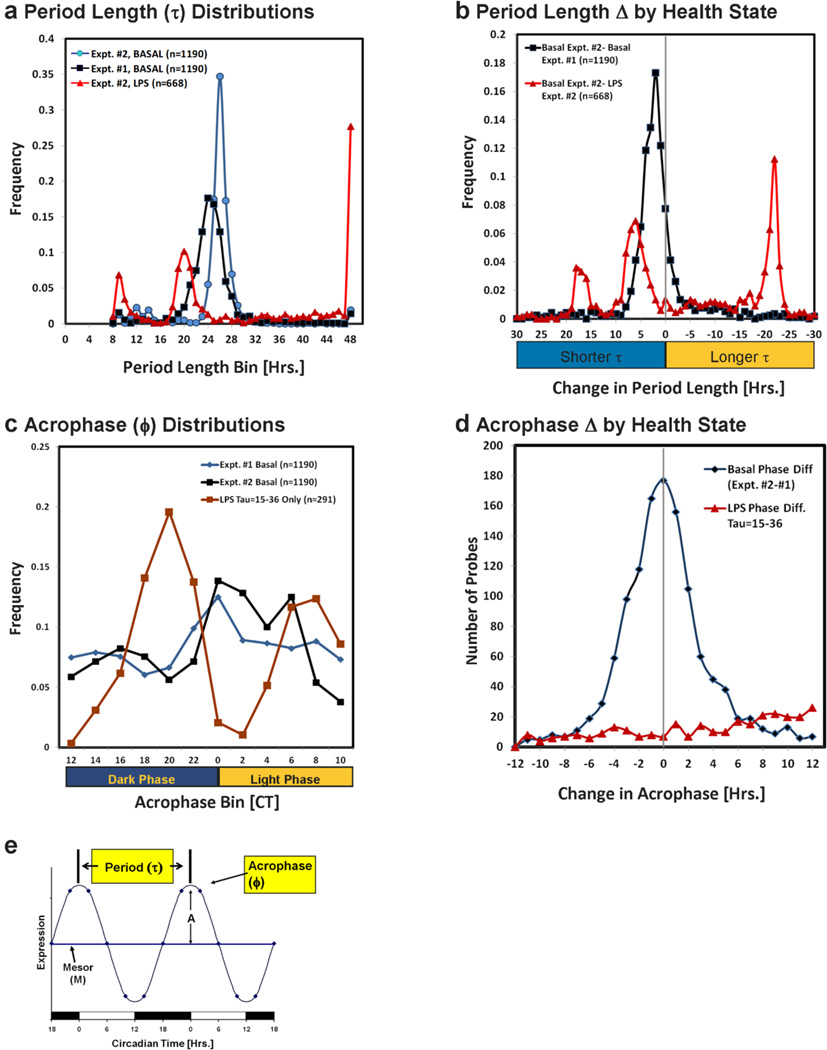
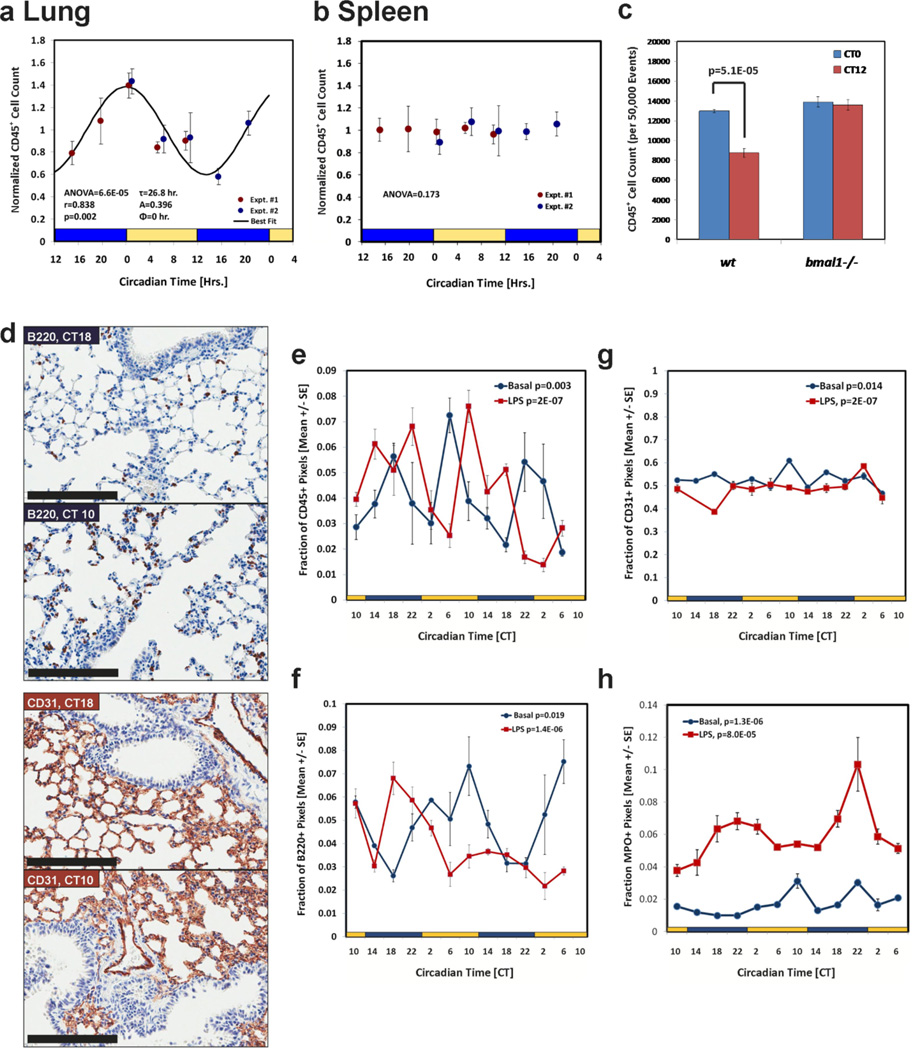
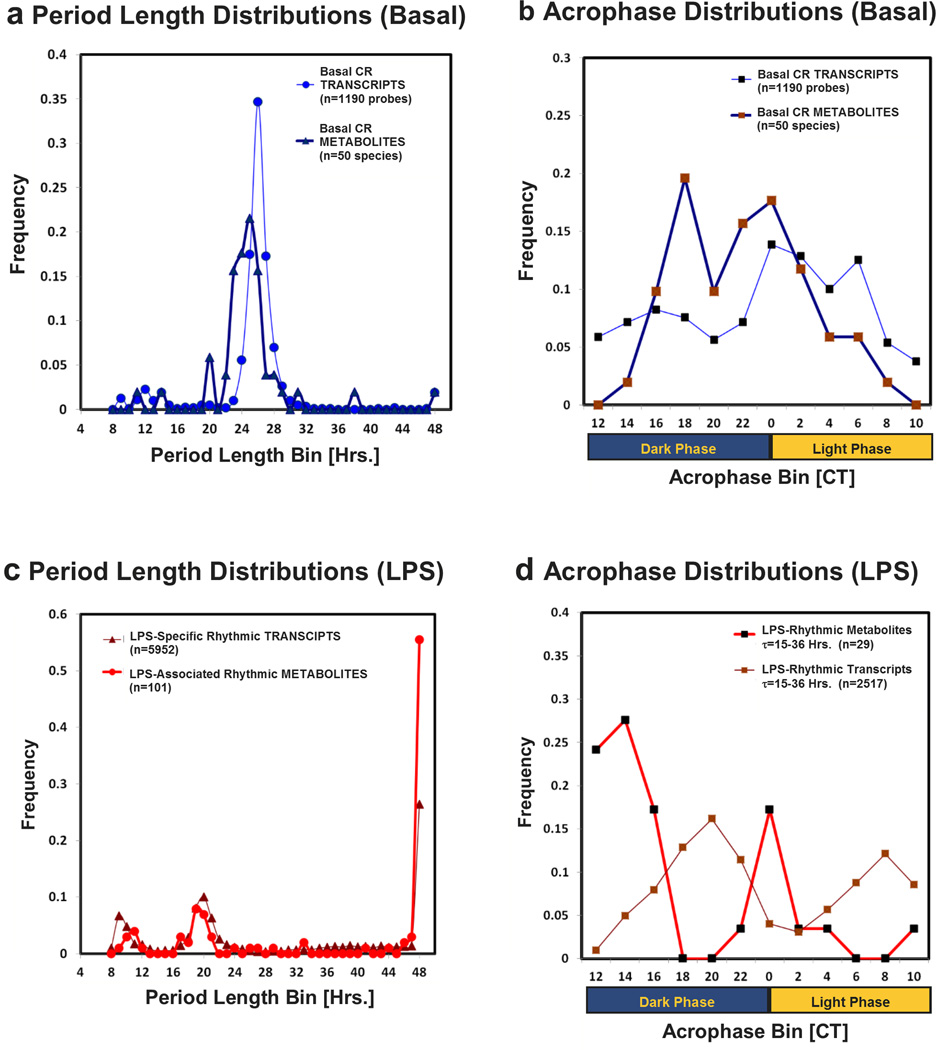
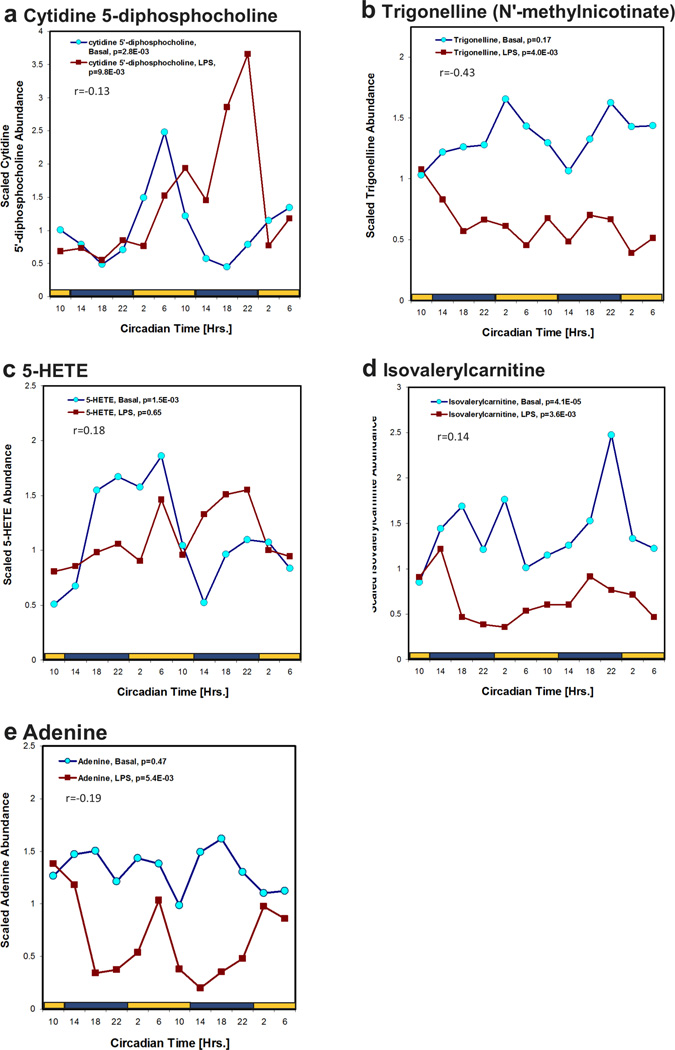
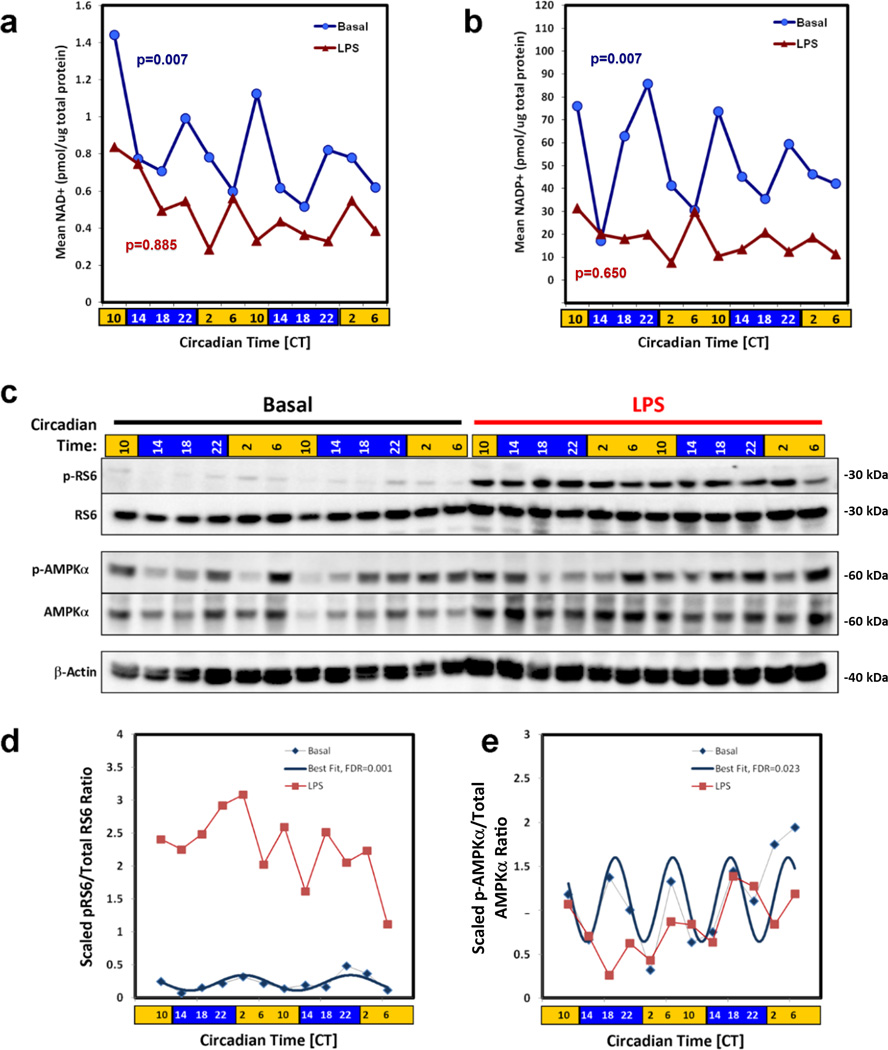
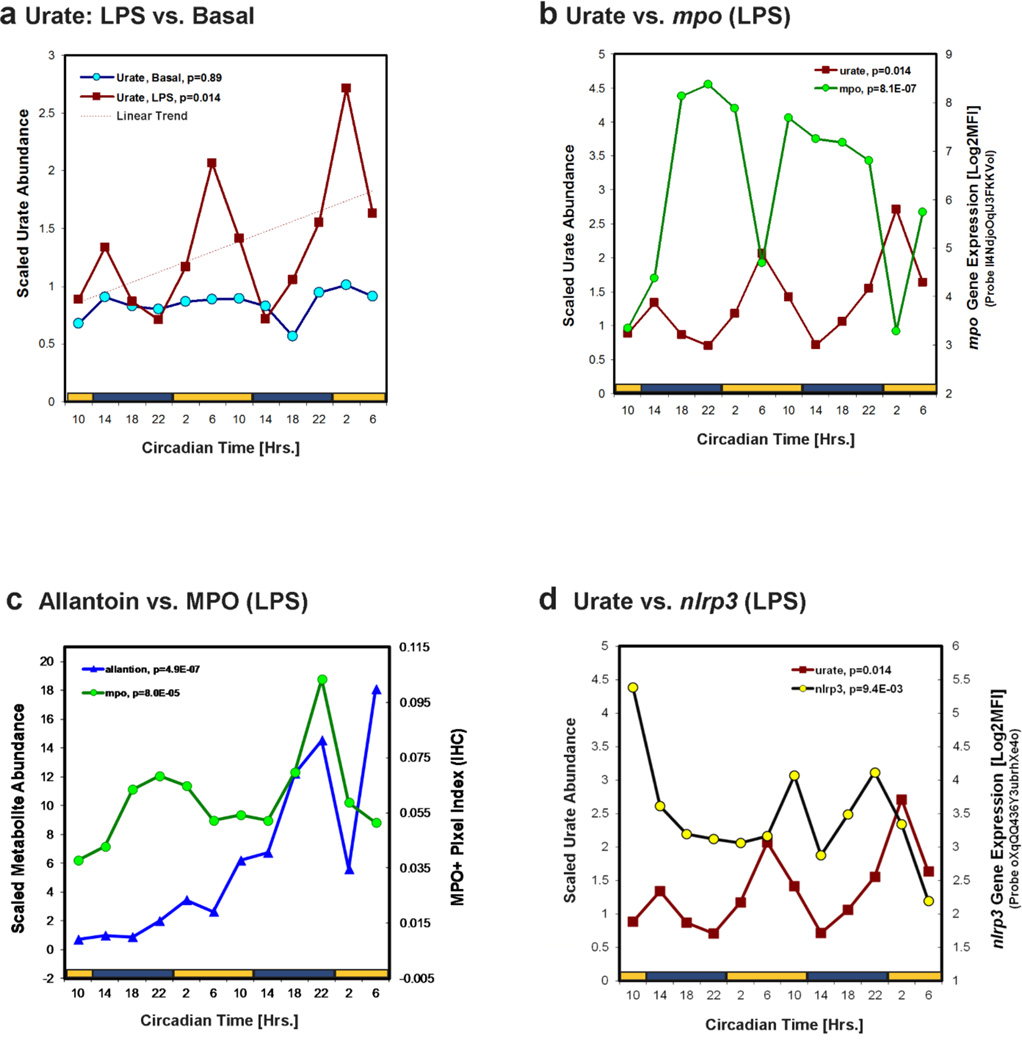
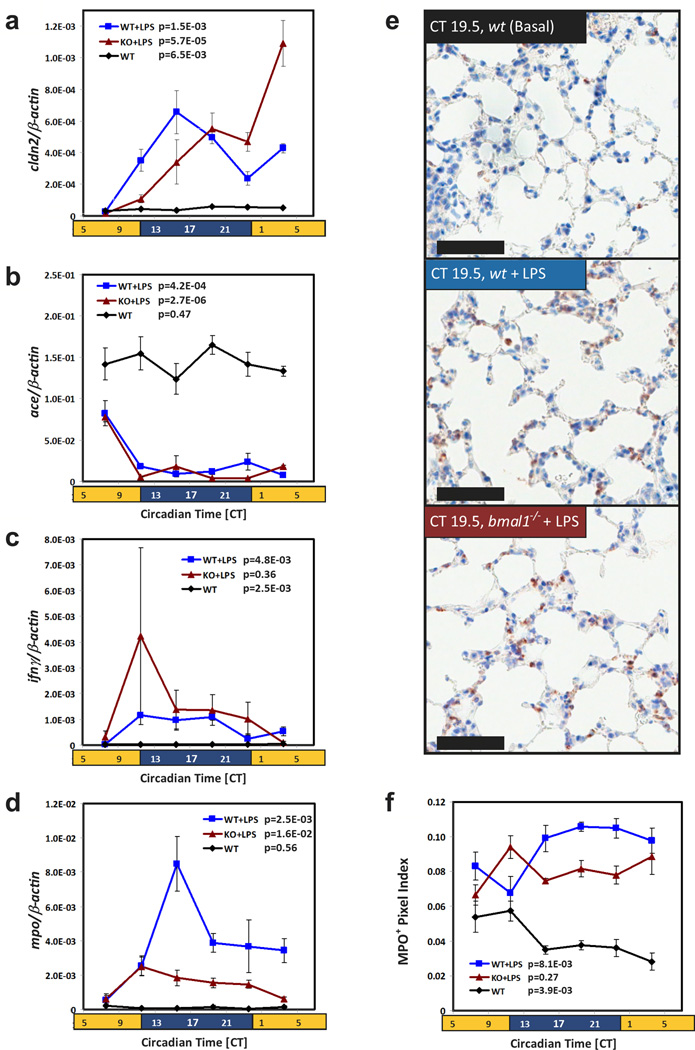
Circadian rhythms are known to regulate immune responses in healthy animals, but it is unclear whether they persist during acute illnesses where clock gene expression is disrupted by systemic inflammation. Here we use a genome-wide approach to investigate circadian gene and metabolite expression in the lungs of endotoxemic mice and find that novel cellular and molecular circadian rhythms are elicited in this setting. The endotoxin-specific circadian programme exhibits unique features, including a divergent group of rhythmic genes and metabolites compared with the basal state and a distinct periodicity and phase distribution. At the cellular level, endotoxin treatment also alters circadian rhythms of leukocyte counts within the lung in a bmal1-dependent manner, such that granulocytes rather than lymphocytes become the dominant oscillating cell type. Our results show that inflammation produces a complex re-organization of cellular and molecular circadian rhythms that are relevant to early events in lung injury.


Figures

Figure 1
Figure 1
Temporal map of KEGG terms enriched in the basal circadian transcriptome of mouse lung. The 4-hour phase interval that returned the lowest enrichment p (EASE score modification of the Fisher exact test)value for a given KEGG term was used to position that term on the map. Time of day is expressed in “Circadian Time (CT)”, with CT0 representing the beginning of the light phase and CT12 the beginning of the dark phase. Terms which were also enriched in the master list of 1190 probes (without consideration of acrophase) are bolded. Terms whose enrichment at p<0.05 depended on the inclusion of leukocyte-associated genes (see Methods) are colored red. For clarity, only terms with enrichment p values <0.01 are depicted. Note for 2 KEGG Terms (Circadian Rhythm and Systemic Lupus Erythemasosis), there were 2 optima in p values in the basal state and so both are depicted. Please refer to Supplementary Tables 3 and 4 for complete depiction of our analysis with and without the inclusion of leukocyte associated genes.
Figure 2
Figure 2
Endotoxemia alters clock gene expression patterns and the composition of the lung circadian transcriptome. (a) Expression patterns of core circadian clock genes in mouse lung during the basal state (blue line) and endotoxemia (red line). Each data point represents the mean Log2MFI (n=3–4 mice) derived from Microarray Experiment #2, which were housed under constant light (LL 12:12) conditions. Statistical significance as determined via one-way ANOVA is depicted. Genes exhibiting qualitatively similar expression patterns during endotoxemia are enclosed together in colored rectangles (monotonic induction of expression (bmal1, npas2; blue rectangle), depression of circadian amplitude (per2, dbp, nr1d2; red rectangle), and retention of rhythmic expression but with an altered pattern (clock, cry2, per1; green rectangle)). Probe identifications and rhythm analysis for these data are listed in Supplementary Data 4. (b) Venn diagram depicting the extent of overlap between the basal and endotoxin-associated circadian transcriptome.
Figure 3
Figure 3
Temporal map of KEGG terms enriched in endotoxemia-specific circadian transcriptome of mouse lung. The 4-hour phase interval that returned the lowest enrichment p (EASE score modification of the Fisher exact test) value for a given KEGG term was used to position that term on the map. Terms which were also enriched in the master list of 2517 probes (without consideration of acrophase) are bolded. Terms whose enrichment at p<0.05 depended on the inclusion of leukocyte-associated genes (see Methods) are colored red. For clarity, only terms with enrichment p values <0.01 are depicted. Please refer to Supplementary Data 6 and 7 for complete depiction of our analysis with and without the inclusion of leukocyte associated genes.
Figure 4
Figure 4
Endotoxemia regulates circadian period length and acrophase. (a) Histogram depicting the distribution of period lengths (τ) for the microarray probes exhibiting significant rhythmic oscillations in normal mouse lung (n=1190) and endotoxemia (n=668). The black and blue lines represent data from the basal groups of Microarray Experiments #1 and #2. The red line represents period lengths from the endotoxemia group of Microarray Experiment #2. (b) Histogram depicting changes in period length for individual probes, comparing the basal state in two independent microarray experiments (reflective of inter-experimental variability), versus changes as a result of endotoxemia. The black line represents period length differences between basal groups of Microarray Experiments #1 and #2 (n=1190). The red line represents period length differences between basal and endotoxemia groups of Microarray Experiment #2 (n=668). (c) Histogram depicting the distribution of acrophases (ϕ) for the lung circadian transcriptome in the basal state versus endotoxemia. The blue and black lines represent data from the control groups of Microarray Experiments #1 and #2, respectively (n=1190). The red line represents acrophases during endotoxemia in Microarray Experiment #2 for probes whose period lengths were of circadian-like duration (between 15–36 hours (n=291)). (d) Histogram of acrophase differences for individual probes. The black line represents acrophase differences between the basal groups of Microarray Experiments #1 and #2 (n=1190). The red line represents acrophase differences between the basal and endotoxemia groups of Microarray Experiment #2 (n=291). (e) Schematic of an idealized waveform with the circadian rhythm characteristics of period and acrophase highlighted in yellow.
Figure 5
Figure 5
Circadian variation in mouse lung leukocytes in the basal state and endotoxemia. (a,b) Flow cytometric measurement of CD45+ cell number normalized to the time-averaged mean from dissociated whole lungs (a) and spleens (b). See Supplementary Fig. 10 for representative gates. Data points represent the mean ± SE (n=4–6 mice). Data from 2 independent time-series experiments are aligned on the time coordinate (expressed in units of CT). Statistical significance (via one-way ANOVA) and best fit rhythm parameters are depicted where appropriate. The estimated best fit cosine curve (black line) is also plotted. (c) Circadian variation in CD45+ cell counts in bmal1-null and wt lungs. Data represent the mean of n=5 mice ± SE. Statistical significance was determined by 2-tailed t-test. (d) Representative IHC depicting B220+ B-cell number at two time points (representing the peak and nadir of abundance), as well as CD31+ endothelial cells (colored orange). Scale bar= 200µm. (e–h) Leukocyte rhythms in the mouse lung as measured by IHC. Blue lines represent positive pixel counts from healthy lungs, and red lines represent endotoxemic lungs. Each point represents the mean normalized positive pixel count ± SE (n=2–3). (e) CD45 staining. (f) B220 staining. (g) CD31 staining. (h) MPO staining. Statistical significance via one-way ANOVA is depicted in the legends. The results depicted represent positive pixel counts of at least moderate intensity as specified by the commercial algorithm (see Methods), but results were similar using both higher and lower thresholds (see Supplementary Data 8 for tabular presentation of these data). Note that mice used for flow cytometry experiments (panels a–c) were housed under constant dark (DD 12:12) conditions, and mice used for IHC (panels d–h) derived from microarray experiment #2 and were housed under constant light (LL 12:12 conditions).
Figure 6
Figure 6
The lung circadian transcriptome and metabolome exhibit temporal coupling during endotoxemia. (a) Period length distributions for the basal lung circadian metabolome (thick blue line, closed triangles), and transcriptome (thin blue line, closed circles). (b) Histogram comparison of acrophases for the basal lung circadian metabolome (thick blue line, closed orange squares), and transcriptome (thin blue line, closed black squares). (c) Histogram comparison of period lengths during endotoxemia for rhythmic metabolites (red line, closed circles), and rhythmic gene expression (brown line, closed triangles). (d) Histogram comparison of acrophases during endotoxemia for rhythmic metabolites (red line, black squares), and rhythmic gene expression (brown, brown squares). For clarity, only metabolites and probes exhibiting periods of 15–36 hours are depicted. All biological samples for were obtained from mice used for microarray experiment 2.
Figure 7
Figure 7
Representative metabolite abundances over time meant to illustrate the diverse effects of endotoxemia on the lung circadian metabolome. Each data point represents the mean metabolite abundance (n=3) scaled to the median (see Methods). Statistical significance via one-way ANOVA and Pearson’s r values comparing basal to endotoxemic lungs are depicted. (a) Cytidine 5’-diphosphocholine. (b) Trigonelline. (c) 5-HETE. (d) Isovalerylcarnitine. (e) Adenine.
Figure 8
Figure 8
Effect of lung endotoxemia on metabolite-sensing pathways known to regulate clock gene expression patterns. Lung homogenates used for these measurements were derived from Microarray Experiment #2. (a,b) Mean levels of NAD+ (a), and NADP+ nucleotides (b) in basal and endotoxemic lungs. Each point represents data obtained from pooled lung homogenates (n=3). Blue lines represent lungs from PBS-treated animals and red lines represent lungs from endotoxemic animals. Significance values for each curve are depicted (ANOVA periodogram assuming τ=12 hours). (c) Western blot analysis of phospho-rS6 (Ser 235/236) and phospho-AMPKα1/2 (Thr 172) abundance over time in normal and endotoxemic lungs. Each lane represents 25 µg total protein pooled from n=3 lungs. Similar results were obtained in 2 independent time series experiments. (c,d) Densitometric measurement of phsopho-rS6/total rS6 ratio (d) and phospho-AMPKα/ total AMPKα ratio (e). Blue lines represent data from normal lungs and red lines represent data from endotoxemic lungs. A best fit single harmonic cosine curve is depicted where appropriate. For tabular depiction of COSOPT rhythm analyses of NAD+ levels, NADP+ levels, phsopho-rS6/total rS6 ratio and phospho-AMPKα/ total AMPKα ratio please see Supplementary Data 11. Full images of the western blots are depicted in Supplementary Fig. 12. Note that for these experiments data were collected under constant light (LL 12:12) conditions.
Figure 9
Figure 9
Temporal regulation of uric acid metabolism during endotoxemia. Each point represents the mean (n=3). Statistical significance via one-way ANOVA is depicted in the legends. (a) Urate level in the basal (blue line) and endotoxemic states (red line). For endotoxemic lung the linear trend is depicted as a dotted line. (b) Urate level (red line) versus mpo expression (green line). (c) Allantoin level (blue line) versus MPO+ granulocyte abundance in endotoxemic lungs (green line). (d) Urate level vs. nrlp3 expression (black line). Note that mice used for these experiments were derived from microarray experiment #2 and were housed under constant light (LL 12:12) conditions.
Figure 10
Figure 10
Bmal1 deficiency has selective effects on lung circadian gene expression and granulocyte trafficking during endotoxemia (a–d) qPCR analysis of cldn2 (a), ace (b), ifn-γ (c), and mpo (d) gene expression. Each data point represents mean expression normalized to β-actin ± SE (n=3–4). Significance values via one-way ANOVA are depicted within each graph. Red lines represent lungs from bmal1-null mice treated with 10 mg/kg endotoxin i.p. directly before the first time point and kept under constant light (LL 12:12) conditions. Blue lines represent lungs from endotoxemic wt littermates, and black lines represent lungs from untreated wt mice. For ease of comparison corresponding expression data from Microarray Experiment #2 is shown in Supplementary Fig. 11. (e) Representative IHC depicting MPO+ granulocyte counts at CT19.5. Scale bar= 60µm. (f) MPO+ granulocyte counts in mouse lung over time as measured by IHC. Each point represents the mean normalized positive pixel count ± SE (n=3–4). Red lines represent endotoxemic lungs from bmal1-null mice, blue lines represent lungs from endotoxemic wt littermates, and black lines represent lungs from untreated wt mice. Significance values via one-way ANOVA are depicted within each graph. The results depicted represent positive pixel counts of moderate intensity as specified by the commercial algorithm (see Methods). See Supplementary Data 14 for COSOPT rhythm analysis of these data.

References

    1. Green CB, Takahashi JS, Bass J. The meter of metabolism. Cell. 2008;134:728–742. - PMC - PubMed
    1. Mackey SR. Biological Rhythms Workshop IA: molecular basis of rhythms generation. Cold Spring Harb Symp Quant Biol. 2007;72:7–19. - PubMed
    1. Ptitsyn AA, et al. Circadian clocks are resounding in peripheral tissues. PLoS Comput Biol. 2006;2:e16. - PMC - PubMed
    1. Richards J, Gumz ML. Advances in understanding the peripheral circadian clocks. FASEB J. 2012;26:3602–3613. - PMC - PubMed
    1. Storch KF, et al. Extensive and divergent circadian gene expression in liver and heart. Nature. 2002;417:78–83. - PubMed

Publication types

MeSH terms

Associated data