. 2014 Nov 15;25(23):3765-78.
doi: 10.1091/mbc.E14-04-0895. Epub 2014 Sep 10.

The RNA-binding protein Staufen1 impairs myogenic differentiation via a c-myc-dependent mechanism

Affiliations

The RNA-binding protein Staufen1 impairs myogenic differentiation via a c-myc-dependent mechanism

Aymeric Ravel-Chapuis et al. Mol Biol Cell. .

Abstract

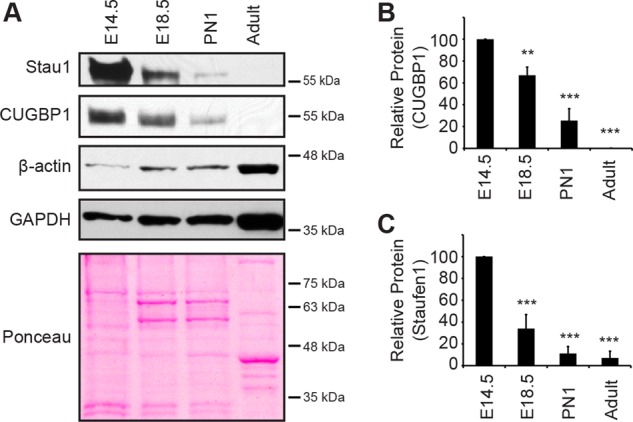
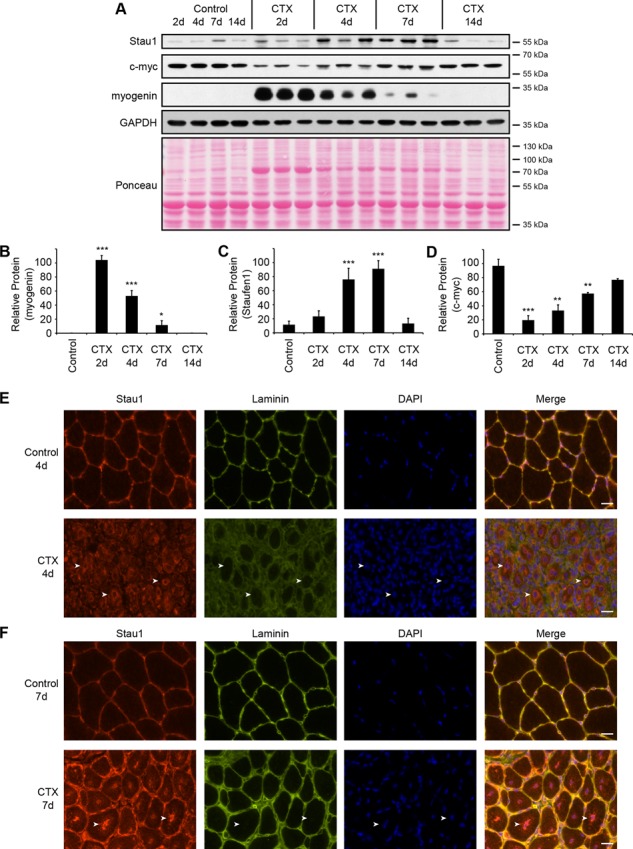
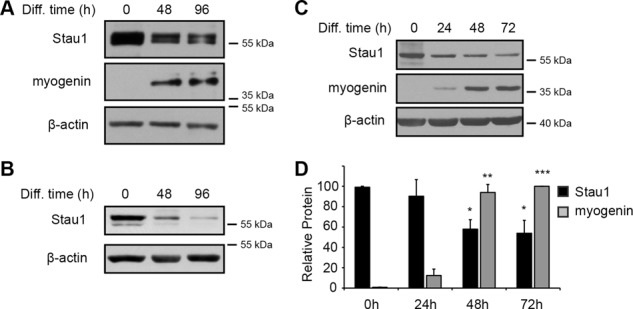
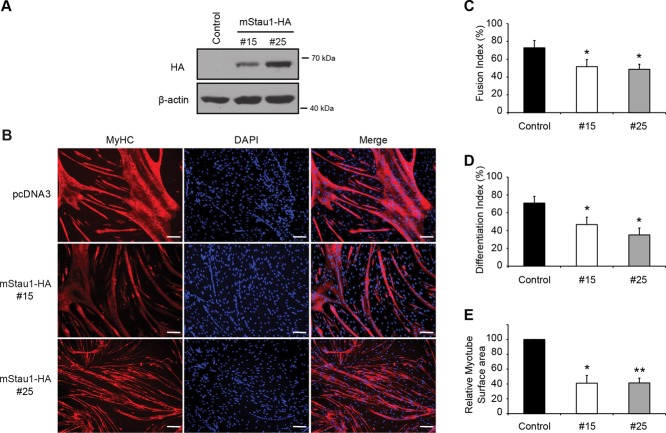
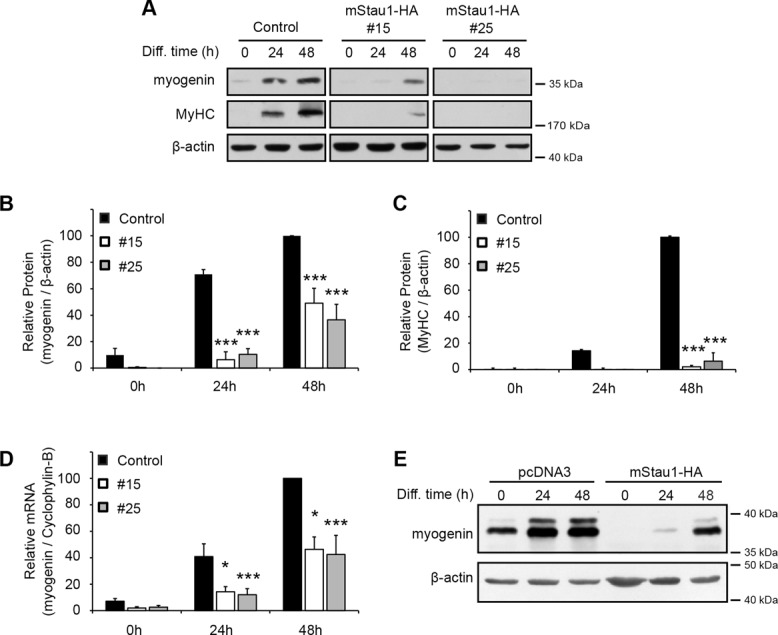
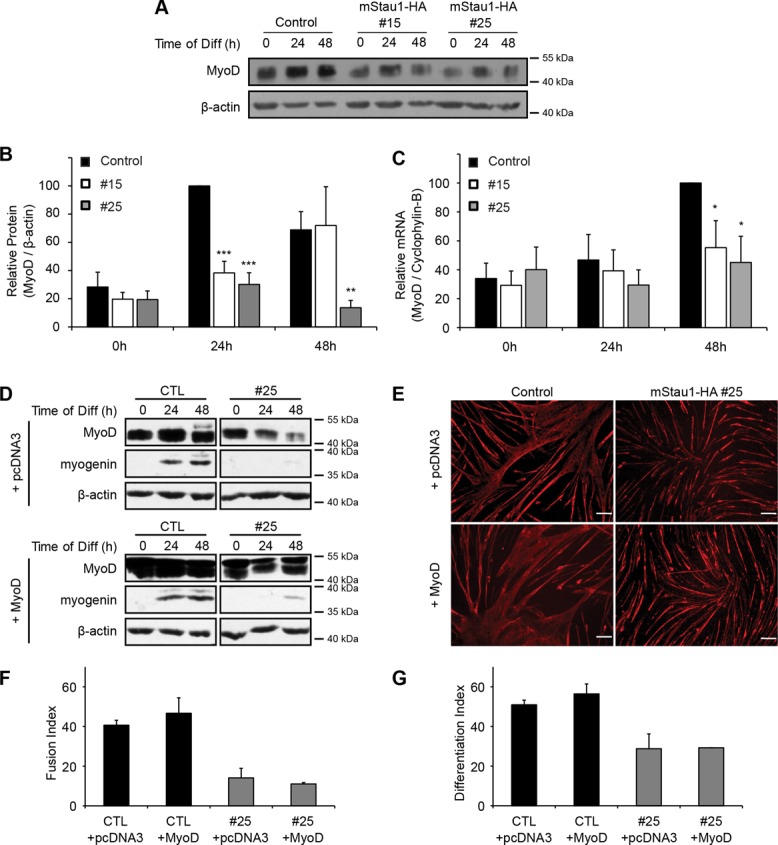
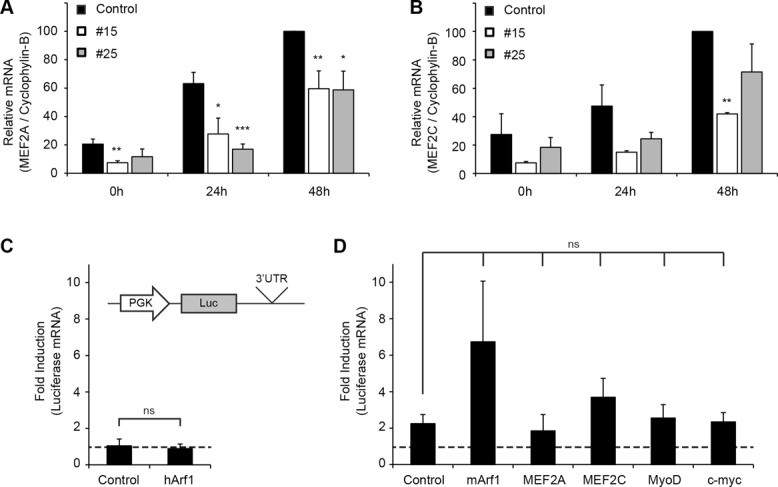
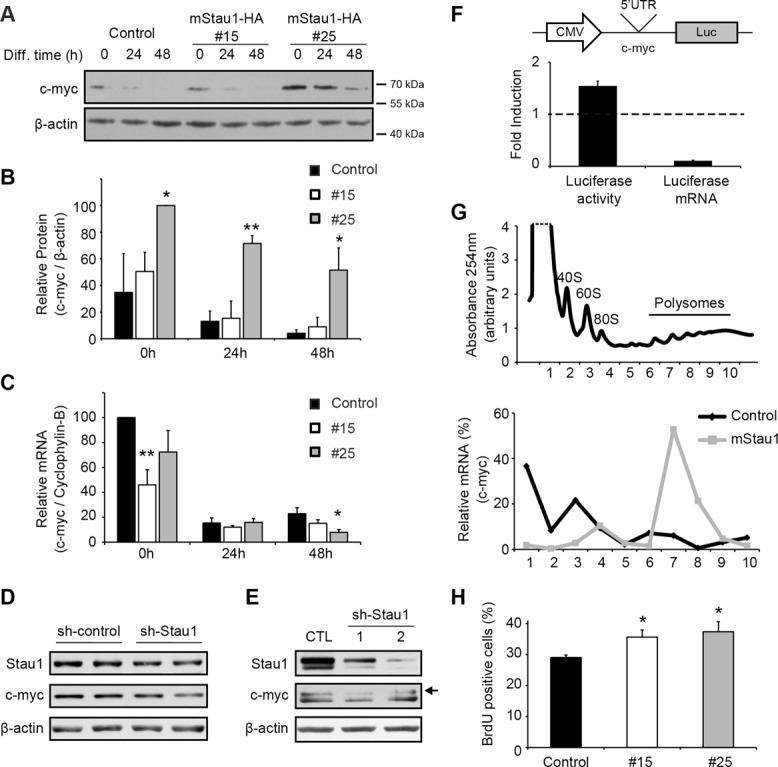
Recent work has shown that Staufen1 plays key roles in skeletal muscle, yet little is known about its pattern of expression during embryonic and postnatal development. Here we first show that Staufen1 levels are abundant in mouse embryonic muscles and that its expression decreases thereafter, reaching low levels in mature muscles. A similar pattern of expression is seen as cultured myoblasts differentiate into myotubes. Muscle degeneration/regeneration experiments revealed that Staufen1 increases after cardiotoxin injection before returning to the low levels seen in mature muscles. We next prevented the decrease in Staufen1 during differentiation by generating stable C2C12 muscle cell lines overexpressing Staufen1. Cells overexpressing Staufen1 differentiated poorly, as evidenced by reductions in the differentiation and fusion indices and decreases in MyoD, myogenin, MEF2A, and MEF2C, independently of Staufen-mediated mRNA decay. However, levels of c-myc, a factor known to inhibit differentiation, were increased in C2C12 cells overexpressing Staufen1 through enhanced translation. By contrast, the knockdown of Staufen1 decreased c-myc levels in myoblasts. Collectively our results show that Staufen1 is highly expressed during early stages of differentiation/development and that it can impair differentiation by regulating c-myc, thereby highlighting the multifunctional role of Staufen1 in skeletal muscle cells.


Figures

FIGURE 1:
FIGURE 1:
Staufen1 decreases in developing wild-type muscle. (A) Representative Western blots showing Staufen1, CUGBP1, β-actin, and GAPDH protein levels during skeletal muscle development. Samples were from embryos (E14.5 and E18.5), new-born mice (PN1), and adult mice (14 wk). Ponceau staining was used to show equal loading. (B, C) Relative quantification of Staufen1 and CUGBP1 protein levels, respectively (n = 3). Asterisks indicate significance (**p ≤ 0.01, ***p ≤ 0.001).
FIGURE 2:
FIGURE 2:
Staufen1 expression is modulated during skeletal muscle degeneration/regeneration. (A) Western blots showing Staufen1, c-myc, and myogenin protein levels in regenerating TA muscles. TA muscles were injected with CTX to induce muscle degeneration and harvested at 2, 4, 7, and 14 d postinjection. Saline-injected muscles were used as controls. GAPDH and Ponceau staining were used to show equal loading. (B–D) Relative quantification of myogenin, Staufen1, and c-myc expression levels, respectively (n = 3). (E, F) Immunofluorescence on cryostat cross sections of control and CTX-injected TA muscles. Sections were stained with a Staufen1 (red) and laminin (green) antibodies and nuclei with DAPI (blue). Arrows point to marked staining of Staufen1. Same exposure parameters were used to allow the comparison of signal intensity. Using these parameters, a no-primary-antibody control shows no signal. Scale bars, 20 μm. Asterisks indicate significance (*p ≤ 0.05, **p ≤ 0.01, and ***p ≤ 0.001).
FIGURE 3:
FIGURE 3:
Staufen1 decreases during myogenic differentiation. (A, B) Western blots showing Staufen1 and myogenin protein levels in differentiating SkMCs and HSMM, respectively. β-Actin was used as a loading control. (C) Representative Western blots showing Staufen1 and myogenin protein levels in differentiating C2C12 cells. β-Actin was used to show equal loading. (D) Relative quantification of Staufen1 and myogenin protein levels from differentiating C2C12 cells, respectively (n = 3). Asterisks indicate significance (*p ≤ 0.05, **p ≤ 0.01, ***p ≤ 0.001).
FIGURE 4:
FIGURE 4:
Staufen1 overexpression inhibits myogenic differentiation. (A) Representative Western blots showing expression of Staufen1-HA in stable C2C12 cell lines. Two clones displaying transgene expression were chosen (#15 and #25), along with a control stable cell line. (B) Immunofluorescence of stable cell lines after 96 h of differentiation. Cells were stained with a pan-MyHC antibody (red) and nuclei with DAPI (blue). Scale bars, 100 um. (C) Fusion index (n = 5), (D) differentiation index (n = 5), and (E) myotube surface area (n = 3) of stable cell lines after 96 h of differentiation. Asterisks indicate significance (*p ≤ 0.05, **p ≤ 0.01).
FIGURE 5:
FIGURE 5:
Staufen1 decreases the expression of the myogenic markers myogenin and MyHC. (A) Representative Western blots showing myogenin and MyHC expression during differentiation of Staufen1-HA–stable C2C12 cells. β-Actin was used to show equal loading. (B, C) Relative quantification of myogenin and MyHC protein levels, respectively (n = 3). (D) Relative quantification of myogenin mRNA levels as determined by qRT-PCR (n = 4). Levels were normalized to cyclophylin-B. (E) C2C12 cells were transiently transfected with mouse Staufen1-HA or a control empty vector (pcDNA3). At 24 h after transfection, cells were switched to differentiation medium and differentiated for the indicated time. Western blots showing myogenin expression in transfected cells. β-Actin was used as a loading control. Asterisks indicate significance (*p ≤ 0.05, ***p ≤ 0.001).
FIGURE 6:
FIGURE 6:
MyoD does not rescue the differentiation defect. (A) Representative Western blots showing MyoD protein level during myogenic differentiation of Staufen1-HA–stable cell lines. β-Actin was used as a loading control. (B) Relative quantification of MyoD protein levels normalized to β-actin (n = 4). (C) Relative quantification of MyoD mRNA levels as determined by qRT-PCR. Levels were normalized to cyclophylin-B (n = 4). (D) Stable cell lines were transfected with control or MyoD expression vectors. At 24 h after transfection, cells were allowed to differentiate for the indicated time period. Western blots showing MyoD (lower band, endogenous MyoD; upper band, ectopic MyoD-Flag-myc protein) and myogenin expression levels. β-Actin was used to show equal loading. (E) Immunofluorescence using a pan-MyHC antibody. (F, G) Fusion and differentiation indices of C2C12 cells differentiated for 72 h. Scale bars, 100 μm. Asterisks indicate significance (*p ≤ 0.05, **p ≤ 0.01, ***p ≤ 0.001).
FIGURE 7:
FIGURE 7:
MEF2A, MEF2C, MyoD, and c-myc are not SMD targets. (A, B) Relative quantification of MEF2A and MEF2C mRNA levels in stable C2C12 cells as determined by qRT-PCR. Levels were normalized to cyclophylin-B (n = 4 and 3, respectively). (C) HeLa cells were cotransfected with luciferase vectors containing control or human Arf1 3′UTR together with human Staufen1. After transfection, relative levels of luciferase mRNAs were determined by qRT-PCR and normalized to 18S. Data were also normalized to the level of luciferase mRNAs in absence of Staufen1 overexpression. (D) HeLa cells were cotransfected with luciferase vectors containing control or mouse Arf1, MEF2A, MEF2C, MyoD, or c-myc 3′UTRs together with mouse Staufen1. Data were analyzed as in C (n = 3). Asterisks indicate significance (*p ≤ 0.05, **p ≤ 0.01, ***p ≤ 0.001); ns, not significant.
FIGURE 8:
FIGURE 8:
Staufen1 overexpression increases c-myc protein expression levels and cell proliferation. (A) Representative Western blot showing c-myc protein levels during myogenic differentiation of stable C2C12 cells. β-Actin was used to show equal loading. (B) Relative quantification of c-myc protein levels normalized to β-actin (n = 3). (C) Relative quantification of c-myc mRNA level in stable cell lines as determined by qRT-PCR. Levels were normalized to cyclophylin-B (n = 3). (D) C2C12 cells were transfected with sh-Staufen1 or control vectors. Western blots showing decreased Staufen1 and c-myc protein levels. β-Actin was used to show equal loading. (E) HSSM primary cells were transduced with sh-Staufen1 or control lentiviruses. Western blots were performed as in D. The arrow shows the specific c-myc band, as determined in separate experiments by knocking down c-myc expression (unpublished data). (F) 293T cells were cotransfected with luciferase vectors containing the c-myc 5′UTR and with Staufen1 or control plasmids. After transfection, the relative activity of luciferase was determined along with luciferase mRNA levels by qRT-PCR. Data are also normalized to luciferase levels in absence of Staufen1 and to an empty vector (n = 3). (G) Polysome profiling of proliferating stable C2C12 cells. Top, polysome profile obtained by continuous reading of absorbance at 254 nm. Bottom, levels of c-myc mRNAs were measured by qRT-PCR from 10 1-ml sucrose gradient fractions. (H) Cell proliferation assays performed with stable C2C12 cell lines (n = 3). Asterisks indicate significance (*p ≤ 0.05, **p ≤ 0.01).

References

    1. Amack JD, Mahadevan MS. The myotonic dystrophy expanded CUG repeat tract is necessary but not sufficient to disrupt C2C12 myoblast differentiation. Hum Mol Genet. 2001;10:1879–1887. - PubMed
    1. Amack JD, Reagan SR, Mahadevan MS. Mutant DMPK 3’-UTR transcripts disrupt C2C12 myogenic differentiation by compromising MyoD. J Cell Biol. 2002;159:419–429. - PMC - PubMed
    1. Amirouche A, Tadesse H, Lunde JA, Belanger G, Cote J, Jasmin BJ. Activation of p38 signaling increases utrophin A expression in skeletal muscle via the RNA-binding protein KSRP and inhibition of AU-rich element-mediated mRNA decay: implications for novel DMD therapeutics. Hum Mol Genet. 2013;22:3093–3111. - PubMed
    1. Apponi LH, Corbett AH, Pavlath GK. RNA-binding proteins and gene regulation in myogenesis. Trends Pharmacol Sci. 2011;32:652–658. - PMC - PubMed
    1. Beauchamp P, Nassif C, Hillock S, van der Giessen K, von Roretz C, Jasmin BJ, Gallouzi IE. The cleavage of HuR interferes with its transportin-2-mediated nuclear import and promotes muscle fiber formation. Cell Death Differ. 2010;17:1588–1599. - PubMed

Publication types

MeSH terms

LinkOut - more resources