Multicenter Study
. 2014 Nov;137(Pt 11):3036-46.
doi: 10.1093/brain/awu256. Epub 2014 Sep 9.

A disease-specific metabolic brain network associated with corticobasal degeneration

Affiliations
Multicenter Study

A disease-specific metabolic brain network associated with corticobasal degeneration

Martin Niethammer et al. Brain. 2014 Nov.

Abstract

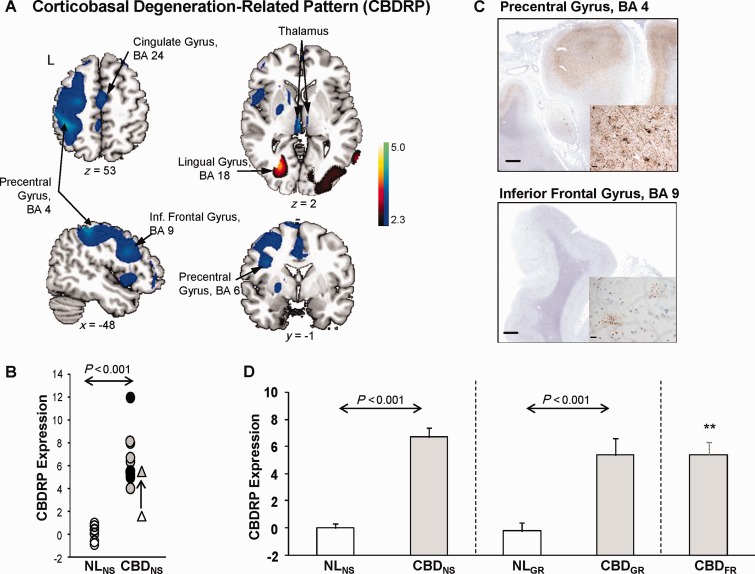
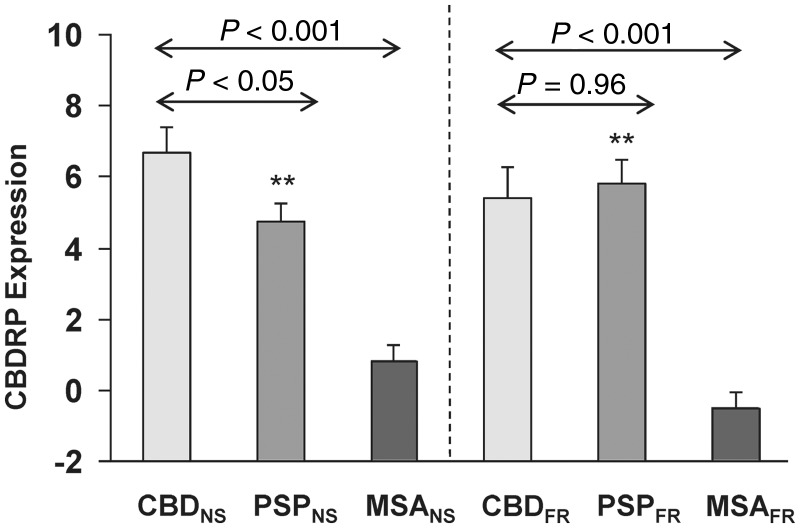
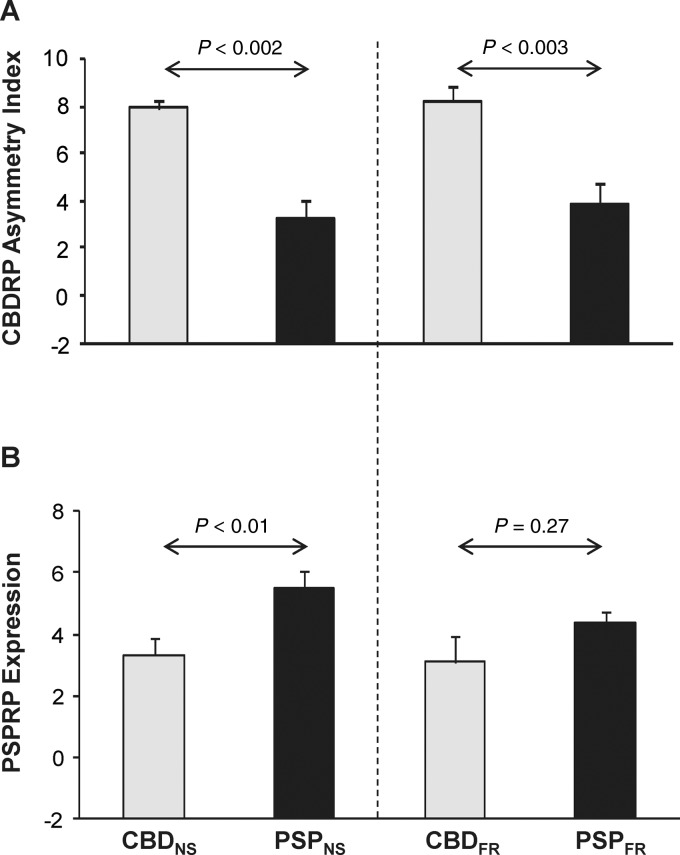
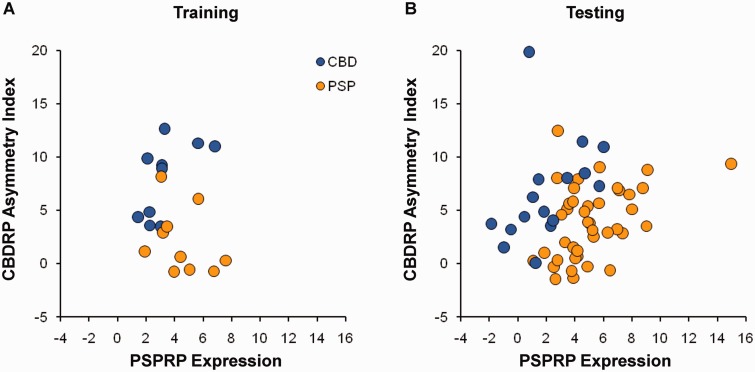
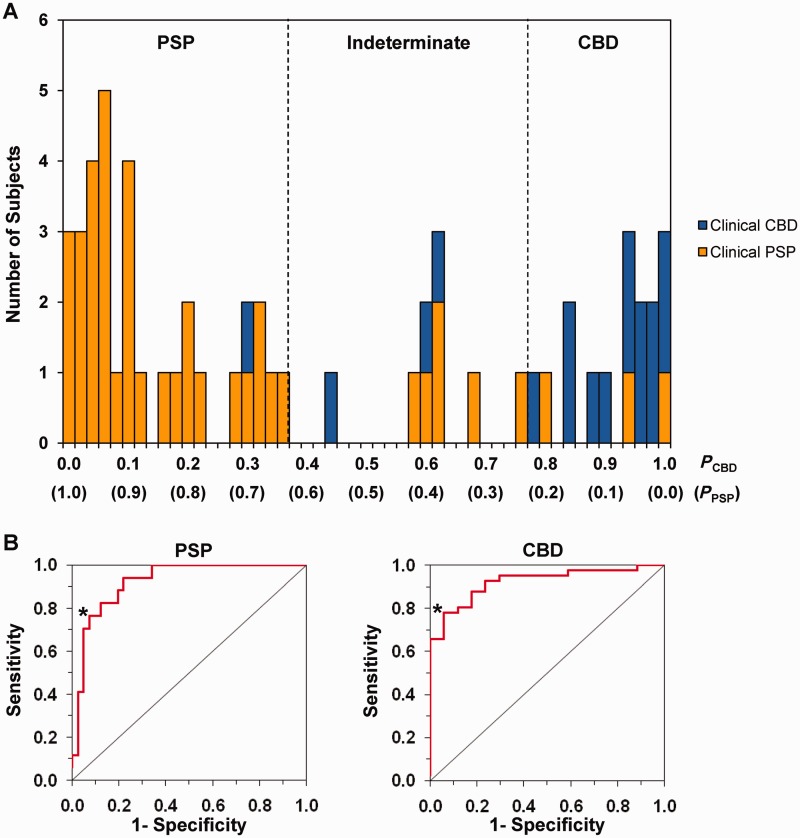
Corticobasal degeneration is an uncommon parkinsonian variant condition that is diagnosed mainly on clinical examination. To facilitate the differential diagnosis of this disorder, we used metabolic brain imaging to characterize a specific network that can be used to discriminate corticobasal degeneration from other atypical parkinsonian syndromes. Ten non-demented patients (eight females/two males; age 73.9 ± 5.7 years) underwent metabolic brain imaging with (18)F-fluorodeoxyglucose positron emission tomography for atypical parkinsonism. These individuals were diagnosed clinically with probable corticobasal degeneration. This diagnosis was confirmed in the three subjects who additionally underwent post-mortem examination. Ten age-matched healthy subjects (five females/five males; age 71.7 ± 6.7 years) served as controls for the imaging studies. Spatial covariance analysis was applied to scan data from the combined group to identify a significant corticobasal degeneration-related metabolic pattern that discriminated (P < 0.001) the patients from the healthy control group. This pattern was characterized by bilateral, asymmetric metabolic reductions involving frontal and parietal cortex, thalamus, and caudate nucleus. These pattern-related changes were greater in magnitude in the cerebral hemisphere opposite the more clinically affected body side. The presence of this corticobasal degeneration-related metabolic topography was confirmed in two independent testing sets of patient and control scans, with elevated pattern expression (P < 0.001) in both disease groups relative to corresponding normal values. We next determined whether prospectively computed expression values for this pattern accurately discriminated corticobasal degeneration from multiple system atrophy and progressive supranuclear palsy (the two most common atypical parkinsonian syndromes) on a single case basis. Based upon this measure, corticobasal degeneration was successfully distinguished from multiple system atrophy (P < 0.001) but not progressive supranuclear palsy, presumably because of the overlap (∼ 24%) that existed between the corticobasal degeneration- and the progressive supranuclear palsy-related metabolic topographies. Nonetheless, excellent discrimination between these disease entities was achieved by computing hemispheric asymmetry scores for the corticobasal degeneration-related pattern on a prospective single scan basis. Indeed, a logistic algorithm based on the asymmetry scores combined with separately computed expression values for a previously validated progressive supranuclear palsy-related pattern provided excellent specificity (corticobasal degeneration: 92.7%; progressive supranuclear palsy: 94.1%) in classifying 58 testing subjects. In conclusion, corticobasal degeneration is associated with a reproducible disease-related metabolic covariance pattern that may help to distinguish this disorder from other atypical parkinsonian syndromes.

Keywords: FDG PET; brain networks; corticobasal degeneration; differential diagnosis; glucose metabolism.


Figures

Figure 1
Figure 1
Corticobasal degeneration-related pattern. (A) Corticobasal degeneration-related pattern (CBDRP) identified by spatial covariance analysis of FDG PET scans from a derivation cohort of 10 patients with CBD and 10 normal control (NL) subjects scanned at the North Shore University Hospital (eight CBD and 10 control subjects) and Stanford University (two CBD subjects). This pattern was characterized by metabolic reductions in the left frontal and parietal lobes, precentral gyrus, thalamus, and caudate head, associated with increased metabolism in the left occipital lobe, left lingual gyrus, right occipital lobe and right inferior occipital gyrus. [The display represents regions that contributed significantly to the network at Z = 2.33 (P < 0.01) and were demonstrated to be reliable (P = 0.01; 1000 iterations) by bootstrap resampling. Voxels with positive region weights (metabolic increases) are colour-coded red and those with negative region weights (metabolic decreases) are colour-coded blue. Left hemisphere is labelled as ‘L’]. (B) In this derivation sample, individual CBDRP expression significantly (P < 0.001, permutation test) separated the 10 patients with CBD (CBDNS; filled circles) from the 10 normal controls (NLNS; open circles). The three pathologically confirmed cases are indicated by black filled circles. One subject with CBD also had undergone FDG PET 3 years before the scan included in the derivation sample. For this subject, CBDRP expression was 1.64 at the initial scan, and was then increased to 5.50 3 years later when the same subject carried a diagnosis of CBD (open and filled triangles, respectively). (C) Top: Cortico-subcortical micrograph of the precentral gyrus (BA4) from a section stained with AT8 antibodies directed against phosphorylated tau. On general survey, the labelling was diffuse, blurring the cortico-subcortical demarcation. Inset: Strong labelling was seen of neuropil threads, astrocytes, and scattered neurons. Bottom: Cortico-subcortical micrograph from the same specimen showing AT8 staining in the inferior frontal gyrus (BA9). Inset: In contrast to BA4, the cortico-subcortical demarcation is discrete and the tauopathic burden consists only of occasional astrocytic plaques and rare neuropil threads. Scale bars = 1.0 cm; inset = 15 µm. (D) Validation of CBDRP in two independent testing cohorts: CBDGR (10 patients with CBD and 10 age-matched normal controls scanned at University Medical Centre Groningen) and CBDFR (seven patients with CBD scanned at the University of Freiburg). As in the derivation CBDNS cohort (left; P < 0.001, Mann-Whitney test), pattern expression was significantly elevated in the CBDGR patients compared to the NLGR controls (middle; P < 0.001). Likewise, pattern expression in CBDFR (right) was significantly elevated relative to both the NLNS (P = 0.001) and NLGR (P < 0.001) groups. Indeed, average elevation of CBDRP expression was not different (P = 0.55, Kruskal-Wallis test) between the derivation and the two validation CBD groups. Error bars represent SE. **P ≤ 0.001, Mann-Whitney tests, compared to normal control subjects (NL).
Figure 2
Figure 2
CBDRP expression in atypical parkinsonian syndromes. Left: CBDRP expression in 10 patients with CBD (CBDNS), 30 patients with PSP (PSPNS) and 40 patients with MSA (MSANS) scanned with FDG PET at the North Shore University Hospital. The patients in the CBDNS group showed higher CBDRP expression than both the PSPNS (P < 0.05; Mann-Whitney test) and MSANS (P < 0.001) patient groups. Right: CBDRP expression in independent groups of seven CBD (CBDFR), 21 PSP (PSPFR) and 12 MSA (MSAFR) patients scanned with FDG PET at the University of Freiburg. In these groups, CBDRP expression was significantly elevated in the patients with CBD compared with the patients with MSA (P < 0.001; Mann-Whitney test), but was not different from the patients with PSP (P = 0.96). In addition, both PSPNS and PSPFR patients showed higher CBDRP expression (P < 0.001; Mann-Whitney test) than the normal (NLNS) control subjects. Error bars represent SE. **P ≤ 0.001, Mann-Whitney tests, compared to normal control subjects.
Figure 3
Figure 3
CBDRP asymmetry index and PSPRP expression. (A) The CBDRP asymmetry index was found to be greater in both CBD patient cohorts (CBDNS versus PSPNS: P < 0.002; CBDFR versus PSPFR: P < 0.003; Mann-Whitney tests) than for the respective PSP patient cohorts. (B) Expression of a previously identified PSP-related pattern (PSPRP) (Eckert et al., 2008) was significantly higher in the PSPNS group relative to the CBDNS group (P < 0.01; Mann-Whitney test), but was not different between the PSPFR and CBDFR groups (P = 0.27). Error bars represent SE.
Figure 4
Figure 4
CBDRP asymmetry index and PSPRP expression in individual CBD and PSP patients. (A) Using logistic regression analysis, we found that a discriminant function using CBDRP asymmetry index and PSPRP expression resulted in the best differentiation between CBDNS and PSPNS2 = 15.6, P = 0.0004; likelihood ratio test) (see text). Scatter plot displays the CBDRP asymmetry index and PSPRP expression in the training sample of 10 patients with CBD and 10 age-matched patients with PSP. (B) The automated algorithm for differential diagnosis was prospectively validated on a case-by-case basis in a testing sample of 58 patients, including 17 patients with CBD and 41 patients with PSP (see text). Scatter plot displays the CBDRP asymmetry index and PSPRP expression for these patients. In both plots, CBD and PSP patients are indicated by blue and orange circles, respectively.
Figure 5
Figure 5
Results of the automated algorithm for differential diagnosis between CBD and PSP. (A) Frequency distribution diagram illustrating the disease probabilities of CBD and PSP calculated for the 58 subjects (17 CBD and 41 PSP) in the testing sample. Individual patients were classified as having CBD if the probability value for CBD (PCBD) was >0.78 (i.e. cut-offCBD; 16 subjects located to the right of the right dotted line), and as PSP if the probability value for PSP (PPSP) was >0.63 (i.e. cut-offPSP; 33 subjects located to left of the left dotted line). Patients whose probability values for CBD and PSP were both lower than their corresponding cut-off probabilities were classified as indeterminate cases, i.e. nine subjects located between the left and right dotted lines. The final clinical diagnoses of CBD and PSP patients are indicated by blue and orange bars, respectively. (B) Based on the receiver-operating characteristic (ROC) analysis for all patients in the testing sample, the area-under-the-curve (AUC) for PSP (left) and CBD (right) was 0.92 (P < 0.0001), consistent with that (0.94, P < 0.0001; not shown) of the training sample. The cut-off probability of each disease was determined based on the inflection point (asterisk) on each curve corresponding to the high specificity and sensitivity for classifying individual patients with each disease.

References

    1. Alexander SK, Rittman T, Xuereb JH, Bak TH, Hodges JR, Rowe JB. Validation of the new consensus criteria for the diagnosis of corticobasal degeneration. J Neurol Neurosurg Psychiatry. 2014;85:925–9. - PMC - PubMed
    1. Armstrong MJ, Litvan I, Lang AE, Bak TH, Bhatia KP, Borroni B, et al. Criteria for the diagnosis of corticobasal degeneration. Neurology. 2013;80:496–503. - PMC - PubMed
    1. Boeve BF. The multiple phenotypes of corticobasal syndrome and corticobasal degeneration: implications for further study. J Mol Neurosci. 2011;45:350–3. - PubMed
    1. Boeve BF, Lang AE, Litvan I. Corticobasal degeneration and its relationship to progressive supranuclear palsy and frontotemporal dementia. Ann Neurol. 2003;54(Suppl 5):S15–9. - PubMed
    1. Boxer AL, Geschwind MD, Belfor N, Gorno-Tempini ML, Schauer GF, Miller BL, et al. Patterns of brain atrophy that differentiate corticobasal degeneration syndrome from progressive supranuclear palsy. Arch Neurol. 2006;63:81–6. - PubMed

Publication types

MeSH terms

Substances