. 2014 Nov 1;104(2):258-69.
doi: 10.1093/cvr/cvu205. Epub 2014 Sep 10.

Study familial hypertrophic cardiomyopathy using patient-specific induced pluripotent stem cells

Affiliations

Study familial hypertrophic cardiomyopathy using patient-specific induced pluripotent stem cells

Lu Han et al. Cardiovasc Res. .

Abstract

Aims: Familial hypertrophic cardiomyopathy (HCM) is one the most common heart disorders, with gene mutations in the cardiac sarcomere. Studying HCM with patient-specific induced pluripotent stem-cell (iPSC)-derived cardiomyocytes (CMs) would benefit the understanding of HCM mechanism, as well as the development of personalized therapeutic strategies.

Methods and results: To investigate the molecular mechanism underlying the abnormal CM functions in HCM, we derived iPSCs from an HCM patient with a single missense mutation (Arginine442Glycine) in the MYH7 gene. CMs were next enriched from HCM and healthy iPSCs, followed with whole transcriptome sequencing and pathway enrichment analysis. A widespread increase of genes responsible for 'Cell Proliferation' was observed in HCM iPSC-CMs when compared with control iPSC-CMs. Additionally, HCM iPSC-CMs exhibited disorganized sarcomeres and electrophysiological irregularities. Furthermore, disease phenotypes of HCM iPSC-CMs were attenuated with pharmaceutical treatments.

Conclusion: Overall, this study explored the possible patient-specific and mutation-specific disease mechanism of HCM, and demonstrates the potential of using HCM iPSC-CMs for future development of therapeutic strategies. Additionally, the whole methodology established in this study could be utilized to study mechanisms of other human-inherited heart diseases.

Keywords: Cardiomyocyte; Heart; Hypertrophic cardiomyopathy; Induced pluripotent stem cells.


Figures

Figure 1
Figure 1
Establishment and characterization of HCM iPSCs. (A) Reprogramming of HCM dermal fibroblasts to iPSCs showing pluripotent stem cell morphology with positive AP staining and expression of pluripotency markers, OCT4, NANOG, TRA1-60, and SSEA4. Scale bars, 100 µm. (B) Sanger sequencing to confirm the R442G heterozygous missense mutation in the MYH7 gene from HCM patient-derived iPSCs. (C) Quantitative real-time PCR analysis of human ES cell line H1 and HCM iPSC clone12 and clone17 for detecting the expression of pluripotency marker genes OCT4, SOX2, and NANOG (n = 3). (D) Teratoma formation with HCM iPSCs showing three embryonic germ layers. Scale bar, 50 µm. (E) Karyotyping of HCM iPSCs.
Figure 2
Figure 2
CM differentiation and gene expression profile of HCM iPSC-CMs. (A) The ratios of beating embryoid bodies (n = 4 for each line) at Day 22 of iPSC differentiation and ratios of CMs derived from day 22 EBs of control and HCM iPSCs. Cardiac Troponin T (CTNT) is a marker for CMs. (B) CMs derived from control S3-iPS4 and two clones of HCM iPSCs were used for whole transcriptome sequencing with an Ion Torrent Sequencer (Life Technologies). FPKMs from CMs of two HCM clones and control iPSCs (n = 3, each sample) were averaged and compared, which revealed both up-regulated and down-regulated genes in HCM iPSC-CMs (left panel). Ingenuity IPA bio-functional enrichment analysis was conducted with the up-regulated genes in HCM CMs, with the top enriched bio-functional categories shown in right panel. (C) The connection network of genes enriched in the Proliferation of Cells category. (D) Expression fold changes of HCM-related genes in HCM iPSC-CMs vs. control iPSC-CMs from Y1 and S3 iPSCs. Fold changes were represented as mean ± S.D in a log2 form.
Figure 3
Figure 3
Phenotypic characterization of HCM iPSC-CMs. (A) Representative immunofluorescent images showing increased cell size and nuclear translocated NFATC4 in HCM iPSC-CMs. White frames indicated the multinucleation in HCM iPSC-CMs. Scale bars, 10 µm. (B) Quantification of CM size. n = 105. (C) Ratio of NFATC4 nuclear translocation in control and HCM iPSC-CMs. n = 169. (D) Representative immunostaining of CTNT and α-Actinin to show the sarcomere disorganization in HCM iPSC-CMs. Scale bars, 10 µm. (E) Ratio of sarcomere disorganization in control and HCM iPSC-CMs. n = 150. (F) Transmission Electron Microscopy images of myofibrillar organization in control and HCM iPSC-CMs. Scale bars, 500 nm. Z, Z band. Red arrows indicate the disorganized myofibrils. Error bars show SD. *P < 0.05, **P < 0.01. (Student's t-test).
Figure 4
Figure 4
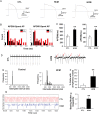
Electrophysiological analyses of HCM iPSC-CMs. (A) Representative action potential recordings from single control and HCM iPSC-CMs. (B) APD50 and APD90 distributions of spontaneously beating CMs. (CTL, n = 23; HCM, n = 41) (C) Quantification of APD50/90 of control and HCM iPSC-CMs. **P < 0.01. (D) Representative MEA extracellular recording from control and HCM iPSC-CMs. HCM iPSC-CMs exhibit elevated arrhythmogenicity. Red arrows indicate the premature beats. (E) Interspike interval (ISI) distribution in control and HCM iPSC-CMs. (F) Quantification of arrhythmogenic events in control and HCM iPSC-CMs. **P < 0.01. (n = 12) (Student's t-test). (G) Beating rhythm analysis of monolayer CMs using the RTCA system. Irregular beating pattern was observed from the HCM iPSC-CMs. (H) Quantification of beating rhythm irregularity during a period of 10 h. Data were collected for every 10 min (n = 10). Error bars show SD. **P < 0.01. (Student's t-test).
Figure 5
Figure 5
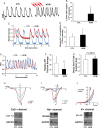
Analysis of calcium handling and ion channels. (A) Representative calcium transient optical mapping indicating irregular calcium transients in HCM iPSC-CMs (Red arrows). (B) Quantification of calcium irregularity in control and HCM iPSC-CMs (n = 30). (C) Representative calcium transient mapping showing elevated resting [Ca2+]i in HCM CMs. (D) Quantification of resting [Ca2+]i in control and HCM CMs (n = 51). (E) Representative image of calcium release in control and HCM CMs post caffeine (5 mM) treatment. (F) Quantification of relative Ca2+ storage in SR (n = 11 control, n = 9 HCM). (G) Quantification of calcium transient decay time in control and HCM CMs. (n = 48 control, n = 50 HCM, P = 2.05E-07). (H) Measurement of ICa followed depolarizing potentials of −130 to 50 mV in 10 mV increments (n = 6) and western blot of Cav1.2 in control and HCM CMs. (I) Measurement of Na+ current magnitudes followed depolarizing potentials of −130 to 50 mV in 10 mV increments (n = 31) and western blot of SCN5A in control and HCM CMs. (J) Measurement of outward K+ currents followed depolarizing potentials of −130 to 50 mV in 10 mV increments (n = 10) and western blot of Kv4.2 in control and HCM CMs. Current-to-Voltage (I–V) relationships were normalized with respect to cell capacitance. Error bars show SD. *P < 0.05. (Student's t-test).
Figure 6
Figure 6
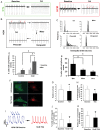
Pharmaceutical treatment of HCM iPSC-CMs. (A) Representative field potentials (MEA) of baseline and post-adrenergic agonist isopreterenol treatment from control and HCM iPSC-derived monolayer CMs. (B) Field potential trace of sequential drug treatments with isopreterenol, metoprolol, verapamil, and pinacidil in HCM iPSC-derived monolayer CMs by MEA. (C) Change of interspike interval of field potentials in HCM CMs after sequential drug treatments. (D) Quantification of arrhythmic events in control and HCM CMs after isopreterenol treatment (n = 5). (E) Quantification of arrhythmic events in HCM CMs with isopreterenol, metopronol, or verapamil treatment, respectively (n = 5) (ANOVA analysis). (F) Representative immunostaining images of HCM CMs without/with the treatment of 10 nM Trichostatin A (TSA) for 3 days. Scale bars, 20 µm. (G) Quantification of size change of HCM CM (n = 77). (H) Ratio of NFATC4 nuclear translocation in HCM CMs (n = 164). (I) Representative Ca2+ transient of HCM CMs with/without TSA (10 nM) treatment for 3 days. (J) Quantification of Ca2+ transient irregularity in HCM CMs (n = 30). (K) Quantification of resting Ca2+ in HCM CMs (n = 30). Error bars show SD. *P < 0.05. (Student's t-test).

Comment in

References

    1. Maron BJ. Hypertrophic cardiomyopathy: a systematic review. JAMA. 2002;287:1308–1320. - PubMed
    1. Ahmad F, Seidman JG, Seidman CE. The genetic basis for cardiac remodeling. Annu Rev Genomics Hum Genet. 2005;6:185–216. - PubMed
    1. Maron BJ, Maron MS, Semsarian C. Genetics of hypertrophic cardiomyopathy after 20 years: clinical perspectives. J Am Coll Cardiol. 2012;60:705–715. - PubMed
    1. Coppini R, Ferrantini C, Yao L, Fan P, Del Lungo M, Stillitano F, Sartiani L, Tosi B, Suffredini S, Tesi C, Yacoub M, Olivotto I, Belardinelli L, Poggesi C, Cerbai E, Mugelli A. Late sodium current inhibition reverses electromechanical dysfunction in human hypertrophic cardiomyopathy. Circulation. 2013;127:575–584. - PubMed
    1. Tomaselli GF, Marban E. Electrophysiological remodeling in hypertrophy and heart failure. Cardiovasc Res. 1999;42:270–283. - PubMed

Publication types

MeSH terms