. 2014 Sep 11:5:4878.
doi: 10.1038/ncomms5878.

A prominent and conserved role for YY1 in Xist transcriptional activation

Affiliations

A prominent and conserved role for YY1 in Xist transcriptional activation

Mélanie Makhlouf et al. Nat Commun. .

Abstract

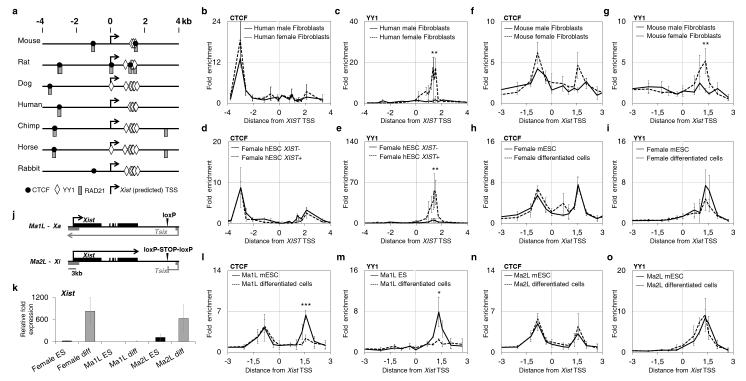
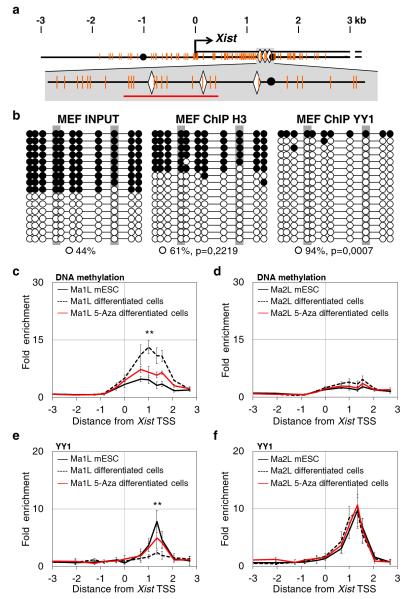
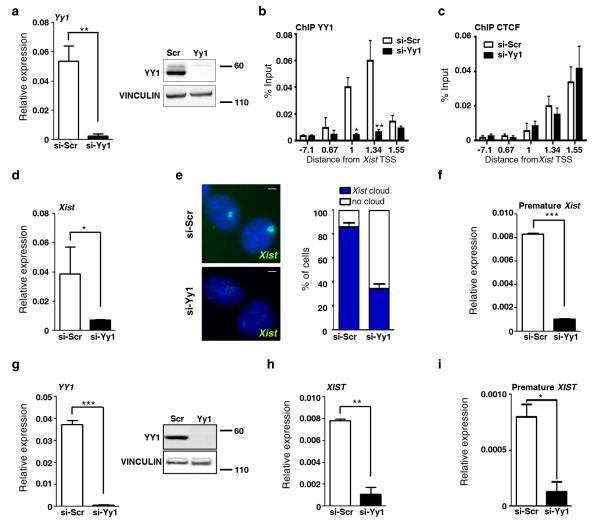
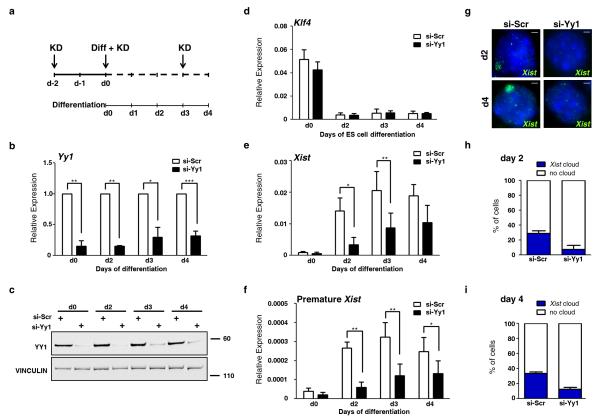
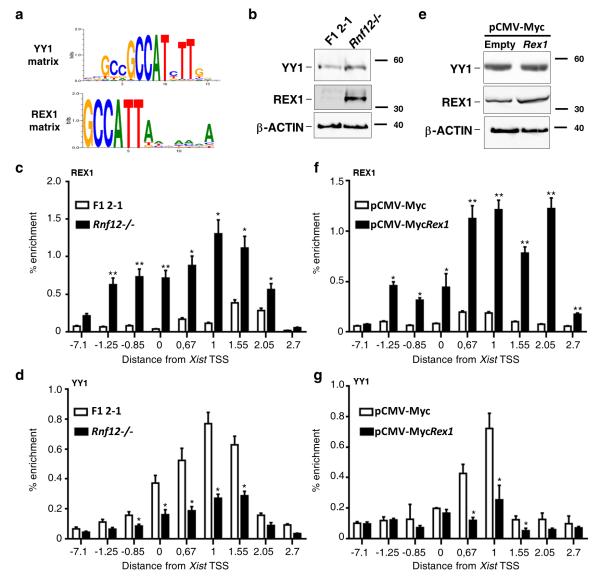
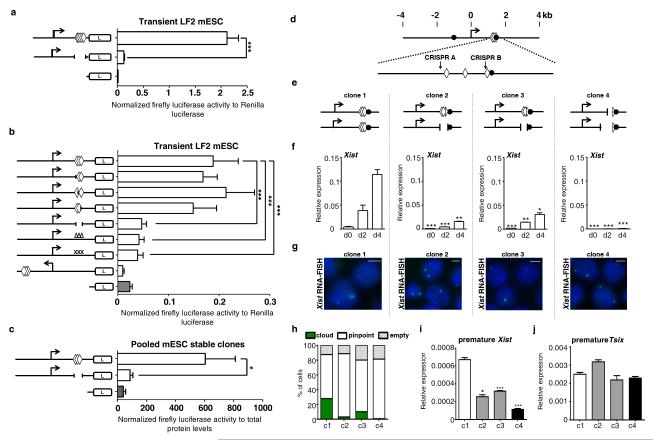
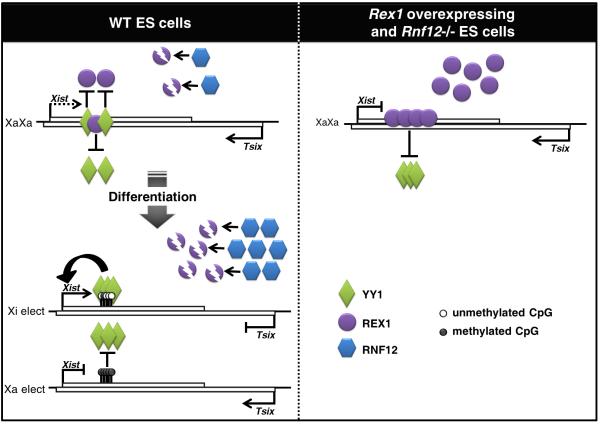
Accumulation of the noncoding RNA Xist on one X chromosome in female cells is a hallmark of X-chromosome inactivation (XCI) in eutherians. Here we uncover an essential function for the ubiquitous autosomal transcription factor Yin-Yang 1 (YY1) in the transcriptional activation of Xist in both human and mouse. We show that loss of YY1 prevents Xist upregulation during the initiation and maintenance of X-inactivation, and that YY1 binds directly the Xist 5' region to trigger the activity of the Xist promoter. Binding of YY1 to the Xist 5' region before XCI competes with the Xist repressor REX1, whereas DNA methylation controls mono-allelic fixation of YY1 to Xist at the onset of XCI. YY1 is thus the first autosomal activating factor involved in a fundamental and conserved pathway of Xist regulation that ensures the asymmetric transcriptional upregulation of the master regulator of XCI.


Figures

Figure 1
Figure 1. YY1 and CTCF specifically bind the active Xist allele in human and mouse cells
(a) Map of Xist 5′ region for 7 eutherian species with the position of consensus binding sequences for CTCF: CC(A/G/T)(G/C)(C/T)AG(A/G)(G/T)G(A/G/T)(A/C/T)(A/G) (black dots), RAD21: CC(A/T)(G/C)(C/T)(A/G/T)G(A/G)(G/T)G(G/T)(A/C) (grey rectangles) and YY1: CGCCAT(A/T/G/C)TT (white diamonds) indicated, (b-e) ChIP analyses of CTCF and YY1 binding in human fibroblasts (IMR-90 for female, MRC-5 for male) and in female H9 hESC expressing XIST (XIST+) or not (XIST−). Values are plotted as average fold enrichment relative to background enrichment levels. (f-i) ChIP analysis of CTCF and YY1 binding on the Xist proximal region in mouse embryonic fibroblasts (MEFs), infemale mESC (LF2) and in LF2 cells differentiated for 4 days using Retinoic Acid (RA). (j) Schematic representation of Xist/Tsix locus in the Ma1L and Ma2L cells, with the transcriptional STOP signal truncating Tsix in Ma2L cells indicated. (k) qRT-PCR analysis of Xist expression in female, Ma1L (male control) and Ma2L (Tsix-truncated) mESC and their differentiated derivatives. Xist levels are represented as fold enrichment relative to female mESC. All samples were normalized to Rplp0 transcript levels. (l-o) ChIP analysis in Ma1L, Ma2L mESC and differentiated cells show maintenance of YY1 and CTCF binding specifically in Xist-expressing Ma2L differentiated cells. For each panel, the average percentage of immunoprecipitation calculated for each position is plotted against the genomic location with respect to the Xist transcriptional start site (TSS, vertical line). At least three independent ChIP experiments from different chromatin extracts were carried out for each cell type. For each panel, statistical evaluation of differences is provided for the position displaying the highest enrichment; *** p<0.001; ** p< 0.01; * p<0.05 (Student’s t-test). Error bars represent Standard Deviation (SD).
Figure 2
Figure 2. Allelic binding of YY1 in differentiating cells is DNA-methylation dependent
(a) Top: map of the 5′ proximal Xist region as in Fig. 1, with CpG dinucleotides indicated by orange vertical bars. Bottom: enlargement of the region encompassing the YY1 binding sites (b) Bisulfite sequencing of input and DNA immunoprecipitated using the histone H3 and YY1 antibody in primary mouse embryonic fibroblasts (MEF). Open circles and black circles represent unmethylated and methylated CpG, respectively. P-values are calculated using Fisher test comparing IP and input data. (c) MeDIP analysis of DNA methylation across the Xist promoter region in Ma1L and Ma2L mESC (black line), and in untreated (dotted line) and 5-aza-2′-deoxycytidine treated (5-Aza, red line) differentiating cells. Primers amplifying regions devoid of CpG dinucleotides were used for calculating the background enrichment levels. Values are represented as fold enrichment relative to background. Three independent MeDIP experiments were performed. (d) ChIP analysis of YY1 binding in Ma1L and Ma2L mESC, and in untreated and 5-Aza treated differentiating cells. Statistical evaluation of differences between untreated and 5-aza treated differentiated cells is provided for the position displaying the highest enrichment; *** p<0.001; ** p< 0.01; * p<0.05 (Student’s t-test). Error bars represent SD, n=5.
Figure 3
Figure 3. YY1 is required for the maintenance of Xist expression in MEFs
(a) Analysis of YY1 RNA and protein levels by qRT-PCR and Western in female MEFs 72h after transfection with YY1 or scramble (Scr) siRNAs. RNA expression levels are normalized to Rplp0 and VINCULIN is used as a loading control for protein analysis. Full Western blots are presented in Supplementary Fig. 9. (b, c) ChIP analysis of YY1 and CTCF binding in si-Scr and si-YY1 KD cells. (d) Xist expression levels as determined by qRT-PCR using primers located in contiguous exons in si-Scr and si-YY1 KD cells. (e) Representative Xist RNA-FISH images using the p510 probe in si-Scr and si-YY1 KD cells 72h after transfection. Scale bars represent 5 μm. The proportion of nuclei with or without Xist cloud is indicated (n>100). (f) Strand specific qRT-PCR detecting intronic, premature Xist RNA levels in YY1 KD and control MEFs. Xist specific RT primers are located in intron1 (Table S1). Expression levels were normalized to Rplp0 transcript levels using gene specific priming. (g) YY1 qRT-PCR and Western blot analysis in human IMR-90 cells 72h after transfection with YY1 or Scr siRNAs. (h, i) Quantification of spliced and premature XIST transcripts in the corresponding KD cells by qRT-PCR and strand-specific RT-PCR respectively. *** p<0.001; ** p< 0.01; * p<0.05 (Student’s t-test). Error bars represent SD, n=3.
Figure 4
Figure 4. YY1 is required for proper Xist up-regulation at the onset of XCI
(a) Timeline indicating the YY1 KD strategy during differentiation (diff) of LF2 female mESC. Three rounds of siRNA transfection were performed: one 2 days prior to the induction of differentiation (d-2), one concomitantly with the launching of differentiation (d0) and the last at day 3 (d3) of differentiation. (b) qRT-PCR and (c) Western blot analysis of YY1 levels at different time points of differentiation. Expression levels are reported relative to si-Scr condition for each time point. Full Western blots are presented in Supplementary Fig. 9. (d) Klf4 and (e) Xist expression levels as determined by qRT-PCR. (f) Premature Xist expression levels determined by strand-specific qRT-PCR. (g) Xist RNA-FISH on d2 or d4 of differentiation of YY1 KD and control cells. Scale bars represent 5 μm. (h-i) Quantification of nuclei (n>150) with a Xist cloud at d2 (h) and d4 (i) of differentiation. *** p<0.001; ** p< 0.01; * p<0.05 (Student’s t-test). Error bars represent SD, n=3.
Figure 5
Figure 5. REX1 competes with YY1 for binding to the Xist 5′ region
(a) REX1 and YY1 DNA binding consensus matrices. (b) Western blot analysis of YY1 and REX1 protein levels in F1 2-1 (WT) and Rnf12−/− mESC. β-actin was used as loading control. Full Western blots are presented in Supplementary Fig. 9. (c-d) ChIP analysis of REX1 and YY1 binding in F1 2-1 WT and Rnf12−/− ES cells. ChIP was performed on at least three independent chromatin extracts for each cell type. (e) Western blot analysis of YY1 and REX1 protein levels in F1 2-1 mESC transfected either with an empty pCMV-Myc (WT) or a Rex1 pCMV-Myc (Rex1-overexpressing) vector. β-actin was used as loading control. (f-g) ChIP analysis of REX1 and YY1 binding in control and Rex1-overexpressing mES cells. ChIP was performed on at least three independent chromatin extracts for each cell type. *** p<0.001; ** p< 0.01; * p<0.05 (Student’s t-test). Error bars represent SD.
Figure 6
Figure 6. YY1 acts on Xist promoter to control Xist activation
(a-b) Luciferase reporter assay in female mESC transiently transfected with WT, mutants and reverse human XIST (a) and mouse Xist (b) promoter luciferase constructs (white bars) compared to promoterless control (gray bar). White diamonds represent YY1 sites. “Δ” indicate punctate deletion (10 bp) and “X” point mutations of individual YY1 binding sites. Firefly Luciferase activity is reported after normalization to Renilla activity, considered as internal control for transfection variability. (c) Luciferase reporter assay on pooled clones of female mESC stably transfected with the WT luciferase construct, the construct with deletion of YY1 sites or the control promoterless vector. Normalization is performed to total protein levels. (d) Schematic view of the Xist 5′ region with the position of the region targeted by the two CRISPR RNAs indicated by vertical arrows. The YY1 and CTCF binding sites are represented as diamonds and circles, respectively, and the Xist TSS is indicated by a horizontal arrow. (e) Schematic view of the Xist 5′ region in the four clones analyzed (C1-C4), with the deletion indicated. (f) qRT-PCR analysis of Xist expression in CRIPR/Cas9 targeted clones in ES cells (d0) and at day 2 (d2) and day 4 (d4) of a representative differentiation. Statistical evaluation of the difference between C1, considered here as WT, and clones C2-C4 carrying mutations of YY1 binding sites is provided for each day of differentiation. *** p<0.001; ** p< 0.01; * p<0.05 (Student’s t-test) (g) Representative Xist RNA-FISH images of CRIPR/Cas9 targeted clones at d4 of differentiation. Scale bars represent 5 μm. (h) Quantification of nuclei (n>150) with Xist RNA cloud, pinpoints or with no signal (empty) at d4 of differentiation. (i) Premature Xist expression levels determined by strand-specific qRT-PCR at day 4 of differentiation. (j) Premature Tsix expression levels determined by strand-specific qRT-PCR at day 4 of differentiation.
Figure 7
Figure 7. A model recapitulating the regulation of Xist by YY1
In WT mouse ES cells, YY1 (green diamonds) binds to lowly methylated Xist allele, but this binding can be competed for by the Xist repressor REX1 (purple circles). Competition is exacerbated in Rex1 overexpressing and in Rnf12−/− mESC, in which REX1 protein accumulates, thus leading to displacement of YY1 from Xist. During differentiation of WT ES cells, the Xist CpG island becomes asymmetrically methylated, controlling monoallelic maintenance of YY1 binding on the Xi elect. Increase in RNF12 (blue hexagons) levels enhances the degradation of REX1, reinforcing the stable binding of YY1 to the Xi, which is required for Xist up-regulation.

References

    1. Lyon MF. Gene action in the X-chromosome of the mouse (Mus musculus L.) Nature. 1961;190:372–3. - PubMed
    1. Brockdorff N, et al. Conservation of position and exclusive expression of mouse Xist from the inactive X chromosome. Nature. 1991;351:329–31. - PubMed
    1. Brown CJ, et al. A gene from the region of the human X inactivation centre is expressed exclusively from the inactive X chromosome. Nature. 1991;349:38–44. - PubMed
    1. Borsani G, et al. Characterization of a murine gene expressed from the inactive X chromosome. Nature. 1991;351:325–9. - PubMed
    1. Augui S, Nora EP, Heard E. Regulation of X-chromosome inactivation by the X-inactivation centre. Nat Rev Genet. 2011;12:429–42. - PubMed

Publication types