. 2014 Nov 6;515(7525):80-84.
doi: 10.1038/nature13686. Epub 2014 Sep 7.

Architecture of mammalian respiratory complex I

Affiliations

Architecture of mammalian respiratory complex I

Kutti R Vinothkumar et al. Nature. .

Abstract

Complex I (NADH:ubiquinone oxidoreductase) is essential for oxidative phosphorylation in mammalian mitochondria. It couples electron transfer from NADH to ubiquinone with proton translocation across the energy-transducing inner membrane, providing electrons for respiration and driving ATP synthesis. Mammalian complex I contains 44 different nuclear- and mitochondrial-encoded subunits, with a combined mass of 1 MDa. The 14 conserved 'core' subunits have been structurally defined in the minimal, bacterial complex, but the structures and arrangement of the 30 'supernumerary' subunits are unknown. Here we describe a 5 Å resolution structure of complex I from Bos taurus heart mitochondria, a close relative of the human enzyme, determined by single-particle electron cryo-microscopy. We present the structures of the mammalian core subunits that contain eight iron-sulphur clusters and 60 transmembrane helices, identify 18 supernumerary transmembrane helices, and assign and model 14 supernumerary subunits. Thus, we considerably advance knowledge of the structure of mammalian complex I and the architecture of its supernumerary ensemble around the core domains. Our structure provides insights into the roles of the supernumerary subunits in regulation, assembly and homeostasis, and a basis for understanding the effects of mutations that cause a diverse range of human diseases.


Figures
Extended Data Fig. 1
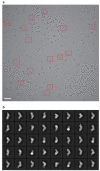
Extended Data Fig. 1. Single particle electron cryo-microscopy analysis of B. taurus complex I
a) Typical micrograph of complex I particles imaged after freezing in vitreous ice on a holey-carbon grid. Some of the selected particles are marked with red boxes. The scale bar represents 50 nm. b) 2D reference classification showing particles lying in different orientations in the ice. The size of each box is 280 pixels and the 2D classification was made in RELION.
Extended Data Fig. 2
Extended Data Fig. 2. Validation of the map and resolution
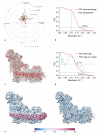
a) Tilt-pair analysis of complex I in cymal-7. 100 complex I particles from eight image pairs, recorded with a relative tilt angle of 10°, were extracted and subjected to tilt-pair analysis with FREALIGN. The outer radius of the plot is 40° and the orange circle centered at the expected tilt angle has a radius of 6°. b) Phase randomisation to check for overfitting. Phases that are beyond 10 Å in each of the micrographs used in the final data set (frames 1-32) were randomised, and then refinement was performed as for a normal data set (FSC summed image corresponding to frames 1-32). As expected, the graph shows a drop in the Fourier shell correlation (FSC) curve at 10 Å, validating the presence of information beyond 10 Å in the images. Note that the use of gold-standard refinement procedures in RELION prevents any overfitting, and this test was done only as an additional control. c) An overview of the final map and the model built into it. d) FSC curves of the final map and of the model versus the map. The curve in red is the gold-standard FSC of the final map (after classification) and the resolution at FSC = 0.143 is ~4.95 Å. The curve in cyan is the FSC between the final map and the model, and at FSC = 0.5 the resolution is 6.7 Å. Note that the present model is not complete since it is only a polyalanine model without any side chains, and loop regions in a number of subunits have not been modelled. e) The final map of mammalian complex I was analysed with ResMap. The left-hand panel (with lower density threshold) shows that the detergent/phospholipid belt is of lower resolution, and the protein regions of the map show resolution distributed from 5 to 6 Å. In the right-hand panel the map is shown at higher density threshold, so the detergent/phospholipid belt is not visualised. Some of the interior parts of the map have resolution of 4.8-5 Å.
Extended Data Fig. 3
Extended Data Fig. 3. Example regions of the density map with the model fitted to the map
a) ND2 is shown from the membrane plane, high-lighting the densities for three aromatic sidechains and one of the helix-breaking loops. b) Subunit ND4 is viewed from the matrix. c) The density for a [4Fe-4S] cluster and surrounding protein is shown in the PSST subunit. d) A region of the 49 kDa subunit shows a well resolved α-helical stretch and aromatic side-chains, and the β-strands are beginning to be resolved. e) Subunit B8 is an example of a supernumerary subunit in a peripheral region of the molecule. f) In the 39 kDa subunit density consistent with a bound nucleotide is observed, in a similar position to in homologous structures, and as expected from analysis of Y. lipolytica complex I. However, the present resolution of the map precludes the inclusion of this nucleotide in the final model.
Extended Data Fig. 4
Extended Data Fig. 4. Global comparison of the core subunit structures of bacterial and mammalian complex I
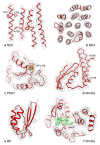
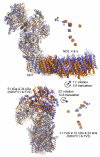
The core subunits from B. taurus are in blue, and from T. thermophilus (4HEA.pdb) in orange. The structures have been superimposed using ND1 (the ‘heel’ subunit). Top: the ND2, ND4 and ND5 domain is rotated in B. taurus relative to in T. thermophilus, increasing the curvature in the B. taurus membrane domain. The complex is viewed along the 11° rotation vector (orange) that maps the T. thermophilus ND2, ND4 and ND5 domain to the B. taurus domain, along with a small 5 Å translation to superimpose the domain centres. Correspondingly, the ND3, ND4L and ND6 domains are superimposed by a 4° rotation and a 1 Å translation. Rotation of ND2, 4 and 5 about the long axis of the domain, as noted for Y. lipolytica, is not observed. Bottom: the NADH dehydrogenase domain containing the 51 and 24 kDa subunits is rotated by 23° and translated by 14 Å in B. taurus, relative to in T. thermophilus, causing the FeS chains to diverge as the distance from ND1 increases. A similar rotation was observed in Y. lipolytica. The complex is viewed from behind ND1. Correspondingly, the 49 kDa, PSST and TYKY subunits are superimposed by a 6° rotation and a 2 Å translation. The structures were analysed using Superpose from the CCP4 suite and the 75 kDa and 30 kDa subunits were not included due to their lower structural conservation.
Extended Data Fig. 5
Extended Data Fig. 5. Comparison of the individual structures of the core subunits of bacterial and mammalian complex I
a) The structure of each subunit from T. thermophilus (wheat, 4HEA.pdb) has been superimposed separately on its corresponding subunit from B. taurus (coloured as labelled) with the transverse helix plus TMH16 of ND5 also aligned separately. The complexes are viewed from behind ND1 (top), from the side (middle) and from the matrix (bottom, ND subunits only). b) Observed differences in the structures of the core subunits of B. taurus and T. thermophilus complexes I. Grey, conserved structure from B. taurus and T. thermophilus (4HEA.pdb); red, structural elements present only in T. thermophilus; blue, structural elements present only in B. taurus. The C-terminal domain of the 75 kDa subunit is not resolved in B. taurus, but its structure is clearly different to in T. thermophilus.
Fig. 1
Fig. 1. Overall map for complex I from B. taurus heart mitochondria determined by single particle electron cryo-microscopy
Three distinct features of the complex are revealed by overlaying maps at different density thresholds. The map at the highest threshold (red) reveals the FeS clusters. The map at medium threshold (grey) reveals the overall architecture of the protein and the 78 TMHs in the membrane domain. The detergent/phospholipid belt observed as a dominant feature at low density threshold (translucent blue) represents the density that remains around the membrane domain after cutting out the final model of the protein, and denotes the position of the complex in the membrane. It is ~30 Å thick, and 3-4 Å thinner at the proximal end of the complex (left) than at the distal end (right).
Fig. 2
Fig. 2. Structures of the core subunits of mammalian complex I
a) Structural models of the fourteen mammalian core subunits (cartoon representation) and their density (transparent surface); the subunits are coloured individually and labelled with text in the same colours. The chain of FeS clusters is shown modelled to the highest density peaks (blue mesh) in the inset. b) The seven membrane-bound mammalian core subunits, viewed from the matrix. Arrows indicate the positions of the four TMHs in T. thermophilus that are not present in B. taurus: three N-terminal TMHs in ND2 and one C-terminal TMH in ND1. The position of TMH-4 in ND6 is different in B. taurus and T. thermophilus (marked with stars). For a detailed comparison of the B. taurus and T. thermophilus structures see Extended Data Figs. 4 and 5.
Fig. 3
Fig. 3. Architecture of mammalian complex I showing the densities of the supernumerary subunits enclosing the core domain
The models for the core subunits are in light colours (as labelled) in surface representation, and density attributed to the supernumerary subunits, forming a cage around the core subunits, is in dark red. The supernumerary subunits are concentrated on each side of the membrane domain, and around the lower section of the hydrophilic domain. The NADH binding site in the 51 kDa subunit is indicated, with the predicted positions for the flavin isoalloxazine (orange spheres) and three conserved phenylalanines at the entry to the site (yellow); the vicinity of this site is devoid of supernumerary subunit density.
Fig. 4
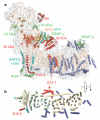
Fig. 4. Structural assignments of supernumerary subunits in mammalian complex I
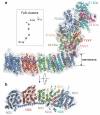
a) A semi-transparent surface for the density map for mammalian complex I is shown in pale grey, with the surface from the core subunits in wheat. Structural models for the supernumerary subunits are shown in colour and labelled accordingly (dashed lines indicate subunits on the back of the structure). Subunits labelled with brackets are those with less certain assignments, and structural elements, which cannot be assigned confidently in the current map, are in blue. b). Arrangement of TMHs, viewed from the matrix. The core subunits are in light colours (wheat for ND1, ND4 and ND5, green for ND2, ND3, ND4L, and ND6). The supernumerary subunits are coloured as in a).
Fig. 5
Fig. 5. Structural models for supernumerary subunits in mammalian complex I
a) Models for three supernumerary subunits in cartoon representation, coloured from blue to red (N- to C-termini). b). Structural models and relationships of supernumerary subunits to the core structure. B14.7 is located at the end of the transverse helix, next to ND5-TMH16. The density assigned to PGIV forms an L-shaped ‘clip’ over B16.6, which bends around the heel at ND1. Finally, the supernumerary subunits around the lower section of the hydrophilic domain are viewed in cartoon representation from the matrix. The core membrane subunits (white) and four core hydrophilic subunits, the 49 kDa (blue), 30 kDa (green), PSST (yellow) and TYKY (cyan) subunits, are shown in surface representation.

Similar articles

Cited by

References

    1. Hirst J. Mitochondrial complex I. Annu. Rev. Biochem. 2013;82:551–575. - PubMed
    1. Carroll J, Fearnley IM, Shannon RJ, Hirst J, Walker JE. Analysis of the subunit composition of complex I from bovine heart mitochondria. Mol. Cell. Proteomics. 2003;2:117–126. - PubMed
    1. Hirst J, Carroll J, Fearnley IM, Shannon RJ, Walker JE. The nuclear encoded subunits of complex I from bovine heart mitochondria. Biochim. Biophys. Acta. 2003;1604:135–150. - PubMed
    1. Baradaran R, Berrisford JM, Minhas GS, Sazanov LA. Crystal structure of the entire respiratory complex I. Nature. 2013;494:443–448. - PMC - PubMed
    1. Efremov RG, Sazanov LA. Structure of the membrane domain of respiratory complex I. Nature. 2011;476:414–420. - PubMed

ADDITIONAL METHODS REFERENCES

    1. Bellare JR, Davis HT, Scriven LE, Talmon Y. Controlled environment vitrification system: an improved sample preparation technique. J. Electron Microsc. Tech. 1988;10:87–111. - PubMed
    1. Grigorieff N. FREALIGN: high-resolution refinement of single particle structures. J. Struct. Biol. 2007;157:117–125. - PubMed
    1. Smith JM. XIMDISP – a visualization tool to aid structure determination from electron microscope images. J. Struct. Biol. 1999;125:223–228. - PubMed
    1. Tang G, et al. EMAN2: an extensible image processing suite for electron microscopy. J. Struct. Biol. 2007;157:38–46. - PubMed
    1. Henderson R, et al. Tilt-pair analysis of images from a range of different specimens in single-particle electron cryomicroscopy. J. Mol. Biol. 2011;413:1028–1046. - PMC - PubMed

ADDITIONAL EXTENDED DATA REFERENCES

    1. Efremov RG, Sazanov LA. Respiratory complex I: ‘steam engine’ of the cell? Curr. Opin. Struct. Biol. 2011;21:532–540. - PubMed
    1. Krissinel E, Henrick K. Secondary-structure matching (SSM), a new tool for fast protein structure alignment in three dimensions. Acta Cryst. 2004;D60:2256–2268. - PubMed
    1. Balsa E, et al. NDUFA4 is a subunit of complex IV of the mammalian electron transport chain. Cell Metab. 2012;16:378–386. - PubMed
    1. Johansson K, et al. Structural basis for substrate specificities of cellular deoxyribonucleoside kinases. Nat. Struct. Biol. 2001;8:616–620. - PubMed
    1. King JD, et al. Predicting protein function from structure - the roles of short-chain dehydrogenase/reductase enzymes in Bordetella O-antigen biosynthesis. J. Mol. Biol. 2007;374:749–763. - PMC - PubMed

Publication types

Substances

Associated data