. 2014 Sep 11;513(7517):195-201.
doi: 10.1038/nature13679.

Gibbon genome and the fast karyotype evolution of small apes

Lucia Carbone  1 R Alan Harris  2 Sante Gnerre  3 Krishna R Veeramah  4 Belen Lorente-Galdos  5 John Huddleston  6 Thomas J Meyer  7 Javier Herrero  8 Christian Roos  9 Bronwen Aken  10 Fabio Anaclerio  11 Nicoletta Archidiacono  11 Carl Baker  12 Daniel Barrell  10 Mark A Batzer  13 Kathryn Beal  14 Antoine Blancher  15 Craig L Bohrson  16 Markus Brameier  9 Michael S Campbell  17 Oronzo Capozzi  11 Claudio Casola  18 Giorgia Chiatante  11 Andrew Cree  19 Annette Damert  20 Pieter J de Jong  21 Laura Dumas  22 Marcos Fernandez-Callejo  5 Paul Flicek  14 Nina V Fuchs  23 Ivo Gut  24 Marta Gut  24 Matthew W Hahn  25 Jessica Hernandez-Rodriguez  5 LaDeana W Hillier  26 Robert Hubley  27 Bianca Ianc  20 Zsuzsanna Izsvák  23 Nina G Jablonski  28 Laurel M Johnstone  29 Anis Karimpour-Fard  22 Miriam K Konkel  13 Dennis Kostka  30 Nathan H Lazar  31 Sandra L Lee  19 Lora R Lewis  19 Yue Liu  19 Devin P Locke  32 Swapan Mallick  33 Fernando L Mendez  34 Matthieu Muffato  14 Lynne V Nazareth  19 Kimberly A Nevonen  35 Majesta O'Bleness  22 Cornelia Ochis  20 Duncan T Odom  36 Katherine S Pollard  37 Javier Quilez  5 David Reich  33 Mariano Rocchi  11 Gerald G Schumann  38 Stephen Searle  39 James M Sikela  22 Gabriella Skollar  40 Arian Smit  26 Kemal Sonmez  41 Boudewijn ten Hallers  42 Elizabeth Terhune  35 Gregg W C Thomas  25 Brygg Ullmer  43 Mario Ventura  11 Jerilyn A Walker  13 Jeffrey D Wall  44 Lutz Walter  9 Michelle C Ward  45 Sarah J Wheelan  16 Christopher W Whelan  46 Simon White  39 Larry J Wilhelm  35 August E Woerner  29 Mark Yandell  17 Baoli Zhu  42 Michael F Hammer  29 Tomas Marques-Bonet  47 Evan E Eichler  6 Lucinda Fulton  26 Catrina Fronick  26 Donna M Muzny  19 Wesley C Warren  26 Kim C Worley  19 Jeffrey Rogers  19 Richard K Wilson  26 Richard A Gibbs  19
Affiliations

Gibbon genome and the fast karyotype evolution of small apes

Lucia Carbone et al. Nature. .

Abstract

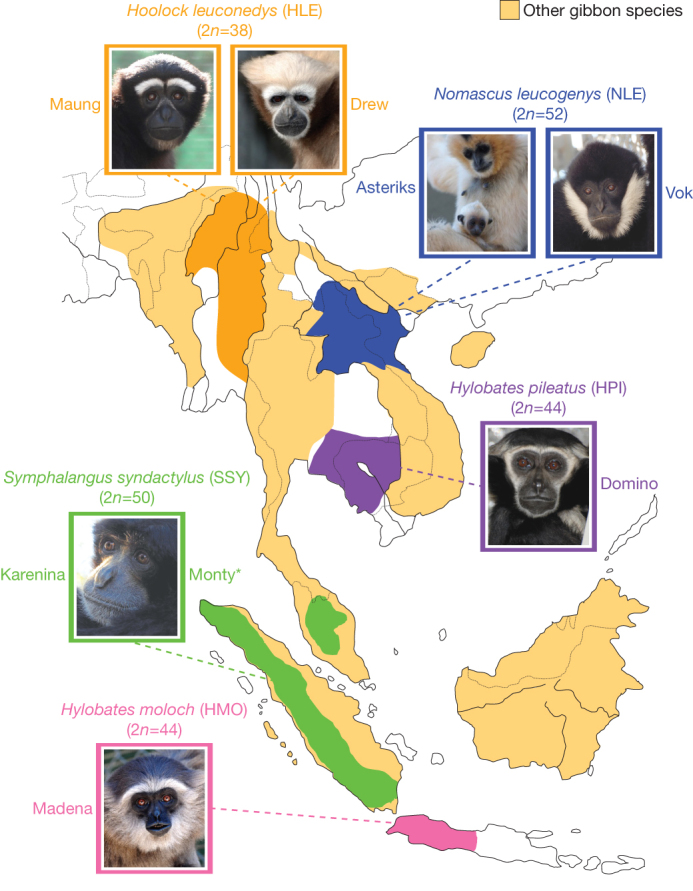
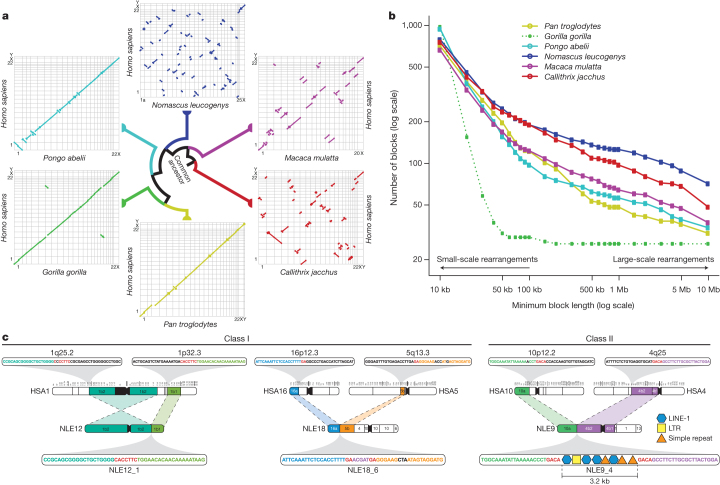
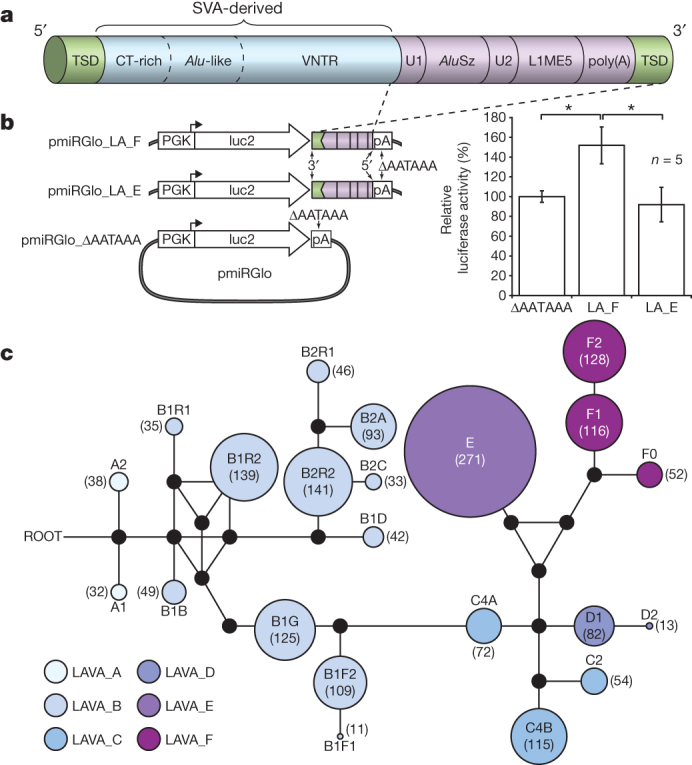
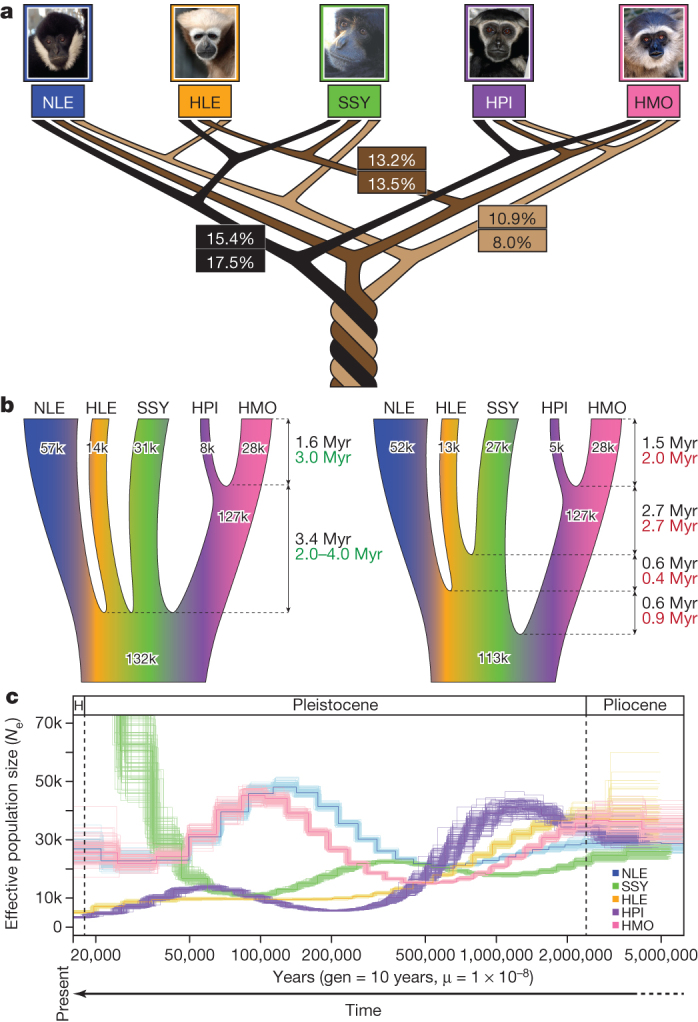
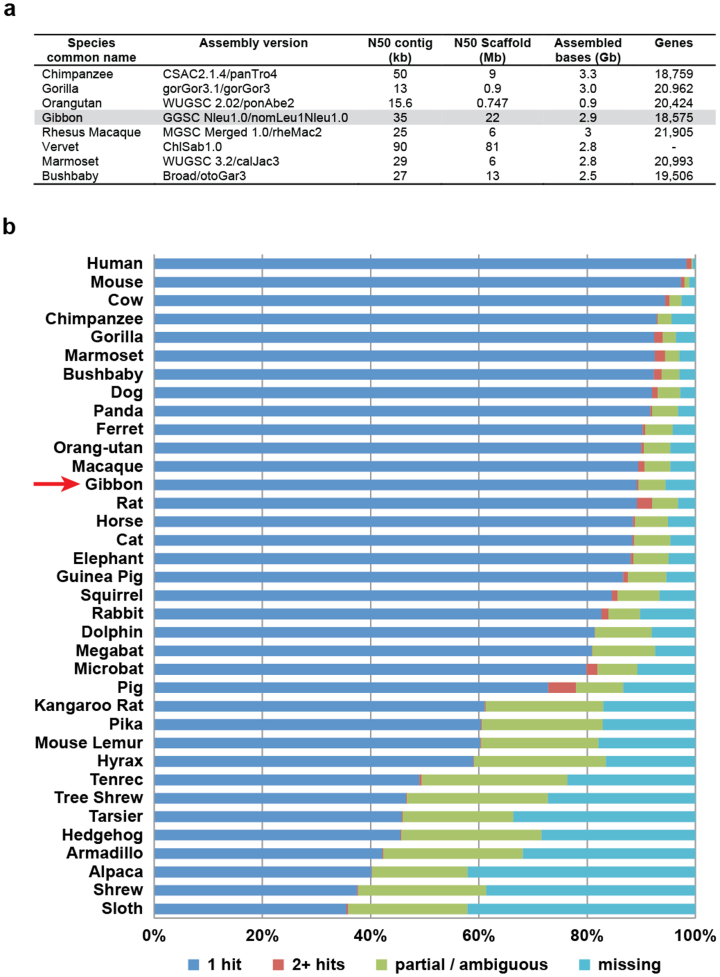
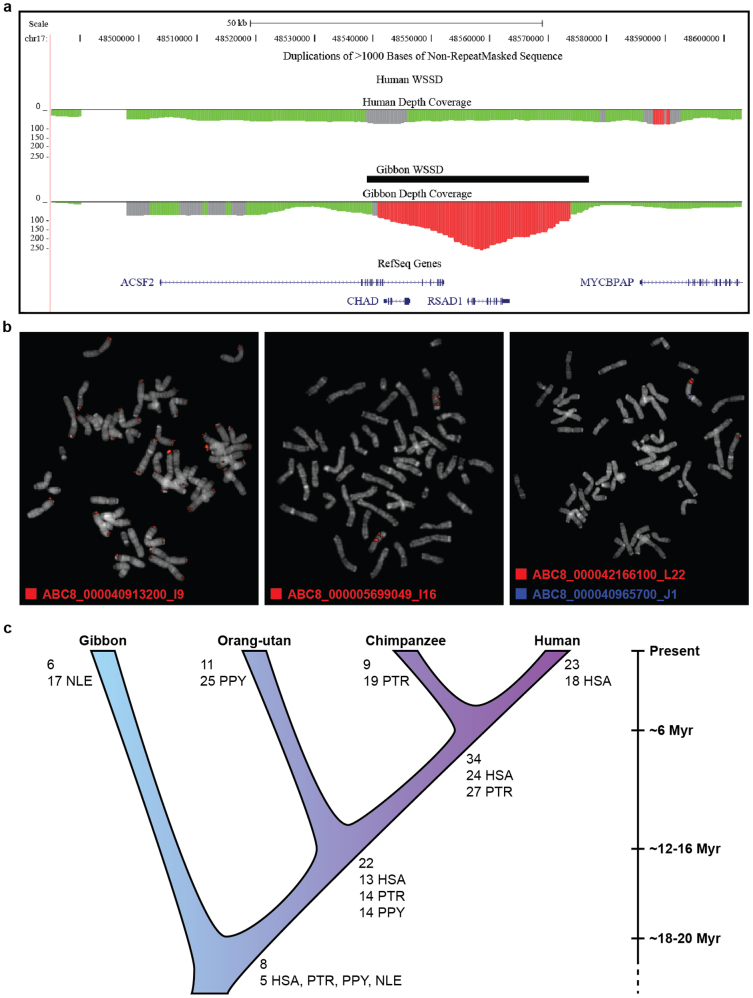
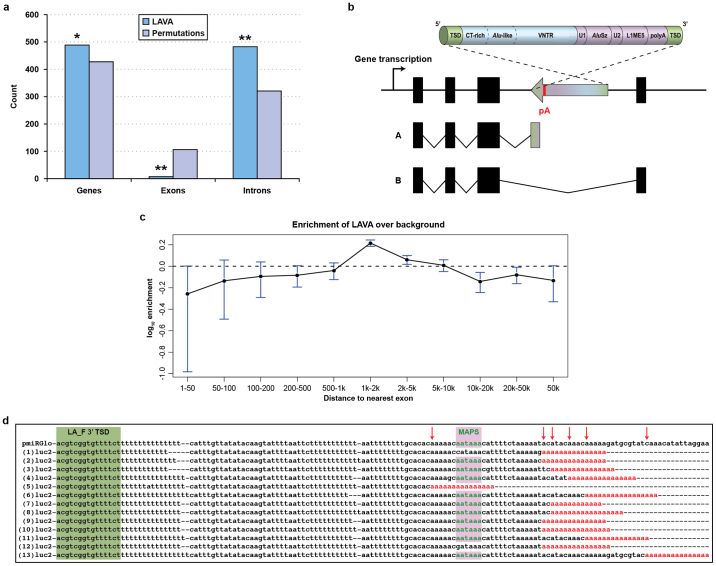
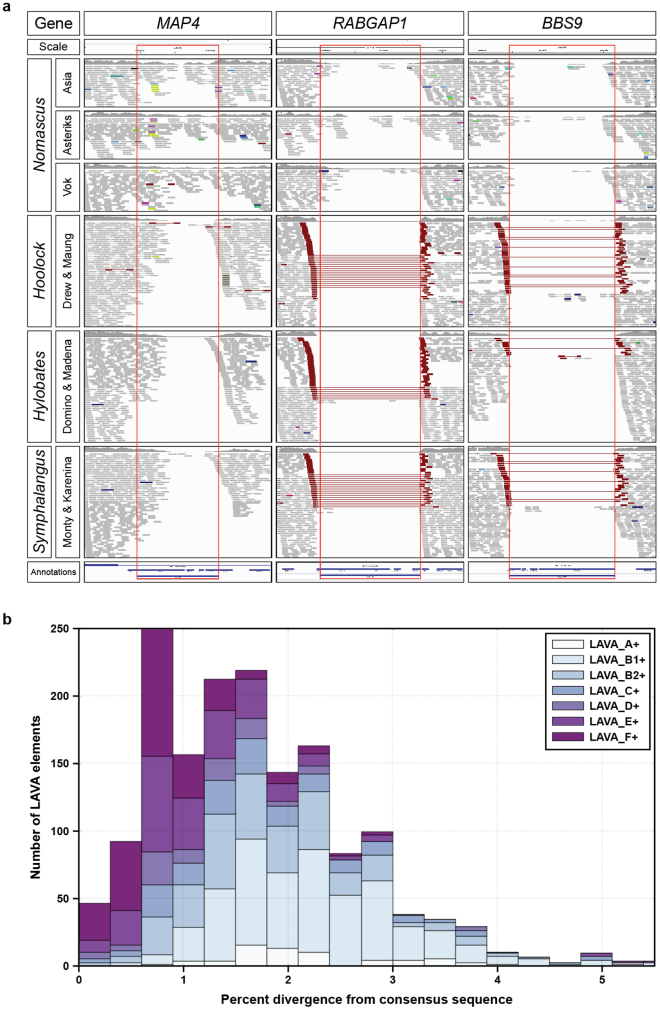
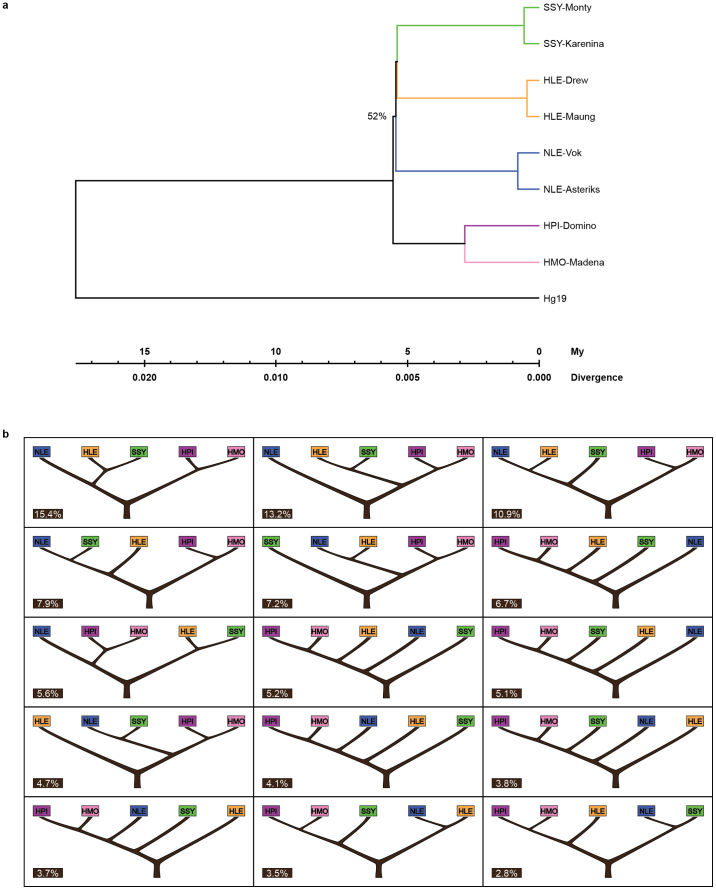
Gibbons are small arboreal apes that display an accelerated rate of evolutionary chromosomal rearrangement and occupy a key node in the primate phylogeny between Old World monkeys and great apes. Here we present the assembly and analysis of a northern white-cheeked gibbon (Nomascus leucogenys) genome. We describe the propensity for a gibbon-specific retrotransposon (LAVA) to insert into chromosome segregation genes and alter transcription by providing a premature termination site, suggesting a possible molecular mechanism for the genome plasticity of the gibbon lineage. We further show that the gibbon genera (Nomascus, Hylobates, Hoolock and Symphalangus) experienced a near-instantaneous radiation ∼5 million years ago, coincident with major geographical changes in southeast Asia that caused cycles of habitat compression and expansion. Finally, we identify signatures of positive selection in genes important for forelimb development (TBX5) and connective tissues (COL1A1) that may have been involved in the adaptation of gibbons to their arboreal habitat.


Conflict of interest statement

E.E.E. is on the scientific advisory board (SAB) of DNAnexus and was an SAB member of Pacific Biosciences (2009–2013) and SynapDx (2011–2013).

Figures

Figure 1
Figure 1. Geographic distribution of gibbon species used in the study.
We sequenced two individuals from each gibbon genus and two different species (H. moloch and H. pileatus) for the genus Hylobates. The extant geographic localization for each genus is illustrated on the map. Individuals in the photos are the ones sequenced in this study. The asterisk symbol indicates a deceased animal. PowerPoint slide
Figure 2
Figure 2. Analysis of gibbon–human synteny and breakpoints.
a, Oxford plots for human chromosomes (y axis) vs. chimpanzee, gorilla, orangutan, gibbon, rhesus macaque and marmoset chromosomes (x axis). Each line represents a collinear block larger than 10 Mb. The gibbon genome displays a significantly larger number of large-scale rearrangements than all the other species. In the gorilla plot, chromosomes 4 and 19 stand out as the product of a reciprocal translocation between chromosomes syntenic to human chromosomes 5 and 17. b, The graph shows the number of collinear blocks in primate genomes with respect to the human genome. The number of collinear blocks is a proxy for the number of rearrangements and decreases as the size of the blocks becomes larger. The gibbon genome has undergone a greater number of large-scale rearrangements; however, the number of small-scale rearrangements is comparable with the other species. The extremely low number of large rearrangements in the gorilla genome (dotted green line) is a reflection of the use of the human genome as a template in the assembly process. c, Examples of gibbon–human synteny breakpoints. The first two are class I breakpoints (that is, base-pair resolution) originated through non-homology based mechanisms. NLE12_1 is the result of an inversion in human chromosome 1 and NLE18_6 is the result of a translocation between human chromosomes 16 and 5 with an untemplated insertion in the gibbon sequence shown in purple; in both cases, micro-homologies in the human sequences are shown in red. The last example (NLE9_4) is a class II breakpoint (3.2 kb) containing a mixture of repetitive sequences. PowerPoint slide
Figure 3
Figure 3. The LAVA element and evidence for LAVA-mediated early transcription termination.
a, Schematic view of the LAVA element highlights the main components that originated from common repeats (L1, Alu, VNTR and Alu-like). Target-site duplications (TSDs) and the poly(A) tail are also indicated. b, Luciferase reporter constructs used to assay for LAVA-mediated early transcriptional termination (left panel) and results of the luciferase reporter assay (right panel) showing increased luciferase activity by ∼50% relative to the background for pmiRGlo_LA_F (*P = 0.0013) (see Supplementary Information section S7.8) n = 5, five biological replicates, from five independent transfections done for each experimental condition tested. The experiment shown was replicated twice in the laboratory. Statistics were carried out using a Student’s t-test (two sided), P values for all pairwise comparisons LA_F vs. LA_E, ΔPA vs. LA_F, and ΔPA vs. LA_E respectively (with 95% CI) were adjusted for multiple comparisons according to the Bonferroni method. Centre values show the average, error bars indicate standard deviation. c, A median-joining network showing the relationships among the 22 LAVA subfamilies generated by comparing the 3′ intact LAVA elements. Coloured circles represent subfamilies and their size is proportional to the number of elements in the subfamily (numbers inside each circle). Black dots represent hypothetical sequences connecting adjacent subfamilies. All possible relationships are shown. Branch lengths are not drawn to scale. PowerPoint slide
Figure 4
Figure 4. Gibbon phylogeny and demography.
a, The three most frequently observed UPGMA gene trees (numbers at the top) constructed across the genome at 100-kb sliding windows and posterior probabilities (numbers at the bottom) for the same species topologies from a coalescent-based ABC analysis. The relatively low numbers observed suggest presence of substantial ILS amongst the gibbon genera. b, Parameters estimates describing gibbon population demography assuming an instant radiation for all four genera (left) and the most probable bifurcating species topology (right). Black, green and red numbers indicate divergence times and Ne as calculated by ABC, BEAST and G-PhoCS analysis, respectively (Supplementary Information section S9). c, PSMC analysis estimating changes in historical Ne. The large increase in Ne observed in our PSMC plot for SSY in recent times is probably exaggerated due to higher sequencing error and mapping biases in non-NLE samples (see details in Supplementary section S8). A generation time of 10 years, was used to obtain a per generation mutation rate of 1 × 10−8 per year. PowerPoint slide
Extended Data Figure 1
Extended Data Figure 1. The gibbon assembly statistics and quality control.
a, The table compares the gibbon assembly statistics to those of other primates sequenced with a similar strategy. b, The plot represents the percentage of the 10,734 single-copy gene HMMs (hidden Markov models) for which just one gene (blue) is found in the different mammalian genomes in Ensembl 70. Other HMMs match more than one gene (red). The missing HMMs (cyan) either do not match any protein or the score is within the range of what can be expected for unrelated proteins. The remaining category (green) represents HMMs for which the best matching gene scores better than unrelated proteins but not as well as expected. See Supplementary Information section 1.4 for more details.
Extended Data Figure 2
Extended Data Figure 2. Analysis of gibbon–human synteny blocks and identification and validation of gibbon segmental duplications.
a, The image shows a representative gibbon-only whole-genome shotgun sequence detection (WSSD) call by Sanger read depth. The duplication identified in this case overlaps with the gene CHAD that codes for a cartilage matrix protein. b, Examples of fluorescence in situ hybridizations on gibbon metaphases using duplicated human fosmid clones that were identified by the (WGS) detection strategy (red signals). Left, interchromosomal duplication. Middle, interspersed intrachromosomal duplication. Right, intrachromosomal tandem duplication confirmed using co-hybridization with a single control probe (blue signals). c, Megabases of lineage-specific and shared duplications for primates based on GRChr37 read depth analysis. Copy-number corrected values by species are shown below.
Extended Data Figure 3
Extended Data Figure 3. Analysis of LAVA element insertion in genes and early termination of transcription.
a, The histogram shows the results of permutation analyses. We find a significant association between LAVA elements and genes. Moreover, insertions are significantly enriched in introns and depleted in exons, most probably as a result of selection against insertions in exons. b, Schematic representation of the mechanism through which LAVA intronic insertions in antisense orientation might cause early termination of transcription. The truncated transcript is indicated on the diagram as A and normal transcript indicated on the diagram as B (pA = polyadenylation site). c, We calculated the distance to the nearest exon for each intronic LAVA and compared this to what would be expected for random insertions (that is, background). We found fewer insertions than expected by chance within 1 kb of the nearest exon. d, Identification of pmiRGlo_LA_F polyadenylation sites by 3′ RACE. Alignment of thirteen 3′ RACE PCR clone sequences and the pmiRGlo_LA_F sequence. LAVA_F 3′ TSD is highlighted by dark green background; the major antisense LAVA_F polyadenylation signal (MAPS) is highlighted by red background. The termination sites are marked with arrows on the LAVA_F sequence. Poly(A) tails of the identified transcripts are in red text.
Extended Data Figure 4
Extended Data Figure 4. Evolution of the LAVA element.
a, Screenshots from the Integrative Genomics Viewer (IGV) browser for loci MAP4, RABGAP1 and BBS9. Each column shows portions of the IGV visualization of a LAVA insertion locus identified in Nleu1.0 and its flanking sequence. Red rectangles indicate the margins of each LAVA insertion. Read pairs are coloured red when their insert size is larger than expected, indicating the presence of an unshared LAVA insertion. MAP4 is a shared LAVA insertion, whereas RABGAP1 and BBS9 are Nomascus specific. b, LAVA elements containing at least 300 bp of the LA section of LAVA were selected and reanalysed using RepeatMasker to determine subfamily affiliation and divergence from the consensus sequence. LAVA elements are grouped based upon their subfamily affiliations (see legend top right for colour scheme). The x axis shows the per cent divergence from the respective consensus sequence and the y axis shows the number of elements with a certain per cent divergence from the consensus sequence.
Extended Data Figure 5
Extended Data Figure 5. Analysis of the phylogenetic relationships between gibbon genera.
a, Neighbour-joining trees for gibbons using non-genic loci. b, UPGMA trees for 100 kb non-overlapping sliding windows moving along the gibbon genome reporting the top 15 topologies (see also Supplementary Table ST8.3). The percentage of total support for each topology is given within each subpanel.
Extended Data Figure 6
Extended Data Figure 6. Analysis of the relationship between gibbon accelerated regions (gibARs) and genes.
a, Intergenic regions are enriched in gibARs. Different sequence types are shown on the x axis and the y axis displays the fraction of gibARs and candidate regions annotated to the respective class. gibARs are significantly enriched in intergenic regions (P = 4.7 × 10−6) and significantly depleted in exons (P = 7.3 × 10−6). P values for each class were calculated with the Fisher’s exact test. Introns are comparably prevalent in candidates and gibARs, whereas in the UTR and flanking region, counts are too low to draw meaningful conclusions (data not shown). b, TreeMap from REVIGO for GOslim Biological Process terms with a Benjamini–Hochberg false discovery rate of 5%. Each rectangle is a cluster representative; larger rectangles represent ‘superclusters’ including loosely related terms. The size of the rectangles reflects the P value.

Comment in

  • Genomics: Something to swing about.
    O'Neill MJ, O'Neill RJ. O'Neill MJ, et al. Nature. 2014 Sep 11;513(7517):174-5. doi: 10.1038/513174a. Nature. 2014. PMID: 25209792 No abstract available.

References

    1. Mittermeier, R. A., Rylands, A. B. & Wilson, D. E. Handbook of the Mammals of the World Vol. 3 (Lynx Edicions,. (2013)
    1. Carbone L, et al. A high-resolution map of synteny disruptions in gibbon and human genomes. PLoS Genet. 2006;2:e223. - PMC - PubMed
    1. Locke DP, et al. Comparative and demographic analysis of orang-utan genomes. Nature. 2011;469:529–533. - PMC - PubMed
    1. Gibbs RA, et al. Evolutionary and biomedical insights from the rhesus macaque genome. Science. 2007;316:222–234. - PubMed
    1. Girirajan S, et al. Sequencing human–gibbon breakpoints of synteny reveals mosaic new insertions at rearrangement sites. Genome Res. 2009;19:178–190. - PMC - PubMed

Publication types

Associated data

LinkOut - more resources