. 2014 Nov;166(3):1479-91.
doi: 10.1104/pp.114.248112. Epub 2014 Sep 10.

Identification of phosphatin, a drug alleviating phosphate starvation responses in Arabidopsis

Affiliations

Identification of phosphatin, a drug alleviating phosphate starvation responses in Arabidopsis

Carole Arnaud et al. Plant Physiol. 2014 Nov.

Abstract

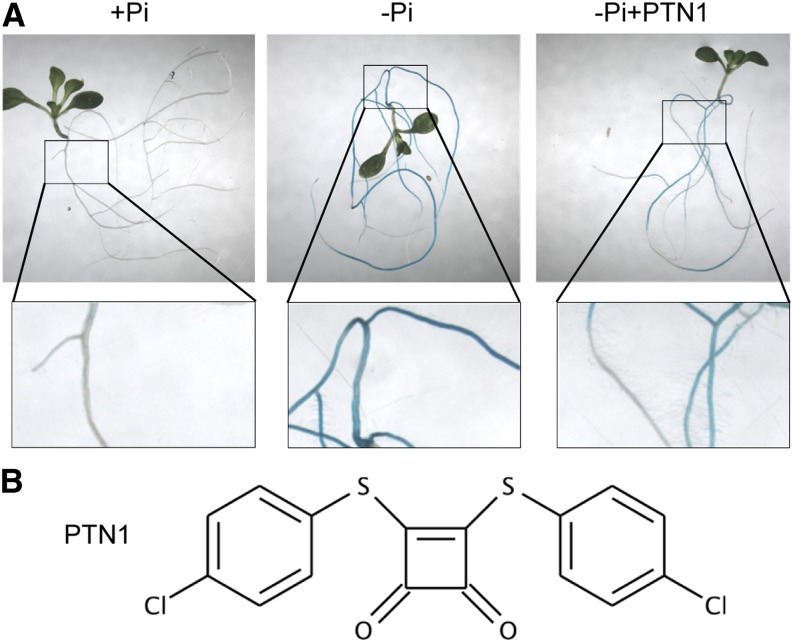
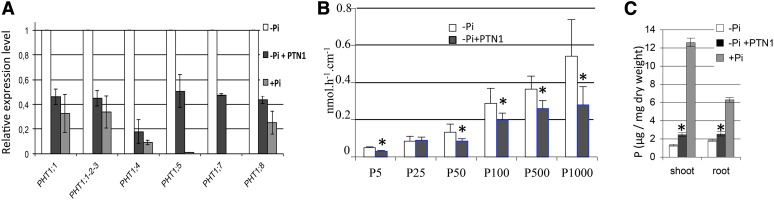
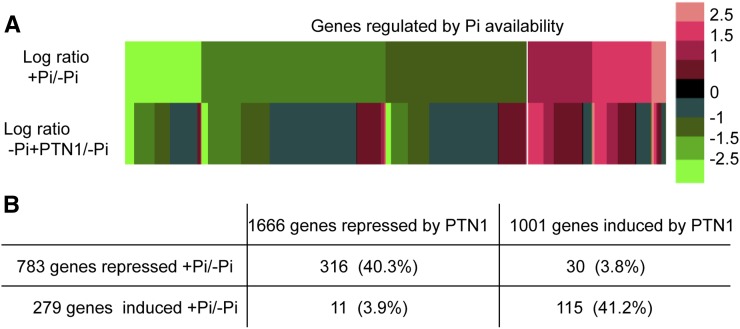
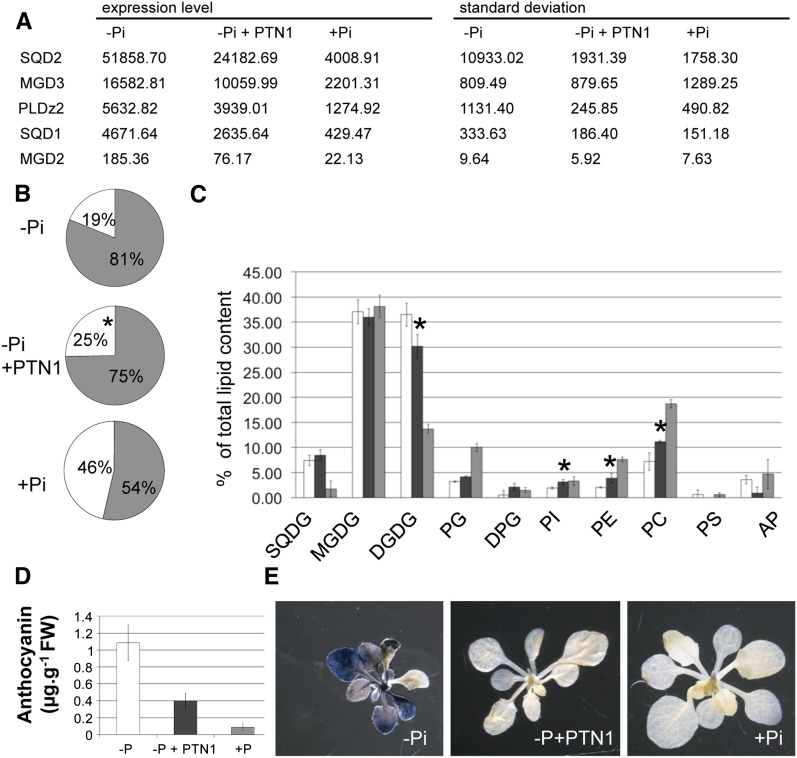
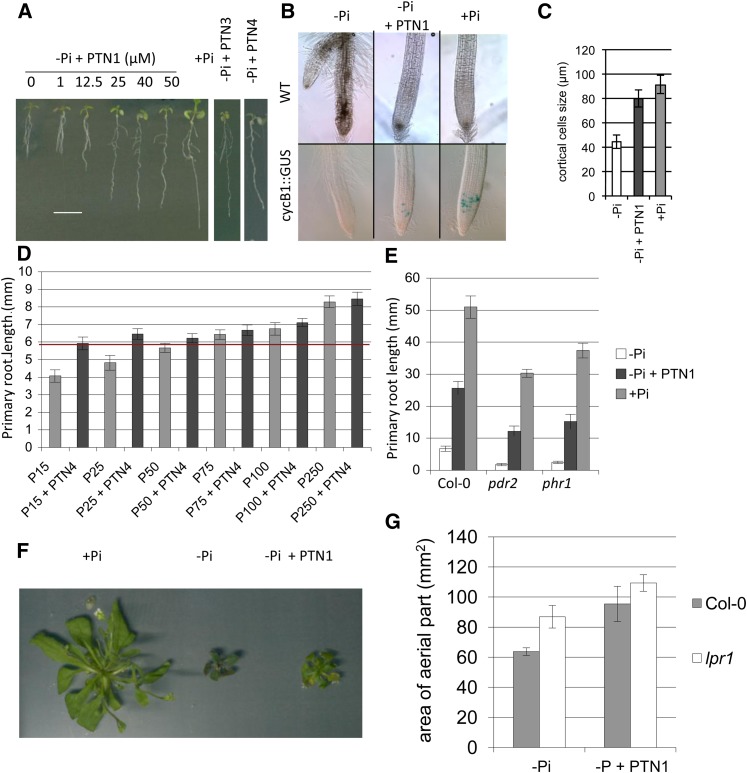
Inorganic phosphate (Pi) is present in most soils at suboptimal concentrations, strongly limiting plant development. Plants have the ability to sense and adapt to the surrounding ionic environment, and several genes involved in the response to Pi starvation have been identified. However, a global understanding of the regulatory mechanisms involved in this process is still elusive. Here, we have initiated a chemical genetics approach and isolated compounds that inhibit the response to Pi starvation in Arabidopsis (Arabidopsis thaliana). Molecules were screened for their ability to inhibit the expression of a Pi starvation marker gene (the high-affinity Pi transporter PHT1;4). A drug family named Phosphatin (PTN; Pi starvation inhibitor), whose members act as partial suppressors of Pi starvation responses, was thus identified. PTN addition also reduced various traits of Pi starvation, such as phospholipid/glycolipid conversion, and the accumulation of starch and anthocyanins. A transcriptomic assay revealed a broad impact of PTN on the expression of many genes regulated by low Pi availability. Despite the reduced amount of Pi transporters and resulting reduced Pi uptake capacity, no reduction of Pi content was observed. In addition, PTN improved plant growth; this reveals that the developmental restrictions induced by Pi starvation are not a consequence of metabolic limitation but a result of genetic regulation. This highlights the existence of signal transduction pathway(s) that limit plant development under the Pi starvation condition.


Figures

Figure 1.
Figure 1.
Identification of drugs altering PHT1;4 expression. A, Screen used to identify PTN molecules. GUS staining of pht1;4-1 plantlets germinated and grown 5 d on +Pi (500 µm) and transferred for 5 d on +Pi, –Pi (15 µm), or –Pi plus PTN1 (25 µm). B, Chemical structure of PTN1.
Figure 2.
Figure 2.
PTN1 modulates Pi uptake. A, Impact of PTN1 treatment (40 µm) on various PHT1 transcript levels. Measurements are from qPCR experiments on root mRNA. B, Uptake experiments performed with different Pi concentrations. C, Impact of PTN1 on total phosphorus content. Measurements were performed using ICP assays. Asterisks represent significant difference between –Pi and –Pi plus PTN1 40 µm (Student’s t test, P < 0.01). Seven-day-old (A and B) or 10-d-old (C) plantlets were used. White bars indicate –Pi, black bars indicate –Pi plus PTN1, and gray bars indicate +Pi. [See online article for color version of this figure.]
Figure 3.
Figure 3.
PTN1 reduces the transcriptional regulation that occurs during Pi starvation. A and B, Comparison of PTN1 treatment or Pi supply on global transcriptomic analysis. For this analysis, 14-d-old wild-type root samples of plants grown on –Pi, –Pi plus PTN1 (40 µm), or +Pi were used. Data are expressed as ratio values between +Pi and –Pi or –Pi plus PTN1 and –Pi, respectively. A, Relative expression of genes induced and repressed by +Pi versus the –Pi plus PTN1 condition. B, Number of genes regulated by Pi and PTN1 addition and the percentage of genes regulated by +Pi as well as PTN1. Selected genes exhibited at least a 2-fold change difference with –Pi control, based on statistical analysis (Bonferroni test, P < 0.05).
Figure 4.
Figure 4.
PTN1 reduces metabolic stress during Pi starvation. A, Transcript level measurements (by qPCR) of genes involved in lipid synthesis for plants grown on –Pi, –Pi plus PTN1 (40 µm), or +Pi for 14 d. B, Proportion of phospholipids (white) and glycolipids (gray) for plants grown on –Pi, –Pi plus PTN1, or +Pi media. Asterisks represent significant differences between –Pi and –Pi plus PTN1 (40 µm; Student’s t test, P ≤ 0.01). C, Lipid composition of wild-type plants grown on low Pi (white bars), low Pi plus PTN1 (dark gray bars), or high Pi (light gray bars). Total lipids were extracted from the aerial part of 10-d-old plants. D, Anthocyanin content for plants grown on –Pi, –Pi plus PTN1 (40 µm), or +Pi. E, Starch content revealed by staining of shoots with Lugol. FW, Fresh weight; DPG, diphosphatidylglycerol; PC, phosphatidylethanolamine; PE, phosphatidylinositol; PG, phosphatidylglycerol; PI, phosphatidylinositol; DGDG, digalactosyl-diacylglycerol.
Figure 5.
Figure 5.
PTNs reduce the Pi starvation-induced growth limitation. A, Identification of the optimal PTN1 level to suppress the Pi starvation symptom on root growth. A similar effect can also be observed with the PTN1 analog PTN3 and PTN4 applying 100 or 10 µm, respectively. B, Analysis of the cell cycle using the cycB1::GUS marker. Pictures of root tips from wild-type (WT; top) and cycB1::GUS (bottom) plants grown on –Pi, –Pi plus PTN1 (40 µm), or +Pi conditions after GUS staining. C, Measures of cortical cell size in wild-type plantlets grown on –Pi, –Pi plus PTN1 (40 µm), and +Pi. In A to C, 7-d-old plantlets were used for the various experiments. D, Impact of Pi concentration on PTN effect on the primary root growth. For the measures of the primary root length, plants were grown during 5 d on Pi-rich medium and transferred on various conditions tested during 24 h (PTN4, 10 µm). The red line shows the maximum gain of growth conferred by PTN1 presence. E, Effect of PTN treatment on mutants affected in the root architecture response to Pi starvation. Measurements of the primary root growth of wild-type plants, and pdr2 and phr1 mutants, were taken 9 d after germination on –Pi or –Pi plus PTN1 (40 µm) and +Pi. F, Effect of PTN1 (40 µm) addition on rosette development. G, Effect of PTN1 addition on aerial development of the wild type and the lpr1 mutant. Col-0, Ecotype Columbia.

References

    1. Abel S. (2011) Phosphate sensing in root development. Curr Opin Plant Biol 14: 303–309 - PubMed
    1. Andersson MX, Larsson KE, Tjellström H, Liljenberg C, Sandelius AS. (2005) Phosphate-limited oat. The plasma membrane and the tonoplast as major targets for phospholipid-to-glycolipid replacement and stimulation of phospholipases in the plasma membrane. J Biol Chem 280: 27578–27586 - PubMed
    1. Andersson MX, Stridh MH, Larsson KE, Liljenberg C, Sandelius AS. (2003) Phosphate-deficient oat replaces a major portion of the plasma membrane phospholipids with the galactolipid digalactosyldiacylglycerol. FEBS Lett 537: 128–132 - PubMed
    1. Bayle V, Arrighi JF, Creff A, Nespoulous C, Vialaret J, Rossignol M, Gonzalez E, Paz-Ares J, Nussaume L. (2011) Arabidopsis thaliana high-affinity phosphate transporters exhibit multiple levels of posttranslational regulation. Plant Cell 23: 1523–1535 - PMC - PubMed
    1. Bournier M, Tissot N, Mari S, Boucherez J, Lacombe E, Briat JF, Gaymard F. (2013) Arabidopsis ferritin 1 (AtFer1) gene regulation by the phosphate starvation response 1 (AtPHR1) transcription factor reveals a direct molecular link between iron and phosphate homeostasis. J Biol Chem 288: 22670–22680 - PMC - PubMed

Publication types

MeSH terms

LinkOut - more resources