. 2014 Nov 7;289(45):31296-309.
doi: 10.1074/jbc.M114.565796. Epub 2014 Sep 10.

Ral GTPase down-regulation stabilizes and reactivates p53 to inhibit malignant transformation

Affiliations

Ral GTPase down-regulation stabilizes and reactivates p53 to inhibit malignant transformation

Awet Tecleab et al. J Biol Chem. .

Abstract

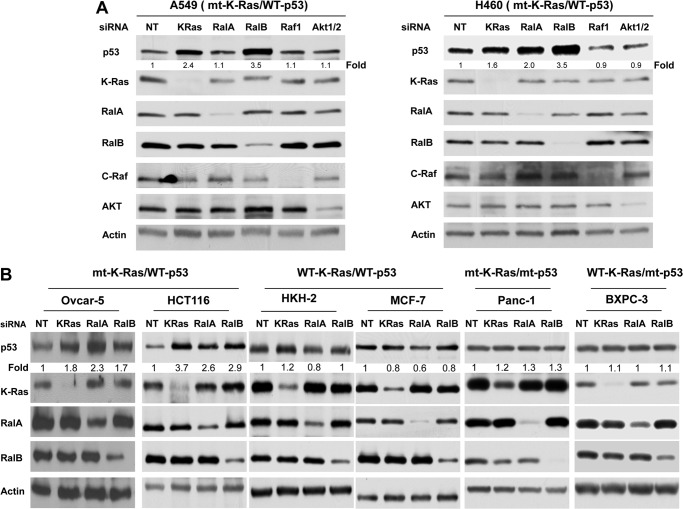
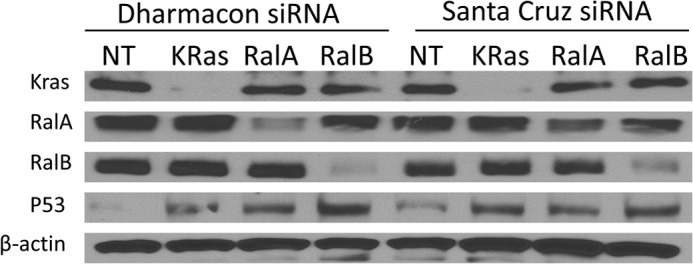
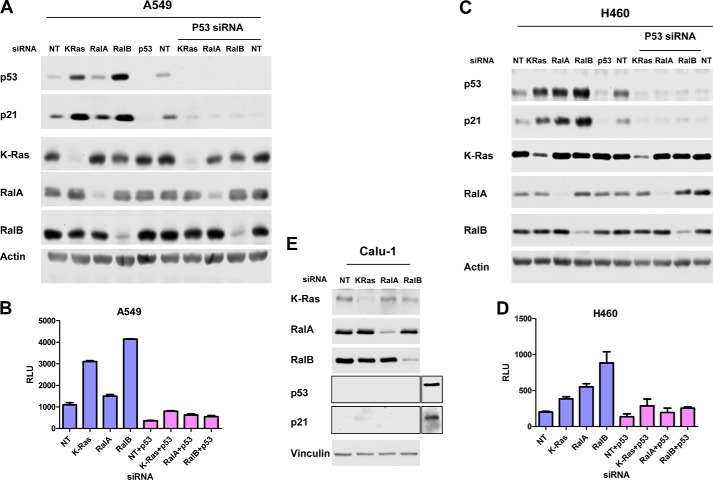
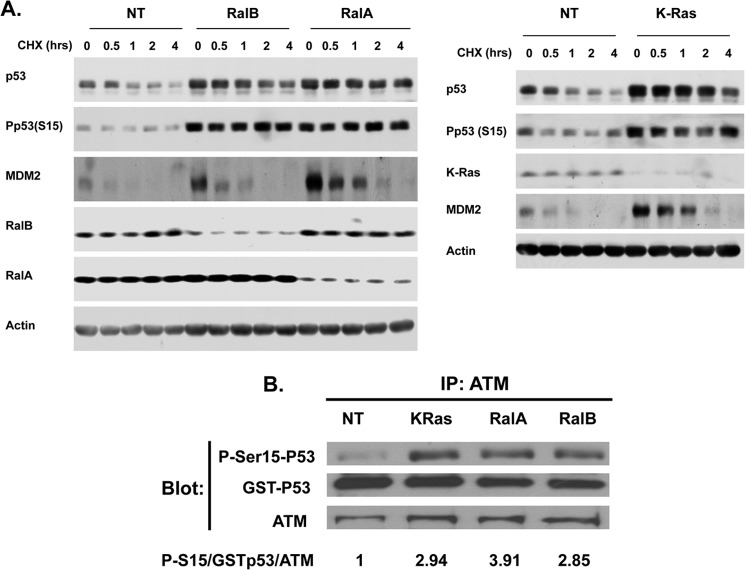
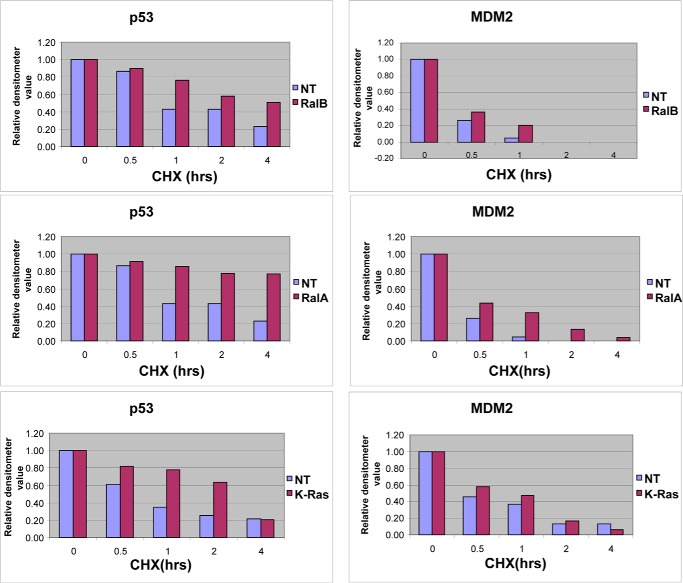
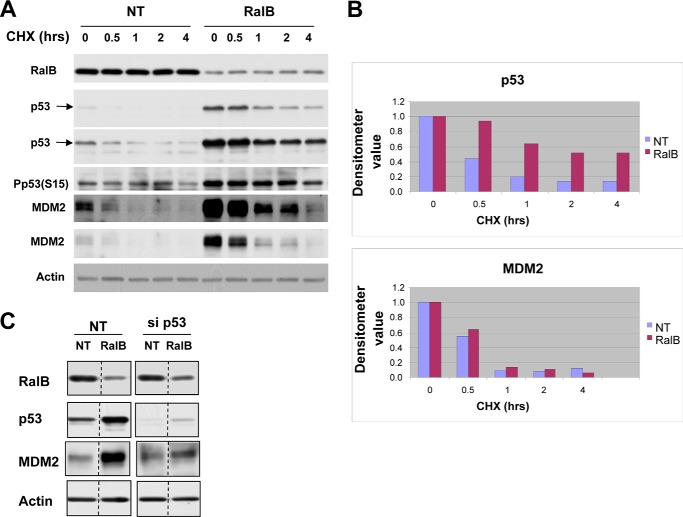
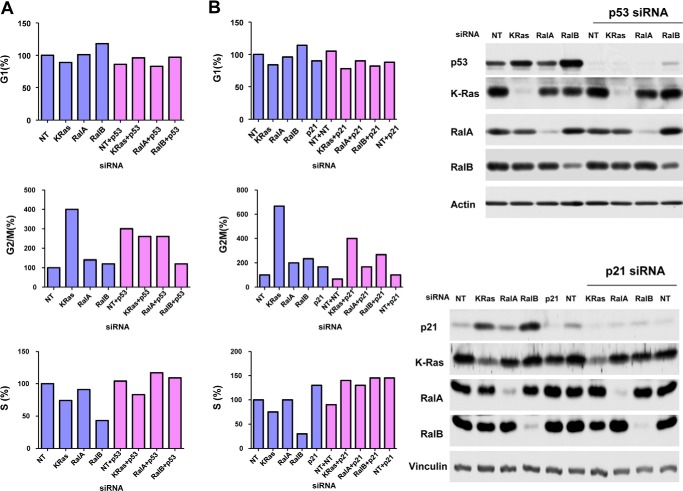
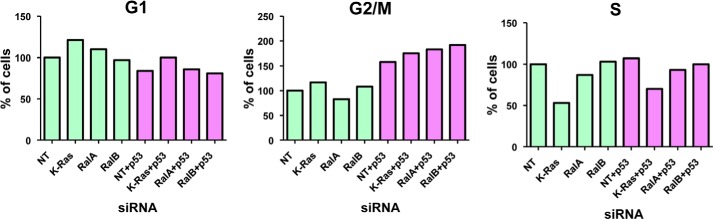
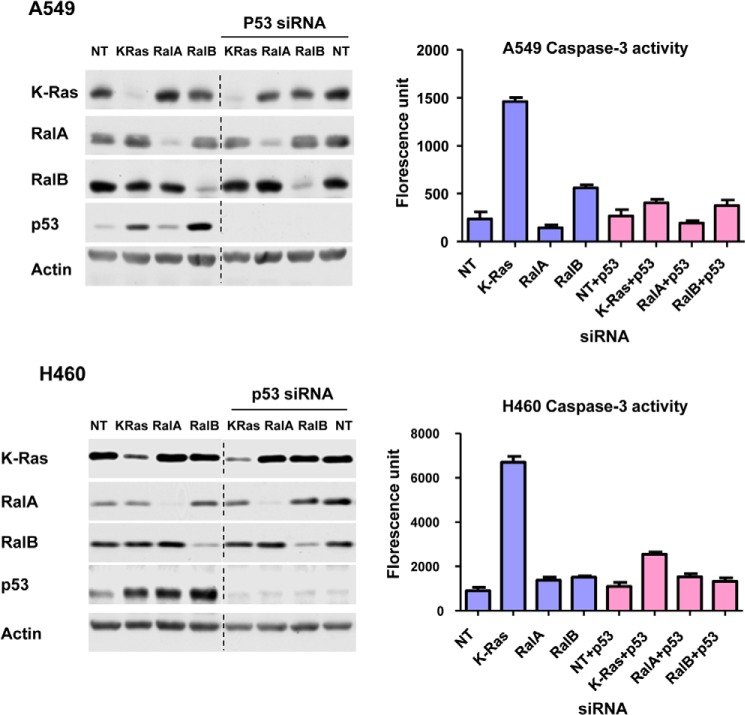
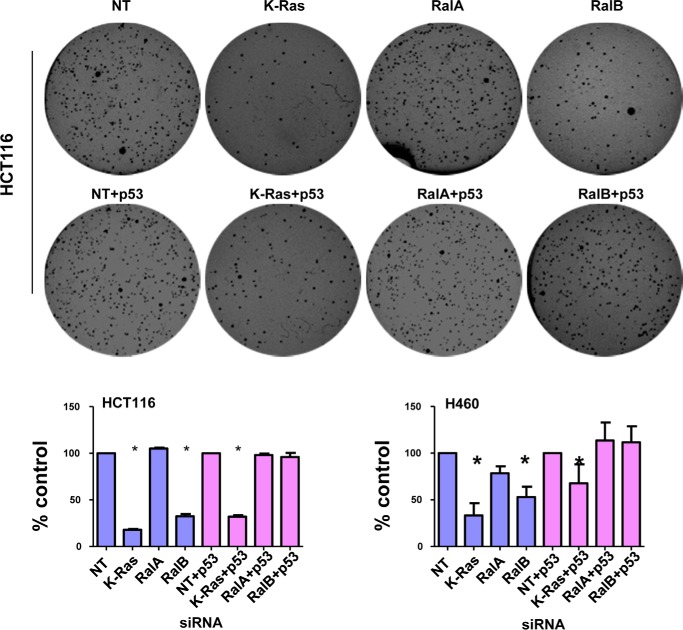
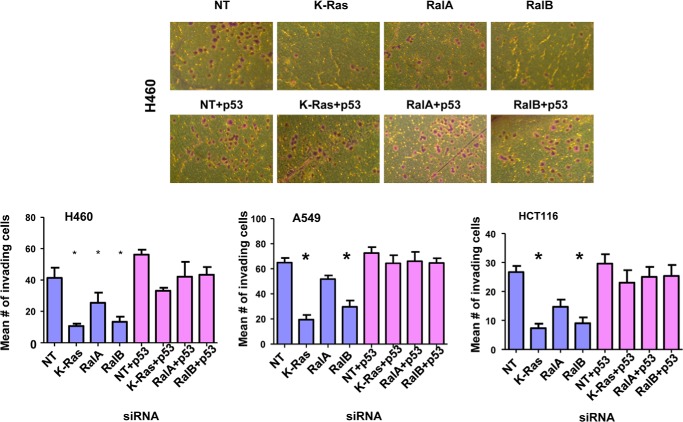
Ral GTPases are critical effectors of Ras, yet the molecular mechanism by which they induce malignant transformation is not well understood. In this study, we found the expression of K-Ras, RalB, and sometimes RalA, but not AKT1/2 and c-Raf, to be required for maintaining low levels of p53 in human cancer cells that harbor mutant K-Ras and wild-type p53. Down-regulation of K-Ras, RalB, and sometimes RalA increases p53 protein levels and results in a p53-dependent up-regulation of the expression of p21(WAF). K-Ras, RalA, and RalB depletion increases p53 stability as demonstrated by ataxia telangiectasia-mutated kinase activation, increased Ser-15 phosphorylation, and a significant (up to 6-fold) increase in p53 half-life. Furthermore, depletion of K-Ras and RalB inhibits anchorage-independent growth and invasion and interferes with cell cycle progression in a p53-dependent manner. Depletion of RalA inhibits invasion in a p53-dependent manner. Thus, expression of K-Ras and RalB and possibly RalA proteins is critical for maintaining low levels of p53, and down-regulation of these GTPases reactivates p53 by significantly enhancing its stability, and this contributes to suppression of malignant transformation.

Keywords: Apoptosis; Cancer Biology; K-Ras; RalA; RalB; Ras Protein; Serine 15 Phosphorylation; Signal Transduction; p53.


Figures

FIGURE 1.
FIGURE 1.
Depletion of RalA and/or RalB increases p53 protein levels in cancer cells with wild-type p53 and mutant (mt) K-Ras. A, depletion of RalA and/or RalB but not AKT1/2 or c-Raf affects p53 protein levels in cells with mt K-Ras and WT p53. H460 and A549 cells were transfected with indicated siRNAs for 48 h and processed for Western blot analysis as described under “Experimental Procedures.” B, cancer cells that harbor mt K-Ras and WT p53 (HCT116 colon cancer cells and OVCAR-5 ovarian cancer cells), WT K-Ras and WT p53 (HKH2 and MCF7 breast cancer cells), WT K-Ras and mt p53 (BXPC3 pancreatic cancer cells), and mt K-Ras and mt p53 (Panc-1 pancreatic cancer cells) were transfected with the indicated siRNAs for 48 h and processed for Western blot analysis as described under “Experimental Procedures.” Data are representative of three (A549, H460, and HCT116) or two (OVCAR-5, Panc-1, HKH2, MCF7, and BXPC3) independent experiments. In H460 cells, densitometry quantification shows that depletion of K-Ras, RalA, and RalB increased p53 levels by 2.16 ± 0.33-, 2.23 ± 0.18-, and 3.36 ± 0.11-fold, respectively. These increases were statistically significant with p values of less than 0.05, 0.01, and 0.01, respectively. In A549 cells, densitometry quantification shows that depletion of K-Ras and RalB increased p53 levels by 1.89 ± 0.26- and 2.40 ± 0.55-fold, respectively. These increases were statistically significant, with p values of less than 0.05 and 0.05, respectively. Depletion of RalA did not affect the levels of p53 (1.02 ± 0.07-fold) in A549 cells. NT, nontargeting.
FIGURE 2.
FIGURE 2.
Depletion of RalA, RalB, or K-Ras increases p53 protein levels, confirmation with two distinct siRNA pools. H460 cells were transfected with the indicated siRNA for 48 h and processed for Western blotting analysis as described under “Experimental Procedures.” siRNAs were from Dharmacon (a smart pool of four distinct siRNAs for each gene), and siRNAs were from Santa Cruz Biotechnology (a smart pool of 3–5 distinct siRNAs for each gene). NT, nontargeting.
FIGURE 3.
FIGURE 3.
Depletion of K-Ras, RalA, and RalB regulates p21 expression levels in a p53-dependent manner. A549 (A) and H460 (C) cells were transfected with nontargeting (NT), K-Ras, RalA, or RalB siRNAs alone or in combination with p53 siRNA for 48 h. Cells were harvested for Western blot analysis as described under “Experimental Procedures.” A549 (B) and H460 (D) cells were transfected with p21 promoter-reporter constructs followed by transfection with the indicated siRNAs. Cells were harvested and analyzed for p21 promoter activity as described under “Experimental Procedures.” E, Calu-1 cells were transfected with the indicated siRNAs and processed for Western blot analysis as described under “Experimental Procedures.” Extra lanes on p53 and p21 blots were from a control lysate (Panc-1 cells) used as a control for the Western blot analysis. Data are representative of three independent experiments except for Calu-1 cell experiments, which were done twice.
FIGURE 4.
FIGURE 4.
Depletion of K-Ras, RalA, and RalB increases p53 protein stability. A, H460 cells were treated with nontargeting (NT), K-Ras, RalA, or RalB siRNAs for 48 h followed by cycloheximide (CHX) treatment for the indicated lengths of time. Cells were harvested and processed for Western blot analysis as described under “Experimental Procedures.” B, H460 cells were treated with nontargeting (NT), K-Ras, RalA, or RalB siRNAs for 48 h. The cells were lysed, the ATM was immunoprecipitated (IP) and processed for ATM kinase assay using GST-p53 as a substrate, and the reaction products were subjected to immunoblotting with antibodies to phospho-Ser-15-p53, GST, and ATM as described under “Experimental Procedures.” Data are representative of two independent experiments.
FIGURE 5.
FIGURE 5.
Depletion of K-Ras, RalA, and RalB increases p53 but not MDM2 half-life in H460 cells. Densitometer values represent the expression levels of p53 and MDM2 following depletion of K-Ras, RalA, or RalB. The expression levels of p53 and actin were measured at the indicated time points, and the relative p53 expression level was determined by dividing p53 by actin densitometry values. The value at the 0-h time point was set as 1, and the rest of the values at different time points were normalized against the 0-h value. Data are representative of two independent experiments. NT, nontargeting; CHX, cycloheximide.
FIGURE 6.
FIGURE 6.
Depletion of RalB increases p53 stability in A549 cells. A, A549 cells were transfected with the indicated siRNA for 48 h followed by cycloheximide (CHX) treatment for the indicated length of time and processed for Western blot analysis as indicated under “Experimental Procedures.” Data are representative of two independent experiments. B, p53 and MDM2 from A were quantified as described in Fig. 5 legend. C, A549 cells were transfected with the indicated siRNA for 48 h and then processed for Western blot analysis. Data are representative of three independent experiments. NT, nontargeting.
FIGURE 7.
FIGURE 7.
Effects of depletion of K-Ras, RalA, and RalB on cell cycle progression. A549 cells were treated with indicated siRNAs for 48 h and processed for cell cycle analysis as described under “Experimental Procedures.” The percentage of cells in each cell cycle phase relative to nontargeting (NT) is shown. A, depletion of p53 rescue. B, depletion of p21 rescue.
FIGURE 8.
FIGURE 8.
Effects of depletion of K-Ras, RalA, and RalB on cell cycle progression in H460 cells. H460 cells were treated with the indicated siRNA for 48 h and processed for cell cycle analysis as described under “Experimental Procedures.” The percentage of cells in each cell cycle phase relative to nontargeting (NT) is shown.
FIGURE 9.
FIGURE 9.
Effects of depletion of K-Ras, RalA, and RalB on apoptosis. H460 and A549 cells were transfected with siRNA for 48 h and then harvested for Western blot analysis (left panel) or caspase-3 activation assay (right panel) as described under “Experimental Procedures.” Data are representative of two independent experiments. NT, nontargeting.
FIGURE 10.
FIGURE 10.
Effects of depletion of K-Ras, RalA, and RalB on anchorage-independent growth. H460 or HCT116 cells were transfected with indicated siRNAs for 48 h before plating in soft agar as described under “Experimental Procedures.” Results are shown as average percent inhibition of four independent experiments (H460) or three independent experiments (HCT116). Nontargeting (NT) and nontargeting + p53 siRNAs were set as 100%. For H460, mean number of colonies for nontargeting was 323 ± 8.5 and for nontargeting + p53 siRNA was 232 ± 66.22. For HCT116, mean number of colonies for nontargeting was 469 ± 7.2 and for nontargeting + p53 siRNA was 484 ± 6. Error bars show S.E. Student's t test was used to compare the means; p values are shown for tests that show significant differences (*, p < 0.05). Top panel shows representative soft agar pictures for HCT116 cells.
FIGURE 11.
FIGURE 11.
Effects of depletion of K-Ras, RalA, and RalB on invasion. A549, H460, or HCT116 cells were transfected with the indicated siRNAs for 48 h, and then equal numbers of cells were seeded for invasion assays as described under “Experimental Procedures.” The cells were then photographed and counted to determine the mean number of invading cells. Top panel shows representative image of invading cells of H460, and bottom panels show average number of invading cells. p values for H460 are K-Ras = 0.02, RalA = 0.02, and RalB = 0.03. p values for HCT116 are K-Ras = 0.006 and RalB = 0.007. p values for A549 are K-Ras = 0.004 and RalB = 0.0006. NT, nontargeting.

Similar articles

Cited by

References

    1. Hanahan D., Weinberg R. A. (2011) Hallmarks of cancer: the next generation. Cell 144, 646–674 - PubMed
    1. Forbes S. A., Bindal N., Bamford S., Cole C., Kok C. Y., Beare D., Jia M., Shepherd R., Leung K., Menzies A., Teague J. W., Campbell P. J., Stratton M. R., Futreal P. A. (2011) COSMIC: mining complete cancer genomes in the Catalogue of Somatic Mutations in Cancer. Nucleic Acids Res. 39, D945–D950 - PMC - PubMed
    1. Downward J. (2003) Targeting RAS signalling pathways in cancer therapy. Nat. Rev. Cancer 3, 11–22 - PubMed
    1. Brown C. J., Lain S., Verma C. S., Fersht A. R., Lane D. P. (2009) Awakening guardian angels: drugging the p53 pathway. Nat. Rev. Cancer 9, 862–873 - PubMed
    1. Ferbeyre G., de Stanchina E., Lin A. W., Querido E., McCurrach M. E., Hannon G. J., Lowe S. W. (2002) Oncogenic ras and p53 cooperate to induce cellular senescence. Mol. Cell. Biol. 22, 3497–3508 - PMC - PubMed

Publication types

MeSH terms