. 2014 Dec 1;112(11):2888-900.
doi: 10.1152/jn.00406.2014. Epub 2014 Sep 10.

Regular-spiking cells in the presubiculum are hyperexcitable in a rat model of temporal lobe epilepsy

Affiliations

Regular-spiking cells in the presubiculum are hyperexcitable in a rat model of temporal lobe epilepsy

Saad Abbasi et al. J Neurophysiol. .

Abstract

Temporal lobe epilepsy (TLE) is the most common form of adult epilepsy, characterized by recurrent seizures originating in the temporal lobes. Here, we examine TLE-related changes in the presubiculum (PrS), a less-studied parahippocampal structure that both receives inputs from and projects to regions affected by TLE. We assessed the state of PrS neurons in TLE electrophysiologically to determine which of the previously identified cell types were rendered hyperexcitable in epileptic rats and whether their intrinsic and/or synaptic properties were altered. Cell types were characterized based on action potential discharge profiles followed by unsupervised hierarchical clustering. PrS neurons in epileptic animals could be divided into three major groups comprising of regular-spiking (RS), irregular-spiking (IR), and fast-adapting (FA) cells. RS cells, the predominant cell type encountered in PrS, were the only cells that were hyperexcitable in TLE. These neurons were previously identified as sending long-range axonal projections to neighboring structures including medial entorhinal area (MEA), and alterations in intrinsic properties increased their propensity for sustained firing of action potentials. Frequency and amplitude of both spontaneous excitatory and inhibitory synaptic events were reduced. Further analysis of nonaction potential-dependent miniature currents (in tetrodotoxin) indicated that reduction in excitatory drive to these neurons was mediated by decreased activity of excitatory neurons that synapse with RS cells concomitant with reduced activity of inhibitory neurons. Alterations in physiological properties of PrS neurons and their ensuing hyperexcitability could entrain parahippocampal structures downstream of PrS, including the MEA, contributing to temporal lobe epileptogenesis.

Keywords: TLE; cell classification; electrophysiology; hyperexcitability; presubiculum.


Figures

Fig. 1.
Fig. 1.
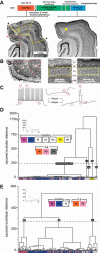
The presubicular slice preparation used in our study. A: schematic outlining the various steps involved in bringing up the pilocarpine model of temporal lobe epilepsy (TLE). Low-powered images of Nissl-stained sections from control (left) and epileptic (right) animals, identifying the major anatomical landmarks: presubiculum (PrS), parasubiculum (Par), subiculum (Sub), medial entorhinal area (MEA), dentate gyrus (DG), hippocampal CA1, and lateral entorhinal area (LEA). Red arrows indicate the mediolateral extent of LII in PrS (region demarcated by red dashed lines). B: high-powered image of PrS (left) highlighting LII (white arrows) and various lamina (indicated by Roman numerals) and MEA (right) from control (○) and epileptic (●) animals with demarcated regions of interest from A. C: electrophysiological parameters used for cell classification: 1) early spike frequency adaption (%), 2) late spike frequency adaptation (%), 3) instantaneous firing frequency (Hz), 4) steady-state firing frequency (Hz), 5) sag ratio (%), 6) measure of input resistance (MΩ), 7) delay to first action potential (ms), 8) action potential half-width (ms), 9) spike-firing threshold (mV), and 10) afterhyperpolarization (mV). DE: classification of all neurons (D) and multispiking cells (E) in LII and III of PrS using unsupervised hierarchical cluster analysis based on the above parameters (Table 1 and Fig. 1C). Intersection of dendrogram branches with the x-axis represents individual cells, and the y-axis represents the squared Euclidean distances between group centroids at each branch point (longer vertical lines indicate greater dissimilarity). Dashed lines indicate number of groups as determined by the Thorndike method (see materials and methods). Inset: Thorndike method suggests 5 groups in a scree plot; x-axis: clustering stages, y-axis: squared Euclidean distance between group centroids. Individual cells from control and epileptic animals are color coded according to group membership (control only cell types are not colored). Cell types: irregular-spiking (IR), regular-spiking (RS), initially bursting (IB), late-spiking (LS), stuttering (Stu), fast-adapting (FA), and single-spiking (SS).
Fig. 2.
Fig. 2.
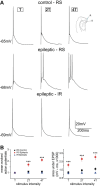
Hyperexcitability of RS cells in TLE. A: representative examples of action potentials evoked in RS and IR cells under the indicated conditions in response to stimulation at threshold (T) and increasing multiples (×2 and ×4) of T. Resting membrane potential for cells is indicated along with placement of stimulating (S) and recording (R) electrode in brain slices (inset). B: scatter plots for mean number of action potentials evoked and area under the composite excitatory postsynaptic potential (EPSP) in response to increasing stimulus intensity for the indicated cell types. ***P < 0.001, t-test.
Fig. 3.
Fig. 3.
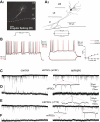
IR cells. A1: representative photomicrograph captured on a confocal microscope of a biocytin-labeled IR neuron in LII of PrS from an epileptic rat. Roman numerals (I-III) indicate lamina and scale bar = 100 μm. A2: neurolucida reconstruction of the IR cell in A1 showing laminar location of somata and dendritic morphology. B: representative examples of action potential discharge in IR cells from control and epileptic animals. Action potential (AP) waveforms in response to sustained current injections of 100 pA (1- to 10-s duration; left) and hyper- and depolarizing current pulses (±100 pA, 600 ms duration; middle) from resting membrane potential (Vm). CF: excitatory and inhibitory synaptic drive to IR cells from control and epileptic animals, measured using voltage clamp. Graph of the mean number of action potentials as a function of depolarizing current injection from control and epileptic neurons (0–200 pA in 50-pA increments, 600-ms duration; right). C: trace (1 min long) of spontaneous excitatory postsynaptic currents [sEPSCs, inward events recorded at −70-mV holding potential in artificial cerebrospinal fluid (aCSF)] recorded from IR cells in control (left) and epileptic animals (right). In this and all subsequent figures, embedded insets offer an expanded view of the indicated portions of traces (dotted lines). D: spontaneous inhibitory postsynaptic currents (sIPSCs, outward events recorded at 0 mV in aCSF). E: miniature excitatory postsynaptic currents [mEPSCs, inward events recorded at −70 mV in the presence of 1 μM tetrodotoxin (TTX)]. F: miniature inhibitory postsynaptic currents (mIPSCs, outward events recorded at 0 mV in TTX).
Fig. 4.
Fig. 4.
FA cells. A1: representative photomicrograph captured on a confocal microscope of a biocytin-labeled FA neuron in LII of PrS from an epileptic rat. Roman numerals (I-III) indicate lamina and scale bar = 100 μm. A2: neurolucida reconstruction of the FA cell in A1 showing laminar location of somata and dendritic morphology. B: representative examples of action potential discharge in FA cells from control and epileptic animals. Action potential waveforms in response to sustained current injections of 100 pA (1- to 10-s duration; left) and hyper- and depolarizing current pulses (±100 pA, 600-ms duration; middle) from resting membrane potential (Vm). CF: excitatory and inhibitory synaptic drive to FA cells from control and epileptic animals, measured using voltage clamp. Graph of the mean number of action potentials as a function of depolarizing current injection from control and epileptic neurons (0–200 pA in 50-pA increments, 600-ms duration; right). C: trace (1-min long) of sEPSCs (inward events recorded at −70-mV holding potential in aCSF) recorded from FA cells in control (left) and epileptic animals (right). Embedded insets offer an expanded view of the indicated portions of traces (dotted lines). D: sIPSCs (outward events recorded at 0 mV in aCSF) E: mEPSCs (inward events recorded at −70 mV in the presence of 1 μM TTX). F: mIPSCs (outward events recorded at 0 mV in TTX).
Fig. 5.
Fig. 5.
RS cells. A1: representative photomicrograph captured on a confocal microscope of biocytin-labeled RS neurons in LII and LIII of PrS from an epileptic rat. Roman numerals (I-III) indicate lamina and scale bar = 100 μm. A2: beurolucida reconstruction of RS cells in A1 showing laminar location of somata and dendritic morphology. B: representative examples of action potential discharge in RS cells from control and epileptic animals. Action potential waveforms in response to sustained current injections of 100 pA (1- to 10-s duration; left) and hyper- and depolarizing current pulses (±100 pA, 600-ms duration; middle) from resting membrane potential (Vm). CF: excitatory and inhibitory synaptic drive to RS cells from control and epileptic animals, measured using voltage clamp. Graph of the mean number of action potentials as a function of depolarizing current injection from control and epileptic neurons (0–200 pA in 50-pA increments, 600-ms duration; right). C: trace (1-min long) of sEPSCs (inward events recorded at −70-mV holding potential in aCSF) recorded from RS cells in control (left) and epileptic animals (right). Embedded insets offer an expanded view of the indicated portions of traces (dotted lines). D: sIPSCs (outward events recorded at 0 mV in aCSF) E: mEPSCs (inward events recorded at −70 mV in the presence of 1 μM TTX). F: mIPSCs (outward events recorded at 0 mV in TTX).
Fig. 6.
Fig. 6.
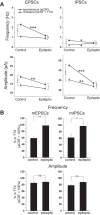
Measurements of synaptic activity in RS cells from control and epileptic animals. A: changes to frequency and amplitude of excitatory and inhibitory postsynaptic currents under the indicated conditions. Statistical significance (voltage-clamp) between control and epileptic groups: *P < 0.05; **P < 0.01; ***P < 0.001, t-test; before and after of TTX. +P < 0.05, ++P < 0.01, +++P < 0.001, paired t-test. B: bar plots comparing s- and mEPSC frequency and amplitude under control and epileptic conditions (for each plot 100% = magnitude of the response in aCSF). *P < 0.05; **P < 0.01, t-test.
Fig. 7.
Fig. 7.
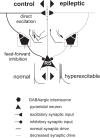
A summary of possible changes in excitatory and inhibitory synaptic drive rendering RS cells in the PrS hyperexcitable under epileptic conditions. The brake analogy refers to synaptic inhibition of RS cells. Open questions (?) include the identity of GABAergic neurons that target RS cells and the direct assessment of synaptic drive to these neurons under control and epileptic conditions.

References

    1. Abbasi S, Kumar SS. Electrophysiological and morphological characterization of cells in superficial layers of rat presubiculum. J Comp Neurol 521: 3116–3132, 2013. - PubMed
    1. Bartesaghi R, Di Maio V, Gessi T. Topographic activation of the medial entorhinal cortex by presubicular commissural projections. J Comp Neurol 487: 283–299, 2005. - PubMed
    1. Bear J, Fountain NB, Lothman EW. Responses of the superficial entorhinal cortex in vitro in slices from naive and chronically epileptic rats. J Neurophysiol 76: 2928–2940, 1996. - PubMed
    1. Boccara CN, Sargolini F, Thoresen VH, Solstad T, Witter MP, Moser EI, Moser MB. Grid cells in pre- and parasubiculum. Nat Neurosci 13: 987–994, 2010. - PubMed
    1. Brenner R, Chen QH, Vilaythong A, Toney GM, Noebels JL, Aldrich RW. BK channel beta4 subunit reduces dentate gyrus excitability and protects against temporal lobe seizures. Nat Neurosci 8: 1752–1759, 2005. - PubMed

Publication types

LinkOut - more resources