. 2014 Nov;88(22):13310-21.
doi: 10.1128/JVI.02186-14. Epub 2014 Sep 10.

Early preservation of CXCR5+ PD-1+ helper T cells and B cell activation predict the breadth of neutralizing antibody responses in chronic HIV-1 infection

Affiliations

Early preservation of CXCR5+ PD-1+ helper T cells and B cell activation predict the breadth of neutralizing antibody responses in chronic HIV-1 infection

Kristen Cohen et al. J Virol. 2014 Nov.

Abstract

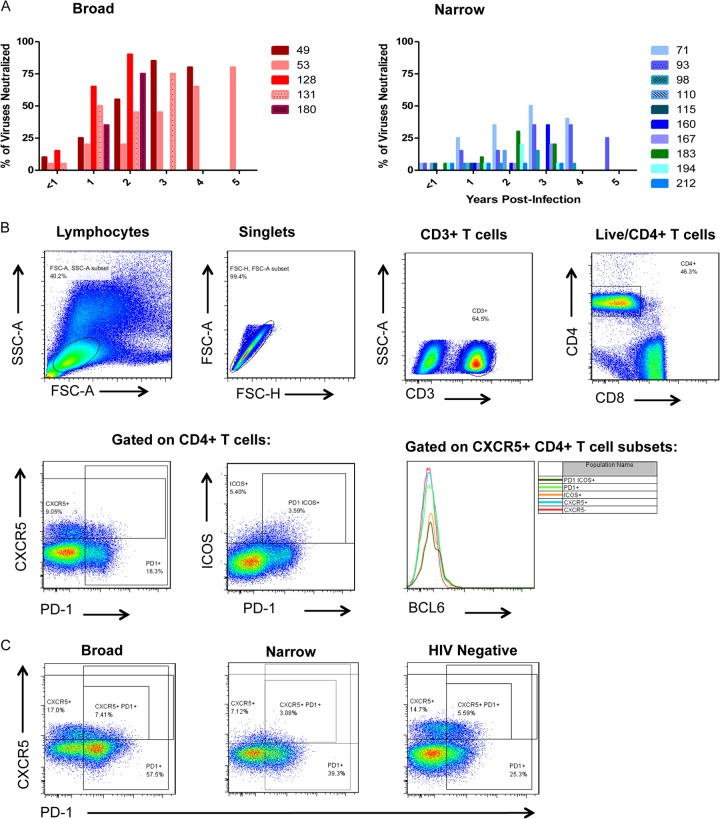
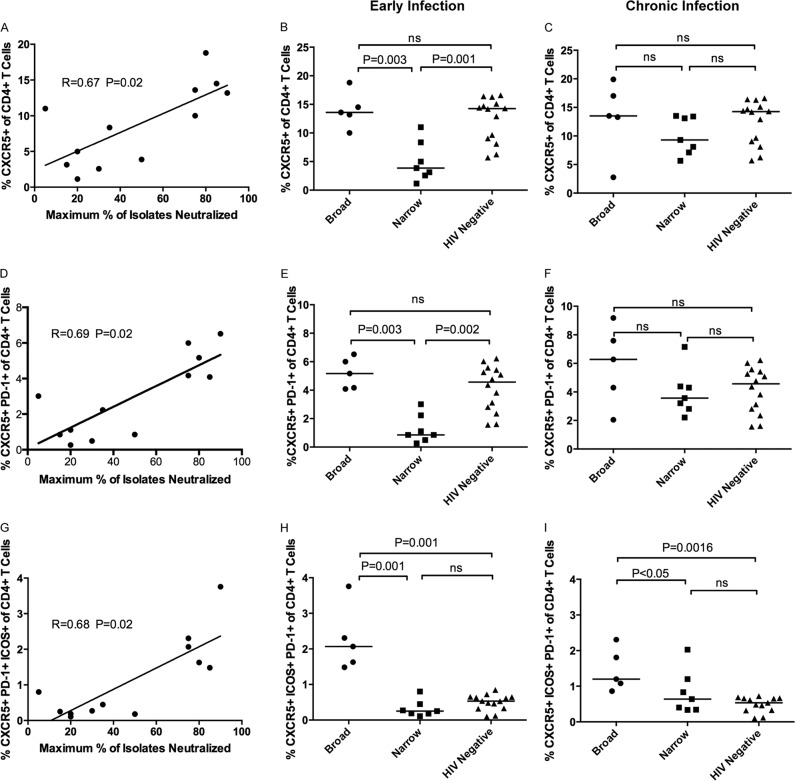
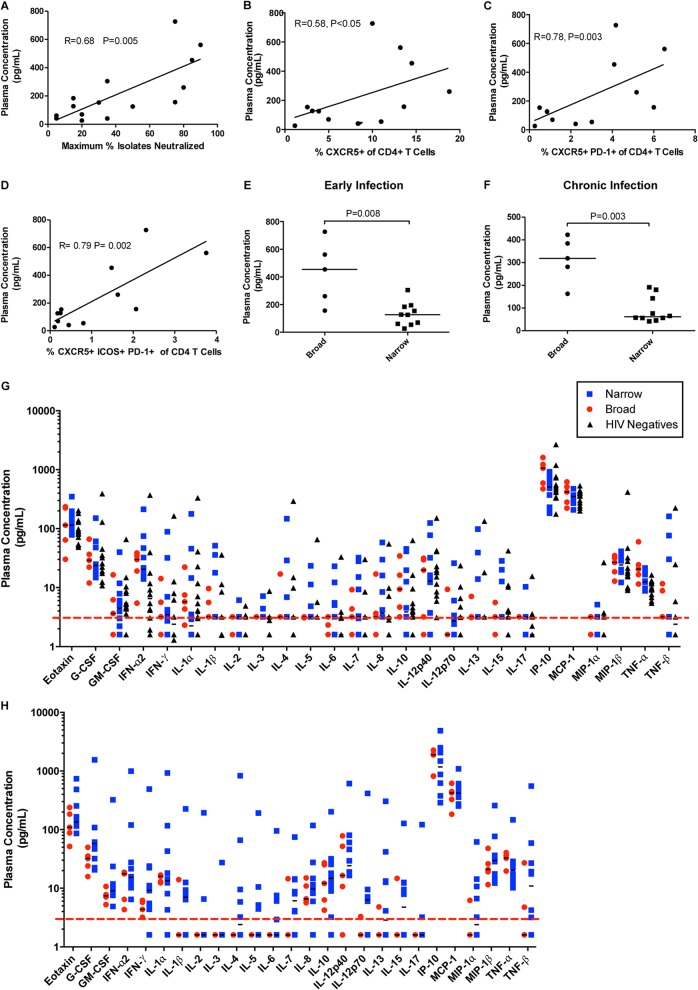
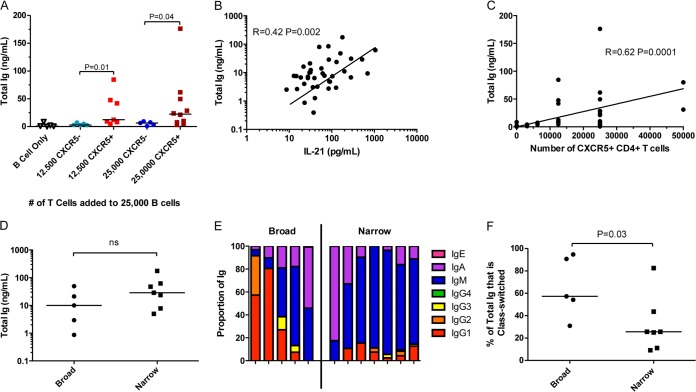
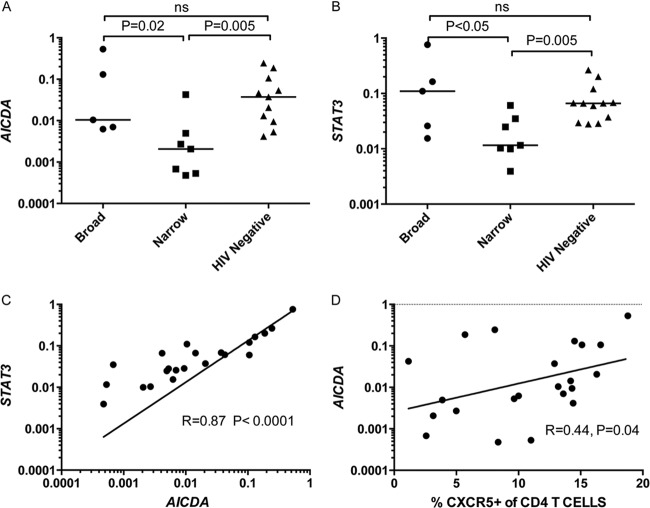
Much is known about the characteristics of broadly neutralizing antibodies (bNAbs) generated during HIV-1 infection, but little is known about immunological mechanisms responsible for their development in only a minority of those infected by HIV-1. By monitoring longitudinally a cohort of HIV-1-infected subjects, we observed that the preservation of CXCR5(+) CD4(+) T helper cell frequencies and activation status of B cells during the first year of infection correlates with the maximum breadth of plasma neutralizing antibody responses during chronic infection independently of viral load. Although, during the first year of infection, no differences were observed in the abilities of peripheral CXCR5(+) CD4(+) T helper cells to induce antibody secretion by autologous naive B cells, higher frequencies of class-switched antibodies were detected in cocultures of CXCR5(+) CD4(+) T and B cells from the subjects who later developed broadly neutralizing antibody responses than those who did not. Furthermore, B cells from the former subjects had higher expression of AICDA than B cells from the latter subjects, and transcript levels correlated with the frequency of CXCR5(+) CD4(+) T cells. Thus, the early preservation of CXCR5(+) CD4(+) T cells and B cell function are central to the development of bNAbs. Our study provides a possible explanation for their infrequent generation during HIV-1 infection.

Importance: Broadly neutralizing antibodies are developed by HIV-1-infected subjects, but so far (and despite intensive efforts over the past 3 decades) they have not been elicited by immunization. Understanding how bNAbs are generated during natural HIV-1 infection and why only some HIV-1-infected subjects generate such antibodies will assist our efforts to elicit bNAbs by immunization. CXCR5(+) PD-1(+) CD4(+) T cells are critical for the development of high-affinity antigen-specific antibody responses. In our study, we found that the HIV-1-infected subjects who develop bNAbs have a higher frequency of peripheral CXCR5(+) PD-1(+) CD4(+) T cells in early infection and also that this frequency mirrored what was observed in uninfected subjects and correlated with the level of B cell activation across subjects. Our study highlights the critical role helper T cell function has in the elicitation of broadly neutralizing antibody responses in the context of HIV infection.


Figures

FIG 1
FIG 1
(A) Summary of development of broad plasma neutralizing antibody responses at the indicated years postinfection in broad (left) and narrow (right) subject groups. Individual subjects are represented by the numbers listed and respective colored bars. (B) Representative flow cytometry gating strategy for peripheral CXCR5, PD-1, and ICOS-expressing CD4+ T cells of PBMCs. SSC, side scatter; FSC, forward scatter. (C) Expression of CXCR5 and PD-1 on peripheral CD4+ T cells from representative subjects from the broad (left), narrow (middle), and HIV-1-negative control (right) groups is shown.
FIG 2
FIG 2
Frequency of CXCR5+ CD4+ T cell subsets in HIV-1-infected and uninfected subjects. The frequency of CXCR5+ CD4+ T cells (A), CXCR5+ PD-1+ CD4+ T cells (D), or CXCR5+ PD-1+ ICOS+ CD4+ T cells (G) detected in HIV-1-infected samples during early infection was plotted against the maximum percentage of heterologous viral isolates neutralized by plasma isolated from chronic infection (n = 12 subjects). The frequency of CXCR5+ CD4+ T cells in the broad (n = 5), narrow (n = 7), and HIV-1-negative control groups (n = 13) during early (B) and chronic (C) infection are shown. The frequency of CD4+ T cells expressing CXCR5 and PD-1 from the three groups during early (E) and chronic infection (F) are shown. The frequencies of CD4+ T cells that express CXCR5, PD-1, and ICOS during early (H) and chronic (I) infection are shown. Each dot represents a single subject. Correlations were determined by Spearman rank correlation and considered significant for P values of less than 0.05. The horizontal lines represent the median per subject group. The stated P values were calculated using the Mann-Whitney test for nonparametric data and were considered significant if less than 0.05. ns, not significant.
FIG 3
FIG 3
Plasma levels of CXCL13 in HIV-1-infected subjects with broad or narrow plasma cross-reactive neutralizing antibody responses. (A) For each subject, CXCL13 concentrations in plasma collected during early infection were plotted against the maximum percentage of heterologous viral isolates neutralized by plasma collected from the same subject during chronic infection (n = 15). Also shown is the frequency of CXCR5+ CD4+ T cells (B), CXCR5+ PD-1+ CD4+ T cells (C), and CXCR5+ ICOS+ PD-1+ CD4+ T cells during early infection (n = 12) (D). Each dot represents a single subject and time point. The lines are linear regression curves. The stated r and P values were calculated using Spearman rank correlation for nonparametric data and considered significant if less than 0.05. The plasma concentrations of CXCL13 for either the broad group (n = 5) or narrow group (n = 7) during early (E) and chronic infection (F) are shown. Horizontal lines are at the median plasma concentration values per subject group. The stated P values were calculated using the Mann-Whitney test for nonparametric data and considered significant if less than 0.05. (G and H) Levels of 26 cytokines and chemokines from plasma samples from HIV-1-negative control subjects and during early (G) and chronic (H) infection for the HIV-1-infected subjects. The red dashed line indicates the detection limit (3.2 pg/ml). The horizontal lines are at the medians.
FIG 4
FIG 4
Ability of peripheral CXCR5+ CD4+ T cells compared to CXCR5 CD4+ T cells in providing help to naive B cells in vitro in HIV-1-infected subjects. Autologous naive B cells and CXCR5+ or CXCR5 T cells from subjects of both the broad and narrow groups were isolated from PBMCs collected during early infection. A total of 25,000 naive B cells were cultured with either 0, 12,500, or 25,000 CXCR5 or CXCR5+ autologous CD4+ T cells and stimulated with SEB for 7 days. (A) The amount of total Ig detected in the coculture supernatant from individual subjects (n = 12) is shown. The total amount of Ig detected in these same supernatants was plotted against the amount of IL-21 detected in the supernatant (B) and the number of CXCR5+ CD4+ T cells in the coculture (C). (D) A summary of the amount of total Ig detected in cocultures containing equal numbers of CXCR5+ CD4+ T cells (25,000) with equal numbers of naive B cells (25,000) for broad (n = 5) and narrow subjects (n = 7) is shown. (E) The proportion of the Ig of each isotype detected in supernatant for each subject in the cocultures containing 25,000 CXCR5+ CD4+ T cells and 25,000 naive B cells is shown. (F) The proportion of the Ig detected which was class switched for each subject group, as summarized in panel E. Each dot represents a single subject (n = 12). The horizontal line is at the median. The stated P values were calculated using the Mann-Whitney test for nonparametric data and considered significant if less than 0.05. The stated r and P values were calculated using Spearman rank correlation for nonparametric data and considered significant if less than 0.05. The lines are linear regression curves.
FIG 5
FIG 5
STAT3 and AICDA gene expression in B cells ex vivo. Transcript levels for STAT3 and AICDA (relative to GAPDH) in bulk B cells from a single time point for HIV-1-infected and uninfected subjects. AICDA (A) and STAT3 (B) gene expression in the broad (n = 5), narrow (n = 7), and HIV-negative control subjects (n = 11) during early infection is shown. Each dot represents a single subject. The horizontal lines represent the medians. The stated P values were calculated using the Mann-Whitney test for nonparametric data and considered significant if less than 0.05. AICDA transcript levels (relative to GAPDH) were plotted against relative STAT3 transcript levels (C) and the frequency of CXCR5+ CD4+ T cells (n = 23) (D). Each dot represents a single subject. The lines on the correlations represent a linear regression curve. The stated r and P values for correlations were calculated using Spearman rank correlation for nonparametric data and considered significant if less than 0.05.

Similar articles

Cited by

References

    1. Binley J, Lybarger E, Crooks E, Seaman M, Gray E, Davis K, Decker J, Wycuff D, Harris L, Hawkins N, Wood B, Nathe C, Richman D, Tomaras G, Bibollet-Ruche F, Robinson J, Morris L, Shaw G, Montefiori D, Mascola J. 2008. Profiling the specificity of neutralizing antibodies in a large panel of plasmas from patients chronically infected with human immunodeficiency virus type 1 subtypes B and C. J. Virol. 82:11651–11668. 10.1128/JVI.01762-08. - DOI - PMC - PubMed
    1. Doria-Rose N, Klein R, Daniels M, O'Dell S, Nason M, Lapedes A, Bhattacharya T, Migueles S, Wyatt R, Korber B, Mascola J, Connors M. 2010. Breadth of human immunodeficiency virus-specific neutralizing activity in sera: clustering analysis and association with clinical variables. J. Virol. 84:1631–1636. 10.1128/JVI.01482-09. - DOI - PMC - PubMed
    1. Nandi A, Lavine C, Wang P, Lipchina I, Goepfert P, Shaw G, Tomaras G, Montefiori D, Haynes B, Easterbrook P, Robinson J, Sodroski J, Yang X. 2010. Epitopes for broad and potent neutralizing antibody responses during chronic infection with human immunodeficiency virus type 1. Virology 396:339–348. 10.1016/j.virol.2009.10.044. - DOI - PMC - PubMed
    1. Sather D, Armann J, Ching L, Mavrantoni A, Sellhorn G, Caldwell Z, Yu X, Wood B, Self S, Kalams S, Stamatatos L. 2009. Factors associated with the development of cross-reactive neutralizing antibodies during human immunodeficiency virus type 1 infection. J. Virol. 83:757–769. 10.1128/JVI.02036-08. - DOI - PMC - PubMed
    1. Simek M, Rida W, Priddy F, Pung P, Carrow E, Laufer D, Lehrman J, Boaz M, Tarragona-Fiol T, Miiro G, Birungi J, Pozniak A, McPhee D, Manigart O, Karita E, Inwoley A, Jaoko W, Dehovitz J, Bekker L, Pitisuttithum P, Paris R, Walker L, Poignard P, Wrin T, Fast P, Burton D, Koff W. 2009. Human immunodeficiency virus type 1 elite neutralizers: individuals with broad and potent neutralizing activity identified by using a high-throughput neutralization assay together with an analytical selection algorithm. J. Virol. 83:7337–7348. 10.1128/JVI.00110-09. - DOI - PMC - PubMed

Publication types

MeSH terms