. 2014 Nov;88(22):13482-94.
doi: 10.1128/JVI.02285-14. Epub 2014 Sep 10.

HBZ stimulates brain-derived neurotrophic factor/TrkB autocrine/paracrine signaling to promote survival of human T-cell leukemia virus type 1-Infected T cells

Affiliations

HBZ stimulates brain-derived neurotrophic factor/TrkB autocrine/paracrine signaling to promote survival of human T-cell leukemia virus type 1-Infected T cells

Nicholas Polakowski et al. J Virol. 2014 Nov.

Abstract

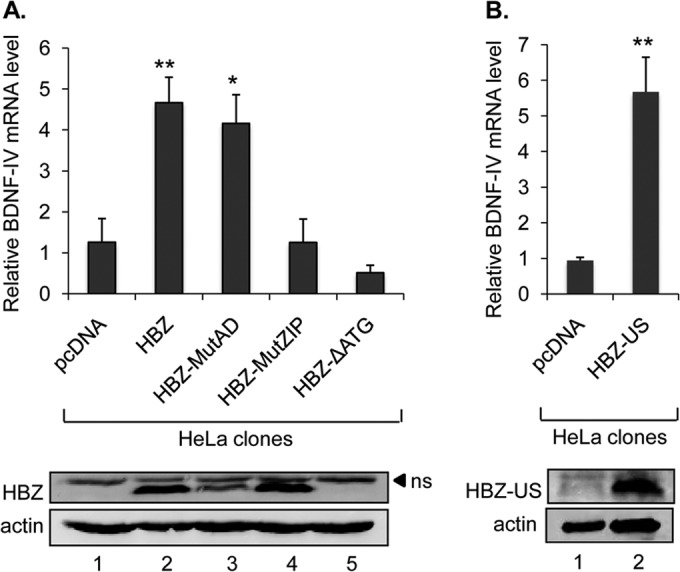
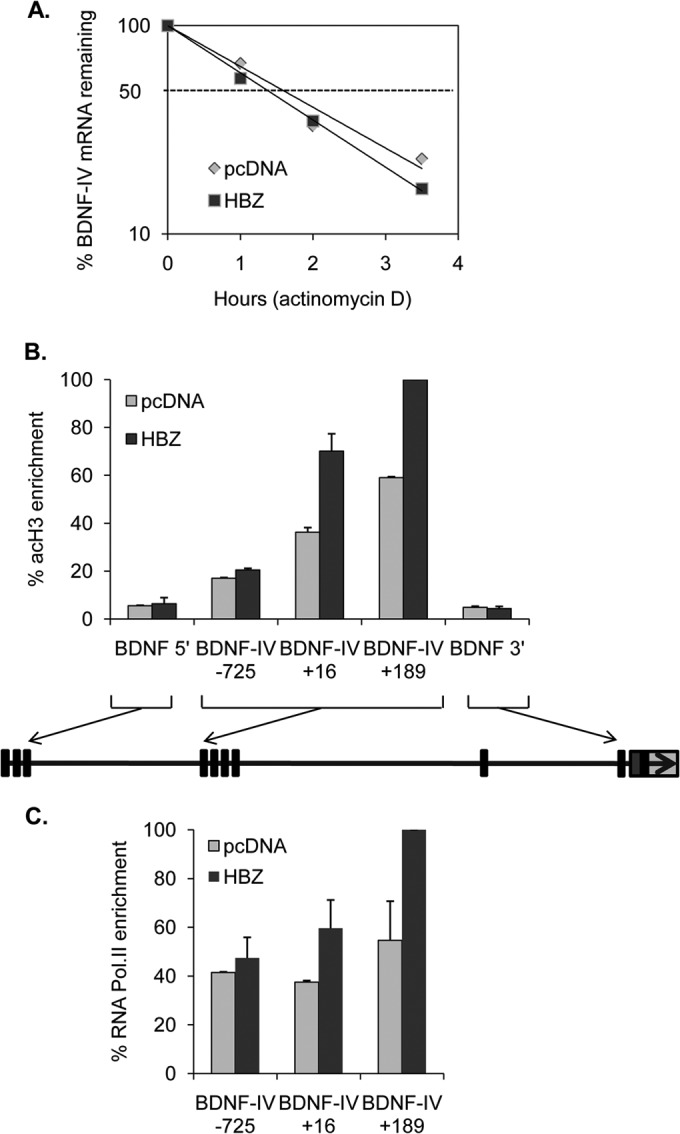
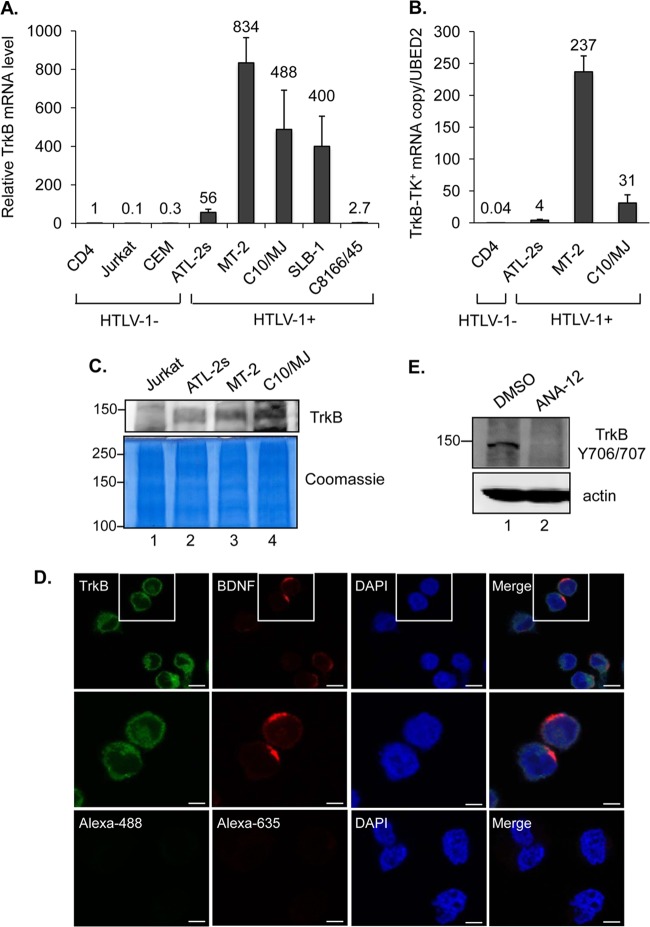
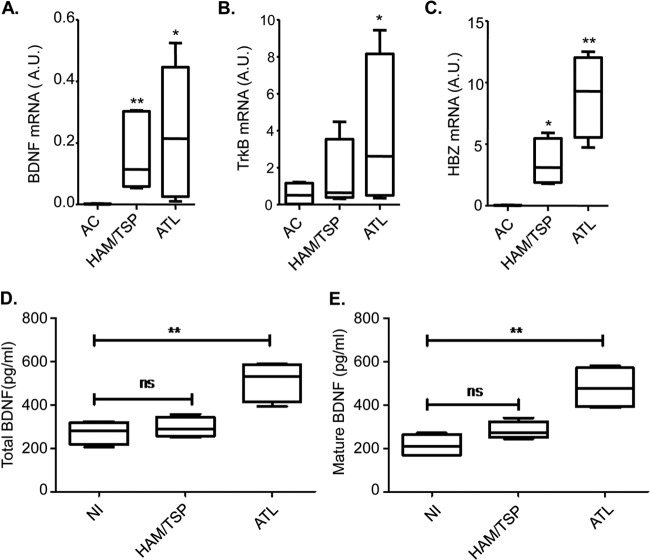
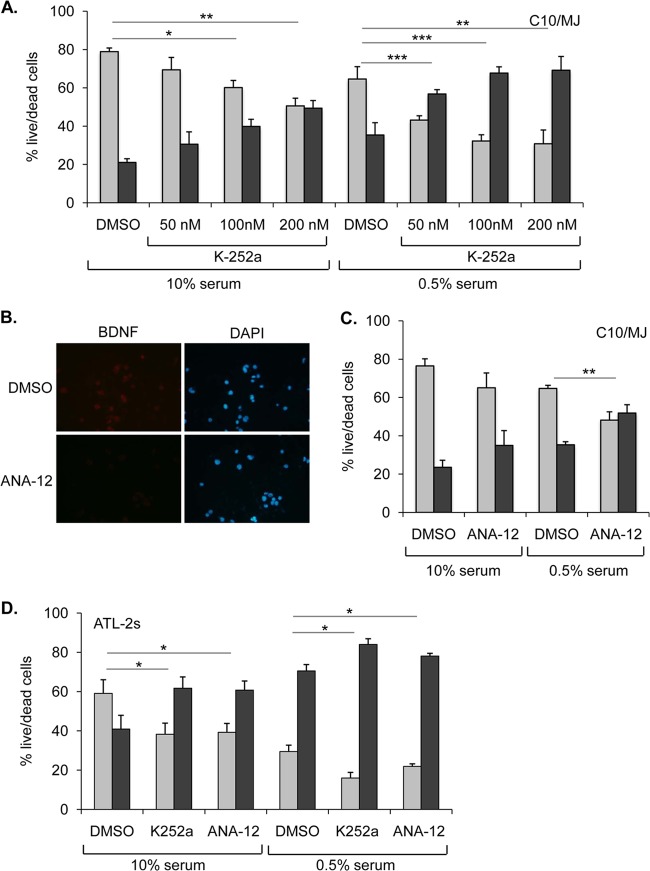
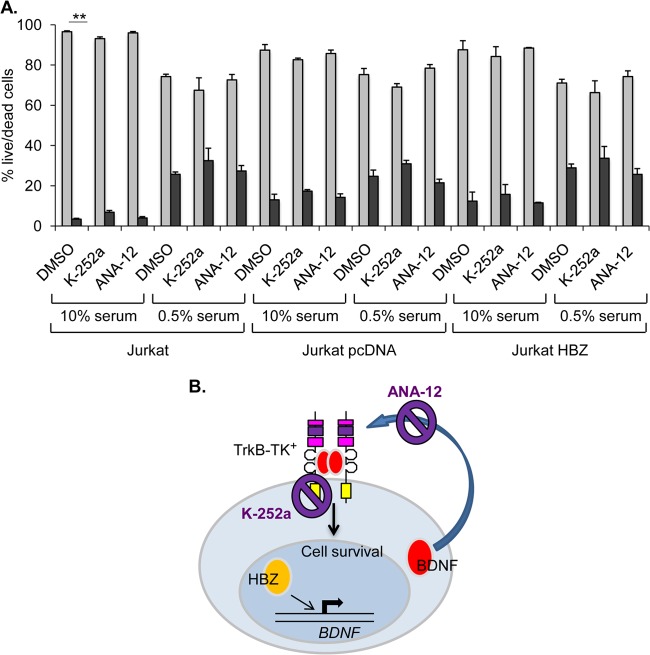
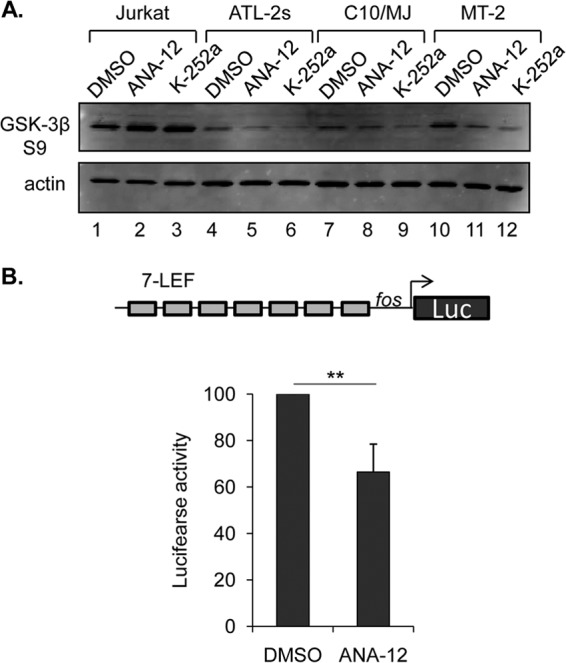
Brain-derived neurotrophic factor (BDNF) is a neurotrophin that promotes neuronal proliferation, survival, and plasticity. These effects occur through autocrine and paracrine signaling events initiated by interactions between secreted BDNF and its high-affinity receptor, TrkB. A BDNF/TrkB autocrine/paracrine signaling loop has additionally been implicated in augmenting the survival of cells representing several human cancers and is associated with poor patient prognosis. Adult T-cell leukemia (ATL) is a fatal malignancy caused by infection with the complex retrovirus human T-cell leukemia virus type 1 (HTLV-1). In this study, we found that the HTLV-1-encoded protein HBZ activates expression of BDNF, and consistent with this effect, BDNF expression is elevated in HTLV-1-infected T-cell lines compared to uninfected T cells. Expression of TrkB is also higher in HTLV-1-infected T-cell lines than in uninfected T cells. Furthermore, levels of both BDNF and TrkB mRNAs are elevated in peripheral blood mononuclear cells (PBMCs) from ATL patients, and ATL patient sera contain higher concentrations of BDNF than sera from noninfected individuals. Finally, chemical inhibition of TrkB signaling increases apoptosis in HTLV-1-infected T cells and reduces phosphorylation of glycogen synthase kinase 3β (GSK-3β), a downstream target in the signaling pathway. These results suggest that HBZ contributes to an active BDNF/TrkB autocrine/paracrine signaling loop in HTLV-1-infected T cells that enhances the survival of these cells.

Importance: Infection with human T-cell leukemia virus type 1 (HTLV-1) can cause a rare form of leukemia designated adult T-cell leukemia (ATL). Because ATL patients are unresponsive to chemotherapy, this malignancy is fatal. As a retrovirus, HTLV-1 integrates its genome into a host cell chromosome in order to utilize host factors for replication and expression of viral proteins. However, in infected cells from ATL patients, the viral genome is frequently modified to block expression of all but a single viral protein. This protein, known as HBZ, is therefore believed to modulate cellular pathways necessary for the leukemic state and the chemotherapeutic resistance of the cell. Here we provide evidence to support this hypothesis. We found that HBZ promotes a BDNF/TrkB autocrine/paracrine signaling pathway that is known to enhance the survival and chemotherapeutic resistance of other types of cancer cells. It is possible that inhibition of this pathway may improve treatments for ATL.


Figures

FIG 1
FIG 1
HBZ upregulates BDNF expression. (A) BDNF expression in Jurkat clonal cell lines stably expressing HBZ-S1 or carrying the empty vector. RT-PCR was performed using cDNAs prepared with gene-specific primers for BDNF, UBE2D2, and HBZ. (B) BDNF expression in uninfected and HTLV-1-infected T-cell lines. The upper panel shows levels of BDNF and UBE2D2 mRNAs analyzed by RT-PCR. RT-PCR was performed using cDNAs prepared with gene-specific primers for BDNF and UBE2D2. The lower panel shows the numbers of copies of HBZ mRNA per copy of UBE2D2 mRNA in the cell lines. cDNAs were prepared using gene-specific primers for HBZ and UBE2D2 for quantitative real-time PCR. The graph shows data obtained with RNAs identical to those used for the upper panel. (C) Western blot detection of BDNF in culture media of uninfected and HTLV-1-infected T-cell lines. The membrane in the upper panel was probed with a BDNF antibody. The lower panel shows the membrane stained with Ponceau S. (D) Western blot quantification of secreted mature and pro-BDNF from three independent experiments. Band densities were quantified using ImageQuant TL (GE Healthcare) and adjusted to the percentage of total mature and pro-BDNF (set to 100%). (E) Western blot detection of HBZ in HTLV-1-infected T-cell lines. The membrane in the upper panel was probed with an HBZ antibody. The lower panel shows the membrane stained with Ponceau S. No WCE, no whole-cell extract. (F) BDNF and HBZ expression in MT-2 cells transduced with negative-control (V1) and HBZ (V2) shRNA lentiviral vectors. The graph shows real-time PCR data from two independent transfection assays, with values normalized to that for V1 (set to 1).
FIG 2
FIG 2
The ZIP domain of HBZ is required for transcriptional activation of BDNF. (A and B) BDNF expression in HeLa clonal cell lines containing the indicated expression vectors (HBZ-S1 wild type and mutants and HBZ-US wild type). The graphs show results from real-time PCR amplification of BDNF normalized to amplification of UBE2D2. Values correspond to three independent experiments and were calculated relative to one data set for cells with pcDNA3.1 alone. Error bars show standard deviations. *, P < 0.05; **, P < 0.005 (two-tailed Student t test). Lower panels show Western blots of whole-cell extracts prepared from cell lines corresponding to those listed above. Membranes were probed with a Myc antibody for detection of epitope-tagged HBZ and then stripped and probed for actin. ns, nonspecific band.
FIG 3
FIG 3
HBZ activates the promoter of BDNF-IV. (A) BDNF mRNA stability in HeLa clonal cell lines expressing HBZ-S1 or carrying the empty vector. The graph shows real-time PCR analysis of cDNA prepared from actinomycin D-treated cells for the indicated times, normalizing BDNF amplification to β-actin amplification. BDNF mRNA levels were set to 100% at 0 h for both cell lines, and data were averaged from two independent experiments. (B) Levels of histone H3 acetylation (acH3) enrichment over that of the BDNF gene in cells expressing HBZ-S1 or carrying the empty vector. ChIP assays were performed using an antibody directed against acH3, and relative levels of acH3 at the indicated sites were normalized to 1% of the input DNA following quantitative real-time PCR and graphed with respect to the highest level of enrichment (set to 100%). The graph shows data averaged from two independent ChIP assays. The diagram depicts the >67-kb gene, with exons indicated as rectangles. (C) Levels of RNA polymerase II (Pol.II) enrichment over that in the BDNF-IV region in cells expressing HBZ-S1 or carrying the empty vector, with data averaged from two independent ChIP assays. The middle of each amplicon is indicated with respect to the BDNF-IV transcription start site.
FIG 4
FIG 4
HTLV-1-infected T cells express TrkB. (A) Total expression of all TrkB variants in uninfected and HTLV-1-infected T cells. The graph shows real-time PCR results as described in the legend to Fig. 2A, obtained using TrkB primers. Values correspond to three independent experiments and were calculated relative to data for the CD4+ cells (set to 1). (B) Expression of TrkB variants containing the tyrosine kinase domain (TrkB-TK+) in CD4+ and HTLV-1-infected T cells. The graph shows TrkB-TK+ mRNA copy numbers normalized to one copy of UBE2D2 mRNA. Values correspond to two independent experiments. (C) Expression of the full-length TrkB protein in HTLV-1-infected cells. Western blot analysis was performed to detect TrkB in total membrane preparations from Jurkat cells and HTLV-1-infected T-cell lines. The membrane in the upper panel was probed with a TrkB antibody. The lower panel shows the same samples stained with Coomassie blue. (D) Colocalization of TrkB and BDNF on the surfaces of HTLV-1-infected C10/MJ cells. Cells were analyzed by indirect immunofluorescence microscopy (magnification, ×40; Zeiss LSM 700 microscope) using TrkB and BDNF antibodies or with secondary antibodies alone (lower panels). Nuclei were stained with DAPI. Bars, 10 μm (upper panels) and 5 μm (middle and lower panels). (E) Western blot detection of phosphorylated TrkB in C10/MJ cells treated with DMSO or the TrkB antagonist ANA-12 (20 μM) prior to preparation of whole-cell extracts. The membrane in the upper panel was probed with a phosphorylation-specific TrkB antibody. The lower panel shows the same membrane stripped and reprobed with an actin antibody.
FIG 5
FIG 5
Comparison of BDNF and TrkB expression among samples from HAM/TSP and ATL patients and asymptomatic carriers. Box plots show mRNA levels of BDNF (A), TrkB (B), and HBZ (C), expressed in arbitrary units (A.U.), in CD8+-depleted PBMCs from asymptomatic carriers (AC) and HAM/TSP and ATL patients following 5 days of culture (4 samples per group). Horizontal lines from the bottom to the top of each plot show the minimum value, the 25th percentile, the median, the 75th percentile, and the maximum value. *, P < 0.05; **, P < 0.005 (two-tailed Student t test). The TrkB and BDNF primers used for real-time PCR amplified all transcript variants. (D and E) BDNF concentrations in acid-treated (D) and untreated (E) specimens. Box plots show ELISA results for sera from noninfected individuals (NI) and HAM/TSP and ATL patients (4 samples per group), using the same plot indices as those described above.
FIG 6
FIG 6
Inhibition of TrkB signaling induces death of HTLV-1-infected cells. (A) C10/MJ cell survival following K-252a treatment. The graph shows ratios of live (light gray bars) to dead (dark gray bars) cells (transformed to 100% total cells) following the indicated culture conditions and treatments. Values are the mean data from three or more independent experiments, with error bars denoting standard deviations. *, P < 0.05; **, P < 0.01; ***, P < 0.0005 (two-tailed Student t test). (B) ANA-12 reduces binding of BDNF antibody to the surfaces of C10/MJ cells. Cells were seeded on coverslips in the presence of ANA-12 or DMSO and analyzed by indirect immunofluorescence microscopy (magnification, ×40; Nikon Eclipse E600 microscope) using a BDNF antibody. Nuclei were stained with DAPI. (C) C10/MJ cell survival following ANA-12 (20 μM) treatment. The graph shows ratios of live to dead cells as detailed above. Values are the mean data from three independent experiments, with error bars denoting standard deviations. **, P < 0.01 (two-tailed Student t test). (D) ATL-2s cell survival following K-252a (100 nM) and ANA-12 (20 μM) treatment. The graph shows ratios of live to dead cells as detailed above. Values are the mean data from three independent experiments, with error bars denoting standard deviations. *, P < 0.01 (two-tailed Student t test).
FIG 7
FIG 7
Cell survival of Jurkat cells and Jurkat clones following K-252a and ANA-12 treatment. (A) Jurkat-pcDNA and Jurkat-HBZ cell survival following K-252a (100 nM) or ANA-12 (20 μM) treatment. The graph shows ratios of live (light gray bars) to dead (dark gray bars) cells (transformed to 100% total cells) following the indicated culture conditions and treatments. Values are the mean data from three independent experiments, with error bars denoting standard deviations. **, P < 0.01 (two-tailed Student t test). (B) Schematic showing the modes of inhibition of BDNF/TrkB signaling by K-252a and ANA-12.
FIG 8
FIG 8
Inhibition of BDNF/TrkB signaling decreases downstream phosphorylation of GSK-3β. (A) The Western blot in the upper panel shows detection of serine 9 phosphorylation of GSK-3β in the indicated cell lines treated with DMSO, ANA-12 (20 μM), or K-252a (100 nM). Cells were cultured with 0.5% FBS for 24 h and then received the indicated drug treatments for 6 h. The lower panel shows the same membrane stripped and then probed for actin. (B) ANA-12 treatment restores GSK-3β activity. C10/MJ cells were transfected with p7LEF-Fos-Luc and pRL-SV40-Luc (internal standard), cultured in 0.5% serum, and treated with DMSO or 20 μM ANA-12. The graph shows data from four independent transfection assays, with values showing the average luminescence normalized to that of the DMSO treatment (set to 100). **, P < 0.005 (two-tailed Student t test).

References

    1. Proietti FA, Carneiro-Proietti AB, Catalan-Soares BC, Murphy EL. 2005. Global epidemiology of HTLV-I infection and associated diseases. Oncogene 24:6058–6068. 10.1038/sj.onc.1208968. - DOI - PubMed
    1. Iwanaga M, Watanabe T, Yamaguchi K. 2012. Adult T-cell leukemia: a review of epidemiological evidence. Front. Microbiol. 3:322. 10.3389/fmicb.2012.00322. - DOI - PMC - PubMed
    1. Fields PA, Taylor GP. 2012. “Antivirals” in the treatment of adult T cell leukaemia-lymphoma (ATLL). Curr. Hematol. Malig. Rep. 7:267–275. 10.1007/s11899-012-0139-9. - DOI - PubMed
    1. Marriott SJ, Semmes OJ. 2005. Impact of HTLV-I Tax on cell cycle progression and the cellular DNA damage repair response. Oncogene 24:5986–5995. 10.1038/sj.onc.1208976. - DOI - PubMed
    1. Takeda S, Maeda M, Morikawa S, Taniguchi Y, Yasunaga J, Nosaka K, Tanaka Y, Matsuoka M. 2004. Genetic and epigenetic inactivation of tax gene in adult T-cell leukemia cells. Int. J. Cancer 109:559–567. 10.1002/ijc.20007. - DOI - PubMed

Publication types

MeSH terms

Substances