

Time-dependent Gene Profiling Indicates the Presence of Different Phases for Ischemia/Reperfusion Injury in Retina
- PMID: 25210480
- PMCID: PMC4149383
- DOI: 10.4137/OED.S17671
Time-dependent Gene Profiling Indicates the Presence of Different Phases for Ischemia/Reperfusion Injury in Retina
Abstract
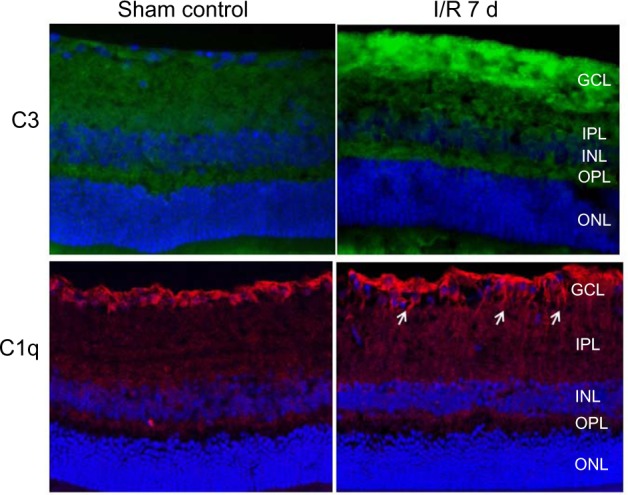
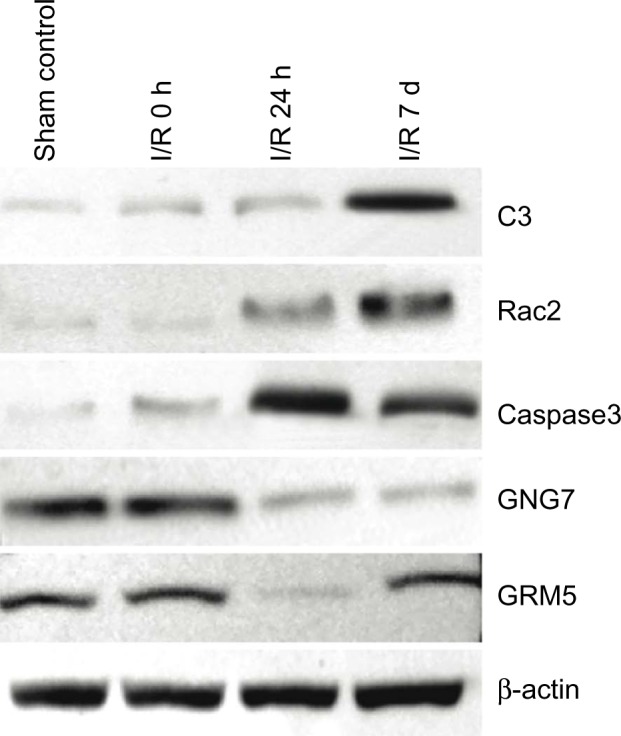
Ischemia/reperfusion (IR) injury has been associated with several retinal pathologies, and a few genes/gene products have been linked to IR injury. However, the big picture of temporal changes, regarding the affected gene networks, pathways, and processes remains to be determined. The purpose of the present study was to investigate initial, intermediate, and later stages to characterize the etiology of IR injury in terms of the pathways affected over time. Analyses indicated that at the initial stage, 0-hour reperfusion following the ischemic period, the ischemia-associated genes were related to changes in metabolism. In contrast, at the 24-hour time point, the signature events in reperfusion injury include enhanced inflammatory and immune responses as well as cell death indicating that this would be a critical period for the development of any interventional therapeutic strategies. Genes in the signal transduction pathways, particularly transmitter receptors, are downregulated at this time. Activation of the complement system pathway clearly plays an important role in the later stages of reperfusion injury. Together, these results demonstrate that the etiology of injury related to IR is characterized by the appearance of specific patterns of gene expression at any given time point during retinal IR injury. These results indicate that evaluation of treatment strategies with respect to time is very critical.
Keywords: gene expression; ischemia/reperfusion (IR) injury; microarray; retina.
Figures
Similar articles
-
RNA-Seq identifies condition-specific biological signatures of ischemia-reperfusion injury in the human kidney.BMC Nephrol. 2020 Sep 25;21(Suppl 1):398. doi: 10.1186/s12882-020-02025-y. BMC Nephrol. 2020. PMID: 32977749 Free PMC article.
-
Ischemia-reperfusion injury of the retina is linked to necroptosis via the ERK1/2-RIP3 pathway.Mol Vis. 2014 Sep 24;20:1374-87. eCollection 2014. Mol Vis. 2014. PMID: 25352744 Free PMC article.
-
Retinal ischemia/reperfusion injury is mediated by Toll-like receptor 4 activation of NLRP3 inflammasomes.Invest Ophthalmol Vis Sci. 2014 Aug 5;55(9):5466-75. doi: 10.1167/iovs.14-14380. Invest Ophthalmol Vis Sci. 2014. PMID: 25097240
-
Cellular Stress Response and Immune Signaling in Retinal Ischemia-Reperfusion Injury.Front Immunol. 2016 Oct 24;7:444. doi: 10.3389/fimmu.2016.00444. eCollection 2016. Front Immunol. 2016. PMID: 27822213 Free PMC article. Review.
-
Signal transduction mechanisms in the ischemic and reperfused myocardium.EXS. 1996;76:191-207. doi: 10.1007/978-3-0348-8988-9_12. EXS. 1996. PMID: 8805796 Review.
Cited by
-
Reduced folate carrier 1 is present in retinal microvessels and crucial for the inner blood retinal barrier integrity.Fluids Barriers CNS. 2023 Jun 16;20(1):47. doi: 10.1186/s12987-023-00442-3. Fluids Barriers CNS. 2023. PMID: 37328777 Free PMC article.
-
Ischemia-Triggered Glutamate Excitotoxicity From the Perspective of Glial Cells.Front Cell Neurosci. 2020 Mar 19;14:51. doi: 10.3389/fncel.2020.00051. eCollection 2020. Front Cell Neurosci. 2020. PMID: 32265656 Free PMC article.
-
Genomewide Association Study of Retinal Traits in the Amish Reveals Loci Influencing Drusen Development and Link to Age-Related Macular Degeneration.Invest Ophthalmol Vis Sci. 2022 Jul 8;63(8):17. doi: 10.1167/iovs.63.8.17. Invest Ophthalmol Vis Sci. 2022. PMID: 35857289 Free PMC article.
-
From Gut to Brain: Unraveling the Intricate Link Between Microbiome and Stroke.Probiotics Antimicrob Proteins. 2024 Dec;16(6):2039-2053. doi: 10.1007/s12602-024-10295-3. Epub 2024 Jun 3. Probiotics Antimicrob Proteins. 2024. PMID: 38831225 Review.
-
Key immune regulators in retinal ischemia-reperfusion injury via RNA sequencing.Int J Ophthalmol. 2025 Jul 18;18(7):1237-1251. doi: 10.18240/ijo.2025.07.06. eCollection 2025. Int J Ophthalmol. 2025. PMID: 40688775 Free PMC article.
References
-
- Osborne NN, Ugarte M, Chao M, et al. Neuroprotection in relation to retinal ischemia and relevance to glaucoma. Surv Ophthalmol. 1999;43(suppl 1):S102–28. - PubMed
-
- Penn JS, Tolman BL, Henry MM. Oxygen-induced retinopathy in the rat: relationship of retinal nonperfusion to subsequent neovascularization. Invest Ophthalmol Vis Sci. 1994;35:3429–35. - PubMed
-
- Schmidt D, Bohringer D. Preserved vision despite distinct retinal edema in central retinal artery occlusion. Eur J Med Res. 2006;11:43–5. - PubMed
-
- Sun MH, Pang JH, Chen SL, et al. Retinal protection from acute glaucoma-induced ischemia-reperfusion injury through pharmacologic induction of heme oxygenase-1. Invest Ophthalmol Vis Sci. 2010;51:4798–808. - PubMed
-
- Zhang Y, Cho CH, Atchaneeyasakul LO, McFarland T, Appukuttan B, Stout JT. Activation of the mitochondrial apoptotic pathway in a rat model of central retinal artery occlusion. Invest Ophthalmol Vis Sci. 2005;46:2133–9. - PubMed
Grants and funding
LinkOut - more resources
Full Text Sources
Other Literature Sources
Molecular Biology Databases
