. 2014 Jul 30:3:176.
doi: 10.12688/f1000research.4263.2. eCollection 2014.

Sub-strains of Drosophila Canton-S differ markedly in their locomotor behavior

Affiliations

Sub-strains of Drosophila Canton-S differ markedly in their locomotor behavior

Julien Colomb et al. F1000Res. .

Abstract

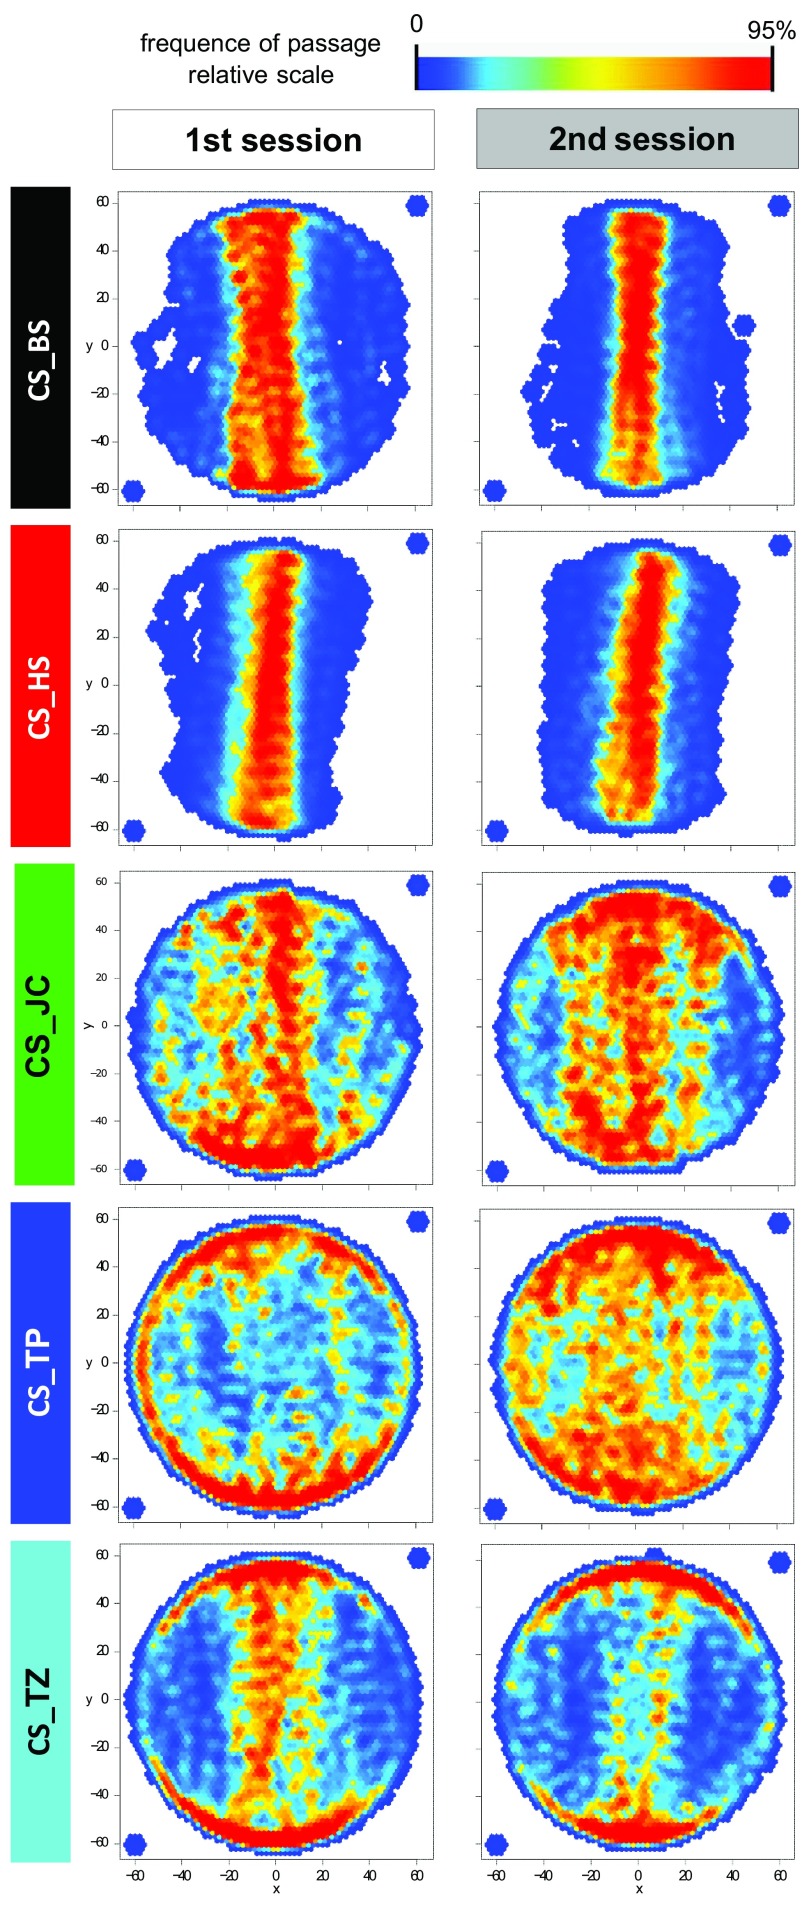
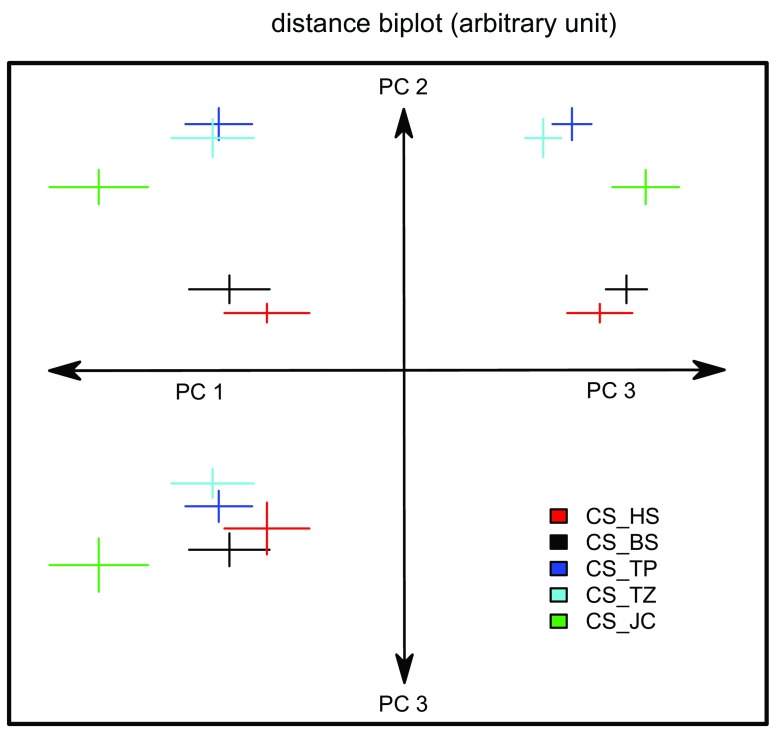
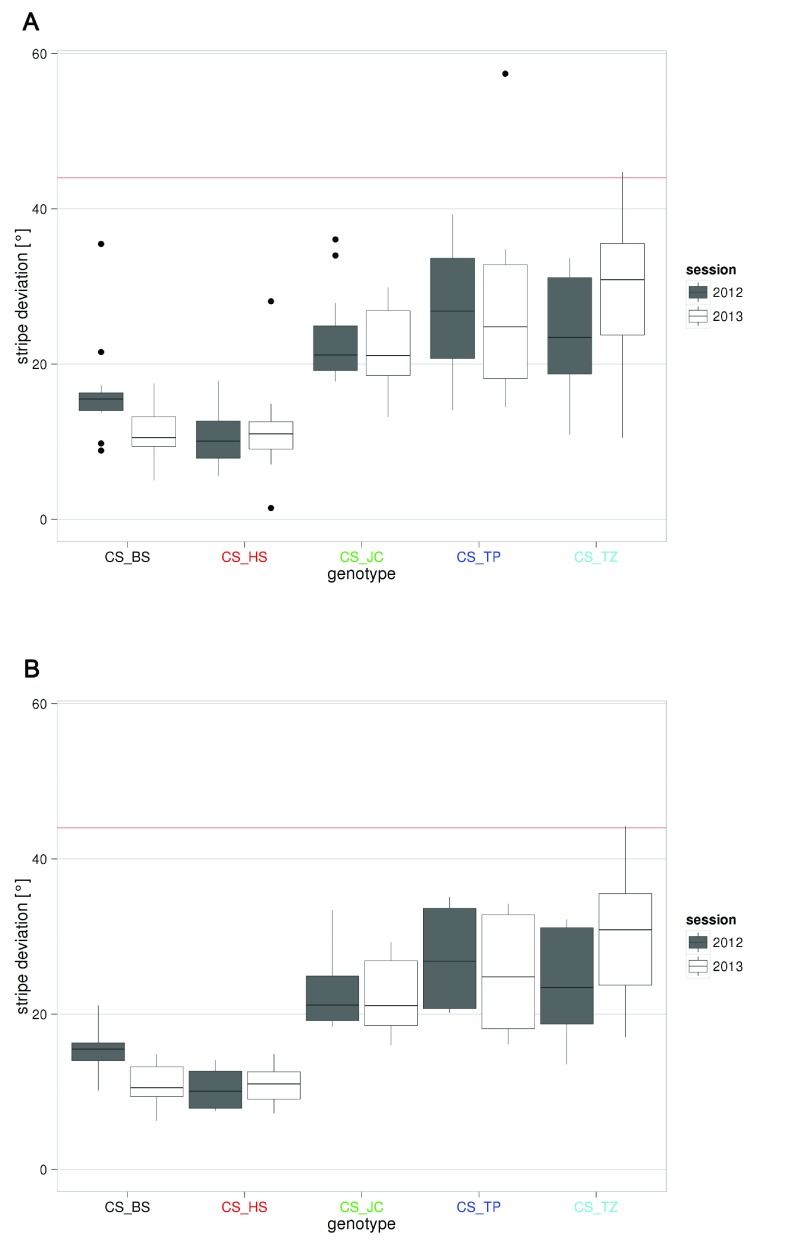
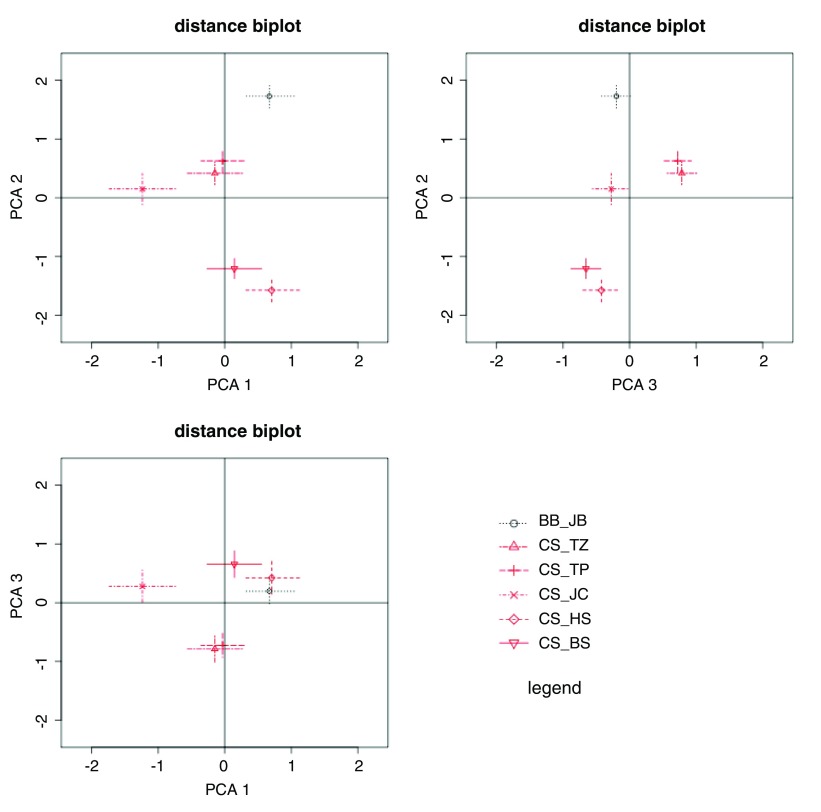
We collected five sub-strains of the standard laboratory wild-type Drosophilamelanogaster Canton Special (CS) and analyzed their walking behavior in Buridan's paradigm using the CeTrAn software. According to twelve different aspects of their behavior, the sub-strains fit into three groups. The group separation appeared not to be correlated with the origin of the stocks. We conclude that founder effects but not laboratory selection likely influenced the gene pool of the sub-strains. The flies' stripe fixation was the parameter that varied most. Our results suggest that differences in the genome of laboratory stocks can render comparisons between nominally identical wild-type stocks meaningless. A single source for control strains may settle this problem.

Keywords: Buridan's paradigm; Genetic background; walking behavior; wild-type.


Conflict of interest statement

Competing interests: No competing interests were disclosed.

Figures

Figure 1.
Figure 1.. In transition plots, the behavior of each sub-strain looks different from the other strains and similar between the two experimental sessions.
Transition plots represent the position of the fly on the platform, excluding the time when the fly was immobile. The scale is proportional, with red points meaning that the number of times the fly was in that position is at least 95% of the maximal score obtained for any position. A Gaussian smooth was applied to the resulting heat map. The two points outside the platform were added manually to assure orthogonal axes of the representation. Sample size is 11–12 for each plot.
Figure 2.
Figure 2.. The CS sub-strains can be separated into three groups according to their overall behavior in Buridan’s paradigm.
A PCA was performed over the 12 measured variables capturing the flies’ locomotion. The three first principal components are plotted against each other: from the center of the axes; PC1 to the left, PC2 up and PC3 down and to the right. Since units are arbitrary, they were not indicated. For each genotype, we represent the mean and standard error of the mean for the different PCs as a colored cross (data from the two replicates were pooled). The three groups are best visualized separately on the PC2-PC3 plot (upper-right), while PC2 is sufficient to separate the three groups statistically (see text). Sample size for each group is 23–28.
Figure 3.
Figure 3.. The different sub-strains show a large spectrum of values for the stripe deviation parameter.
For every movement of the fly, the angle between its direction and the direction toward the stripes was calculated. The median of these angles was calculated for each fly, representing a quantification of stripe fixation by the fly. The value of each sub-strain in each session is depicted in boxplots: for each group, we represent the median, 25–75% quantiles and the total spread of the values (excluding outliers) as line, box and whiskers, respectively. The version of this figure on the F1000Research website is interactive; readers can define the type of whiskers displayed as either Tukey whiskers (1.5 x IQR from 1 st/3 rd quartile; A) or the 10 th–90 th percentiles ( B). The text color code used for the genotypes is analogous to that used in Figure 2. The red horizontal line corresponds to the median value for random walks: 44°. Sample size is 11–12 for each boxplot. No statistical analysis was performed.
Figure 4.
Figure 4.. Updating principal component analysis of Canton S strains.
Results from the PCA obtained using the same analysis as for Figure 2, but with data uploaded from different laboratories. The version of this figure on the F1000Research site is ‘living’; it will automatically re-plot as and when new data for other Canton S strains are submitted, and users can visualize previous versions of this figure. The conclusions of this article only relate to the data available at the time of publication. The prefixes in the key are the initials of the data contributor (except CS_ strains, which were tested by Julien Colomb); full names and affiliations can be found in the figure legend of the article on the F1000Research site. The suffixes denote the initials of the principal investigators from where each sub-strain was sourced. The BB_JB (Jose Botella) strain was ordered from the Bloomington stock center (stock #1) approx. seven years ago. BB_JB falls within the range of variability seen so far, but does not appear to clearly group with any of the previously measured strains. Instructions for adding data: Click the ‘Submit New Data’ button to the left of the figure on the online version of article and fill in the fields on the form (user registration may be required). 'Uploader Name' should be “First name, Last name”; 'Uploader Lab Address' should be “Department, University, Country”. For 'Genotype', use the initials of the principal investigator of the lab from where the strain originated (this will typically be the initials of the uploader). The data should be uploaded as one metadata and one data file for each fly (click links for template examples). Only one CS strain per lab should be uploaded. Please email BB for additional details on contributing data to this figure.

References

    1. Stern C, Schaeffer EW: On primary attributes of alleles in Drosophila melanogaster. Proc Natl Acad Sci U S A. 1943;29(11):351–61. 10.1073/pnas.29.11.351 - DOI - PMC - PubMed
    1. Benzer S: Behavioral mutants of Drosophila isolated by countercurrent distribution. Proc Natl Acad Sci U S A. 1967;58(3):1112–9. 10.1073/pnas.58.3.1112 - DOI - PMC - PubMed
    1. Crawley JN, Belknap JK, Collins A, et al. : Behavioral phenotypes of inbred mouse strains: implications and recommendations for molecular studies. Psychopharmacology (Berl). 1997;132(2):107–24. 10.1007/s002130050327 - DOI - PubMed
    1. Paylor R, Crawley JN: Inbred strain differences in prepulse inhibition of the mouse startle response. Psychopharmacology (Berl). 1997;132(2):169–80. 10.1007/s002130050333 - DOI - PubMed
    1. Gems D, Riddle DL: Defining wild-type life span in Caenorhabditis elegans. J Gerontol A Biol Sci Med Sci. 2000;55(5):B215–9. 10.1093/gerona/55.5.B215 - DOI - PubMed

LinkOut - more resources