

A model for a chikungunya outbreak in a rural Cambodian setting: implications for disease control in uninfected areas
- PMID: 25210729
- PMCID: PMC4161325
- DOI: 10.1371/journal.pntd.0003120
A model for a chikungunya outbreak in a rural Cambodian setting: implications for disease control in uninfected areas
Abstract
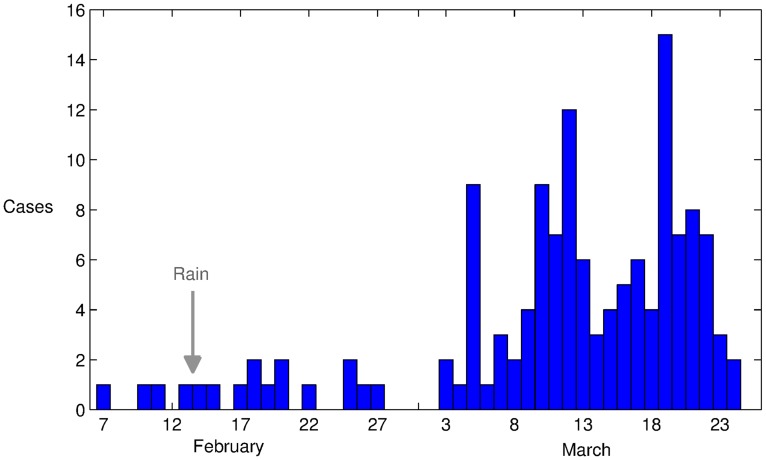
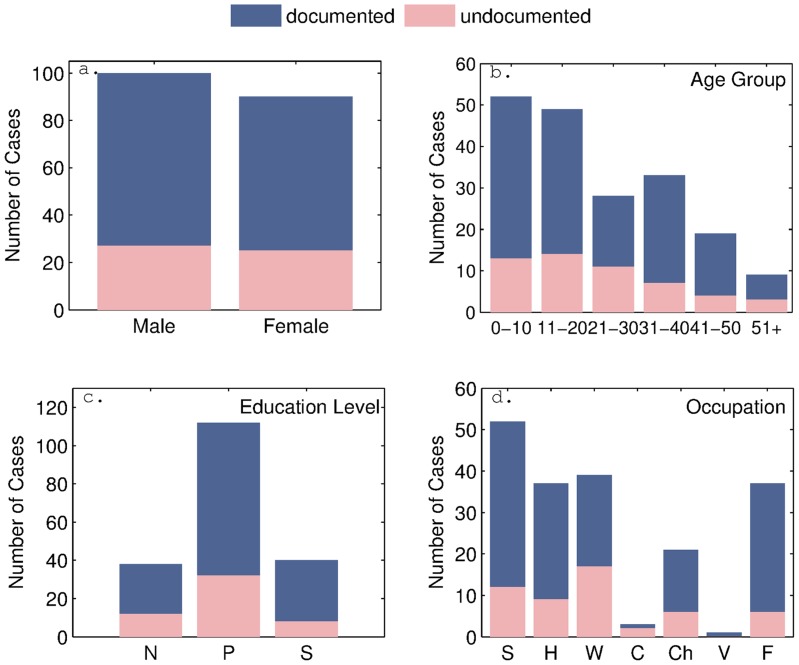
Following almost 30 years of relative silence, chikungunya fever reemerged in Kenya in 2004. It subsequently spread to the islands of the Indian Ocean, reaching Southeast Asia in 2006. The virus was first detected in Cambodia in 2011 and a large outbreak occurred in the village of Trapeang Roka Kampong Speu Province in March 2012, in which 44% of the villagers had a recent infection biologically confirmed. The epidemic curve was constructed from the number of biologically-confirmed CHIKV cases per day determined from the date of fever onset, which was self-reported during a data collection campaign conducted in the village after the outbreak. All individuals participating in the campaign had infections confirmed by laboratory analysis, allowing for the identification of asymptomatic cases and those with an unreported date of fever onset. We develop a stochastic model explicitly including such cases, all of whom do not appear on the epidemic curve. We estimate the basic reproduction number of the outbreak to be 6.46 (95% C.I. [6.24, 6.78]). We show that this estimate is particularly sensitive to changes in the biting rate and mosquito longevity. Our model also indicates that the infection was more widespread within the population on the reported epidemic start date. We show that the exclusion of asymptomatic cases and cases with undocumented onset dates can lead to an underestimation of the reproduction number which, in turn, could negatively impact control strategies implemented by public health authorities. We highlight the need for properly documenting newly emerging pathogens in immunologically naive populations and the importance of identifying the route of disease introduction.
Conflict of interest statement
The authors have declared that no competing interests exist.
Figures
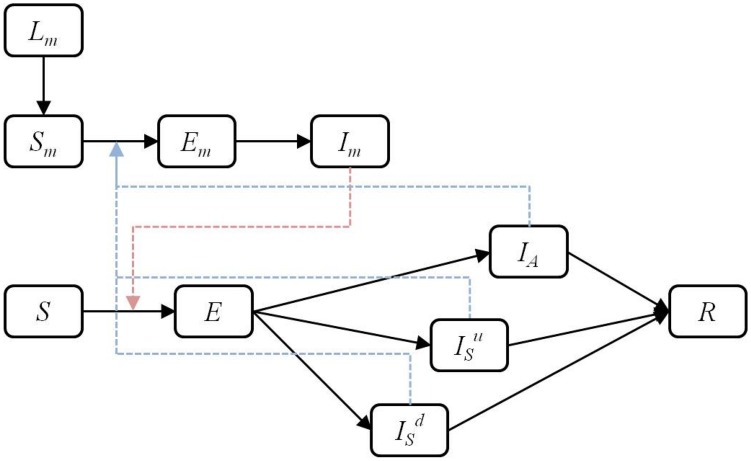
 ) can be infected by a symptomatic human documented by date of onset (
 ), a symptomatic human undocumented by date of onset (
 ) or an asymptomatic (
 ) human (dashed blue arrow). A susceptible human (
 ) can be infected by an infected mosquito (
 ) (dashed red arrow).
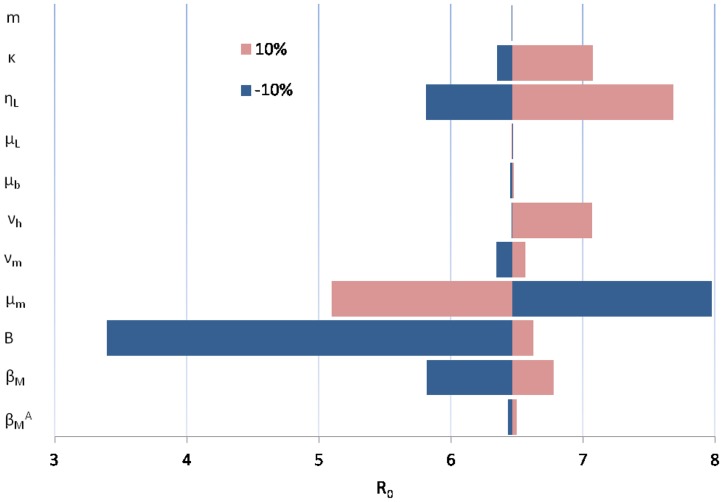
 . Each bar is a representation of how uncertainty in that particular parameter affects the estimate of the reproduction number. The baseline scenario is fixed with
  .
.References
-
- Pialoux G, Gaüzère BA, Jauréguiberry S, Strobel M (2007) Chikungunya, an epidemic arbovirosis. Lancet Infect Dis 7: 319–327. - PubMed
-
- Robinson MC (1955) An epidemic of virus disease in Southern Province, Tanganyika territory, in 1952–1953. Trans R Soc Trop Med Hyg 49: 28–32. - PubMed
-
- Powers AM, Logue CH (2007) Changing patterns of chikungunya virus: re-emergence of a zoonotic arbovirus. J Gen Virol 88: 2363–2377. - PubMed
-
- Chhabra M, Mittal V, Bhattacharya D, Rana UVS, Lal S (2008) Chikungunya fever: a re-emerging viral infection. Indian J Med Microbiol 26: 5. - PubMed
Publication types
MeSH terms
LinkOut - more resources
Full Text Sources
Other Literature Sources
Medical
