

Optimization of mucosal responses after intramuscular immunization with integrase defective lentiviral vector
- PMID: 25210766
- PMCID: PMC4161417
- DOI: 10.1371/journal.pone.0107377
Optimization of mucosal responses after intramuscular immunization with integrase defective lentiviral vector
Abstract
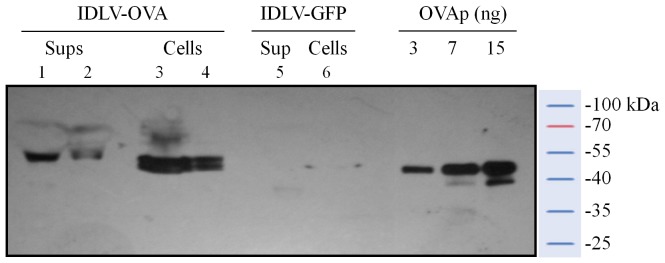
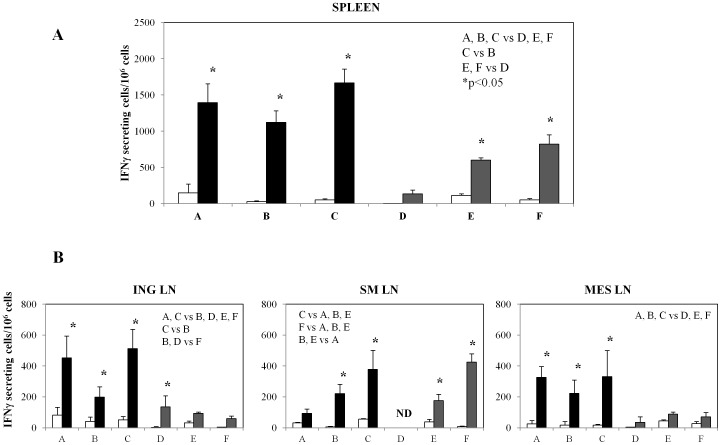
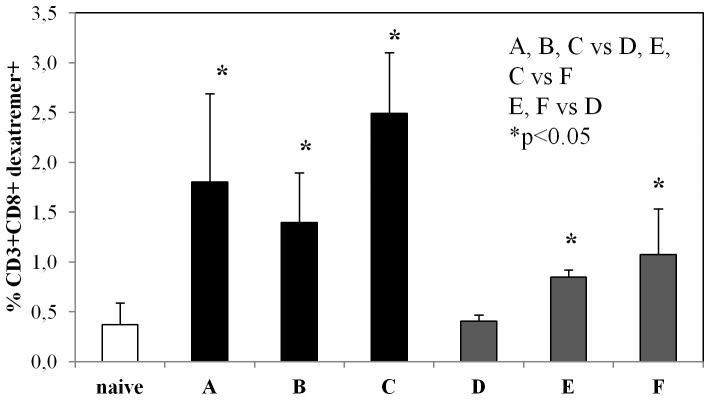
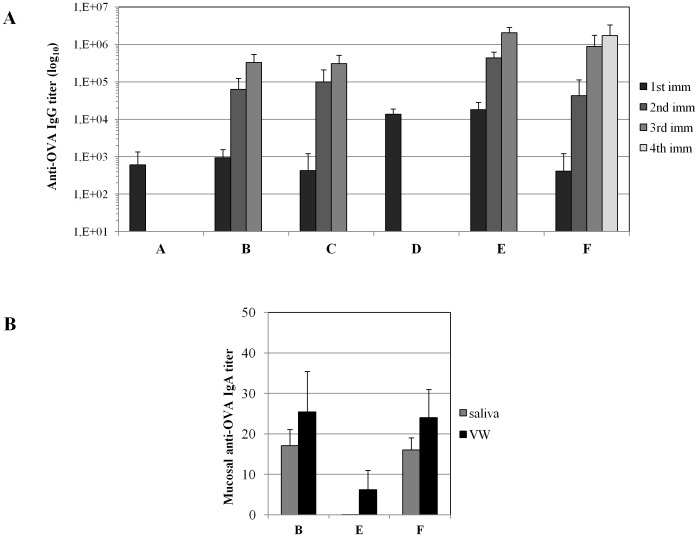
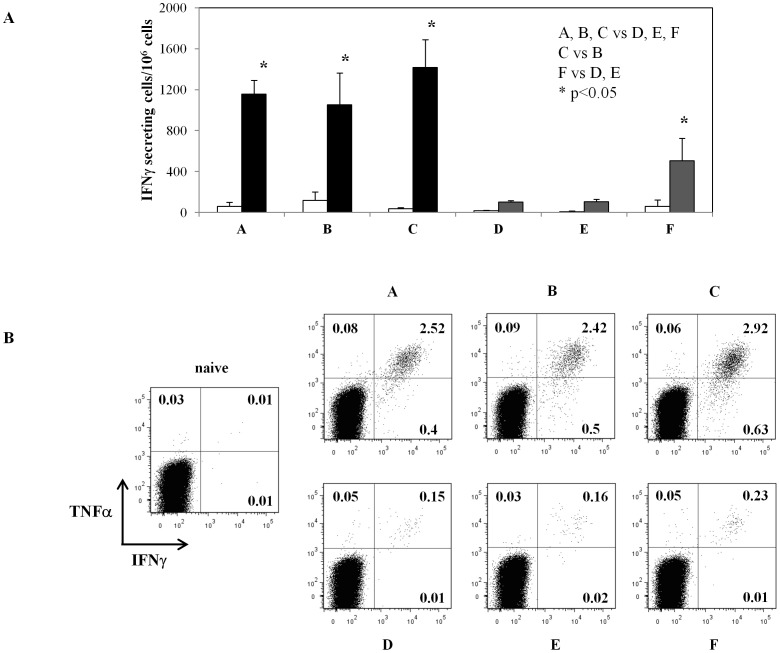
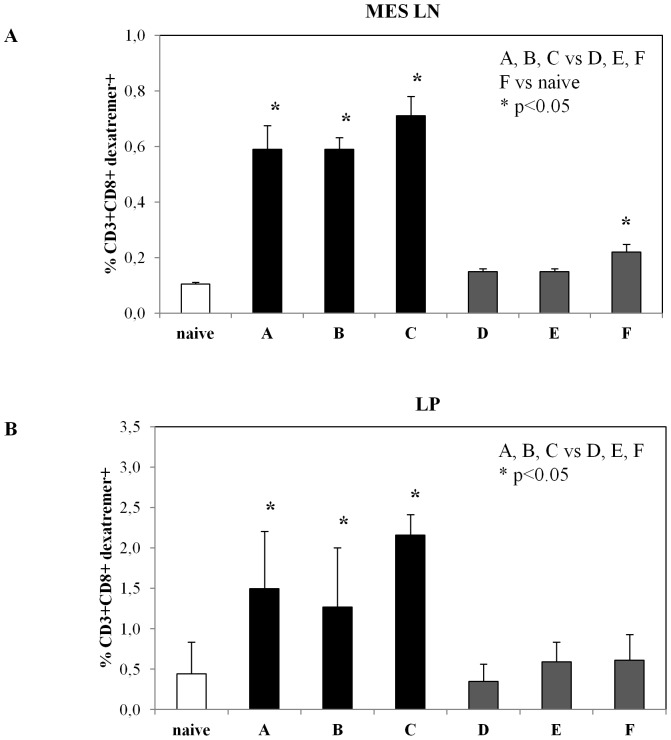
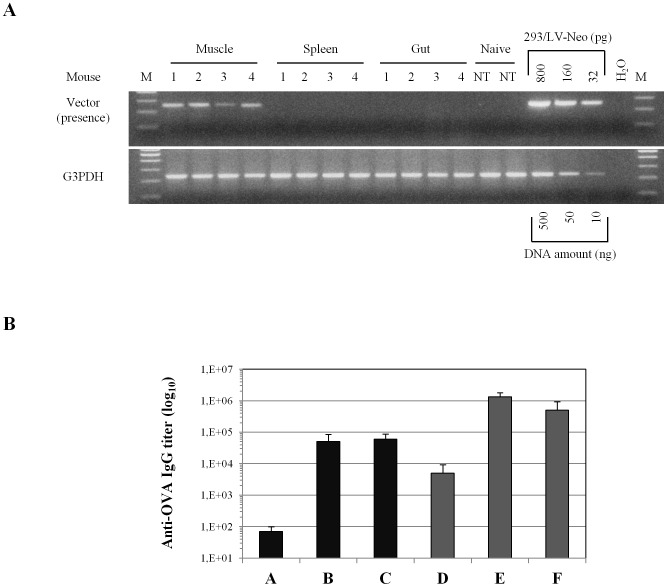
Many infectious agents infiltrate the host at the mucosal surfaces and then spread systemically. This implies that an ideal vaccine should induce protective immune responses both at systemic and mucosal sites to counteract invasive mucosal pathogens. We evaluated the in vivo systemic and mucosal antigen-specific immune response induced in mice by intramuscular administration of an integrase defective lentiviral vector (IDLV) carrying the ovalbumin (OVA) transgene as a model antigen (IDLV-OVA), either alone or in combination with sublingual adjuvanted OVA protein. Mice immunized intramuscularly with OVA and adjuvant were compared with IDLV-OVA immunization. Mice sublingually immunized only with OVA and adjuvant were used as a positive control of mucosal responses. A single intramuscular dose of IDLV-OVA induced functional antigen-specific CD8+ T cell responses in spleen, draining and distal lymph nodes and, importantly, in the lamina propria of the large intestine. These results were similar to those obtained in a prime-boost regimen including one IDLV immunization and two mucosal boosts with adjuvanted OVA or vice versa. Remarkably, only in groups vaccinated with IDLV-OVA, either alone or in prime-boost regimens, the mucosal CD8+ T cell response persisted up to several months from immunization. Importantly, following IDLV-OVA immunization, the mucosal boost with protein greatly increased the plasma IgG response and induced mucosal antigen-specific IgA in saliva and vaginal washes. Overall, intramuscular administration of IDLV followed by protein boosts using the sublingual route induced strong, persistent and complementary systemic and mucosal immune responses, and represents an appealing prime-boost strategy for immunization including IDLV as a delivery system.
Conflict of interest statement
Figures
Similar articles
-
Integrase Defective Lentiviral Vector as a Vaccine Platform for Delivering Influenza Antigens.Front Immunol. 2018 Feb 5;9:171. doi: 10.3389/fimmu.2018.00171. eCollection 2018. Front Immunol. 2018. PMID: 29459873 Free PMC article.
-
Mucosal immunization with integrase-defective lentiviral vectors protects against influenza virus challenge in mice.PLoS One. 2014 May 13;9(5):e97270. doi: 10.1371/journal.pone.0097270. eCollection 2014. PLoS One. 2014. PMID: 24824623 Free PMC article.
-
Successful therapeutic vaccination with integrase defective lentiviral vector expressing nononcogenic human papillomavirus E7 protein.Int J Cancer. 2013 Jan 15;132(2):335-44. doi: 10.1002/ijc.27676. Epub 2012 Jun 28. Int J Cancer. 2013. PMID: 22700466
-
Per-oral immunization with antigen-conjugated nanoparticles followed by sub-cutaneous boosting immunization induces long-lasting mucosal and systemic antibody responses in mice.PLoS One. 2015 Feb 24;10(2):e0118067. doi: 10.1371/journal.pone.0118067. eCollection 2015. PLoS One. 2015. PMID: 25710518 Free PMC article.
-
Integrase-defective lentiviral-vector-based vaccine: a new vector for induction of T cell immunity.Expert Opin Biol Ther. 2011 Jun;11(6):739-50. doi: 10.1517/14712598.2011.571670. Epub 2011 Mar 25. Expert Opin Biol Ther. 2011. PMID: 21434847 Review.
Cited by
-
Sublingual Boosting with a Novel Mucoadhesive Thermogelling Hydrogel Following Parenteral CAF01 Priming as a Strategy Against Chlamydia trachomatis.Adv Healthc Mater. 2022 Jun;11(11):e2102508. doi: 10.1002/adhm.202102508. Epub 2022 Mar 13. Adv Healthc Mater. 2022. PMID: 35124896 Free PMC article.
-
Sublingual immunization of trivalent human papillomavirus DNA vaccine in baculovirus nanovector for protection against vaginal challenge.PLoS One. 2015 Mar 19;10(3):e0119408. doi: 10.1371/journal.pone.0119408. eCollection 2015. PLoS One. 2015. PMID: 25789464 Free PMC article.
-
Integrase-Deficient Lentiviral Vector as an All-in-One Platform for Highly Efficient CRISPR/Cas9-Mediated Gene Editing.Mol Ther Methods Clin Dev. 2017 Apr 19;5:153-164. doi: 10.1016/j.omtm.2017.04.002. eCollection 2017 Jun 16. Mol Ther Methods Clin Dev. 2017. PMID: 28497073 Free PMC article.
-
Skeletal Muscle Is an Antigen Reservoir in Integrase-Defective Lentiviral Vector-Induced Long-Term Immunity.Mol Ther Methods Clin Dev. 2020 Mar 13;17:532-544. doi: 10.1016/j.omtm.2020.03.008. eCollection 2020 Jun 12. Mol Ther Methods Clin Dev. 2020. PMID: 32258216 Free PMC article.
-
Lipid bodies containing oxidatively truncated lipids block antigen cross-presentation by dendritic cells in cancer.Nat Commun. 2017 Dec 14;8(1):2122. doi: 10.1038/s41467-017-02186-9. Nat Commun. 2017. PMID: 29242535 Free PMC article.
References
-
- Lycke N (2012) Recent progress in mucosal vaccine development: potential and limitations. Nat Rev Immunol 12: 592–605. - PubMed
-
- Pavot V, Rochereau N, Genin C, Verrier B, Paul S (2012) New insights in mucosal vaccine development. Vaccine 30: 142–154. - PubMed
-
- Cuburu N, Kweon MN, Song JH, Hervouet C, Luci C, et al. (2007) Sublingual immunization induces broad-based systemic and mucosal immune responses in mice. Vaccine 25: 8598–8610. - PubMed
Publication types
MeSH terms
Substances
LinkOut - more resources
Full Text Sources
Other Literature Sources
Medical
Research Materials
Miscellaneous
