

The spatial dynamics of dengue virus in Kamphaeng Phet, Thailand
- PMID: 25211127
- PMCID: PMC4161352
- DOI: 10.1371/journal.pntd.0003138
The spatial dynamics of dengue virus in Kamphaeng Phet, Thailand
Abstract
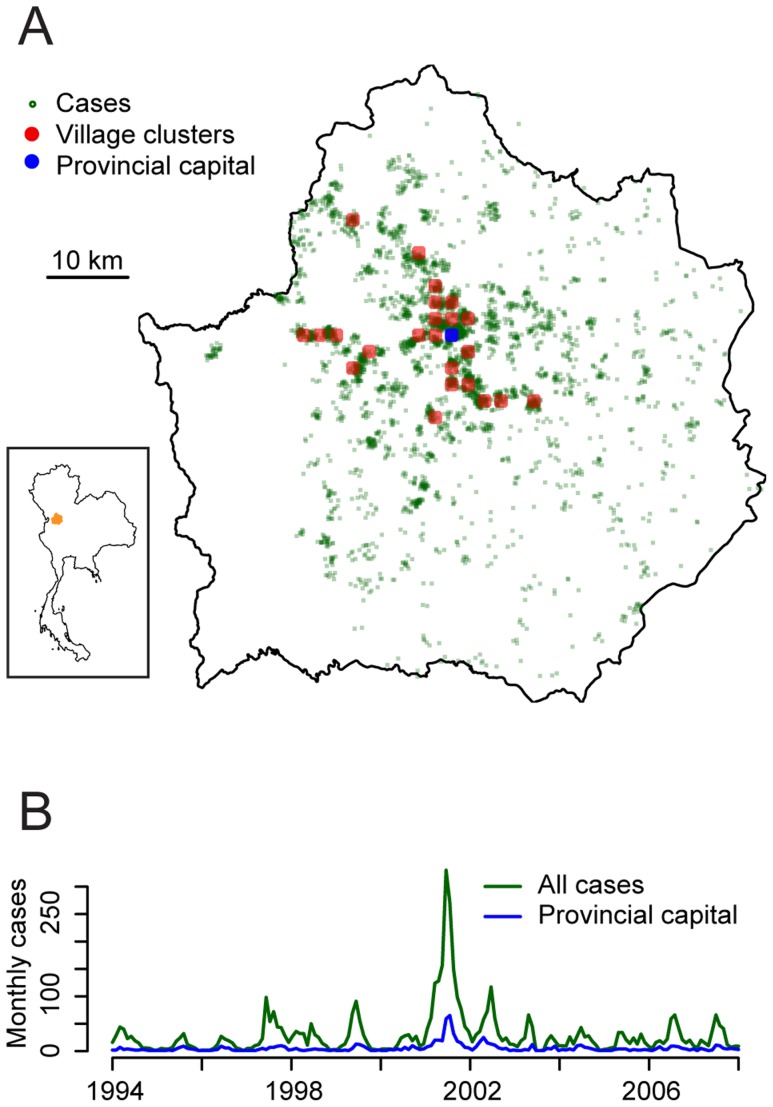
Background: Dengue is endemic to the rural province of Kamphaeng Phet, Northern Thailand. A decade of prospective cohort studies has provided important insights into the dengue viruses and their generated disease. However, as elsewhere, spatial dynamics of the pathogen remain poorly understood. In particular, the spatial scale of transmission and the scale of clustering are poorly characterized. This information is critical for effective deployment of spatially targeted interventions and for understanding the mechanisms that drive the dispersal of the virus.
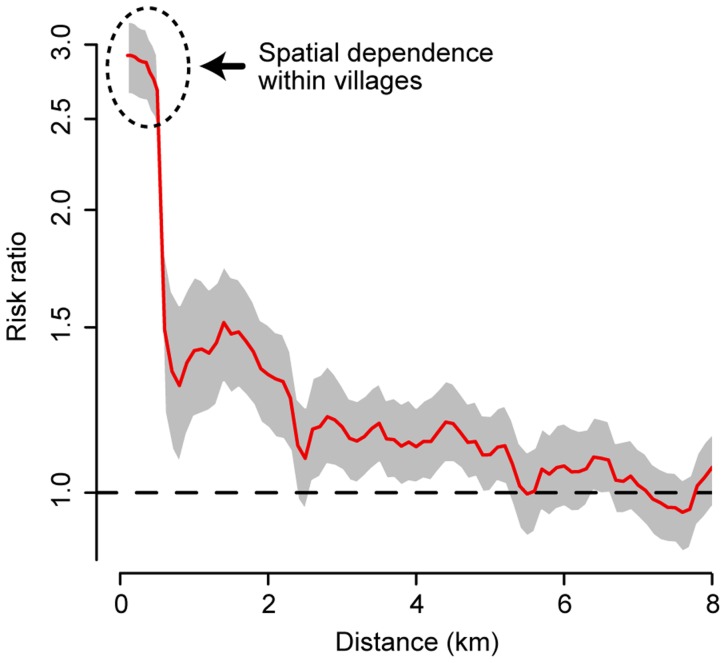
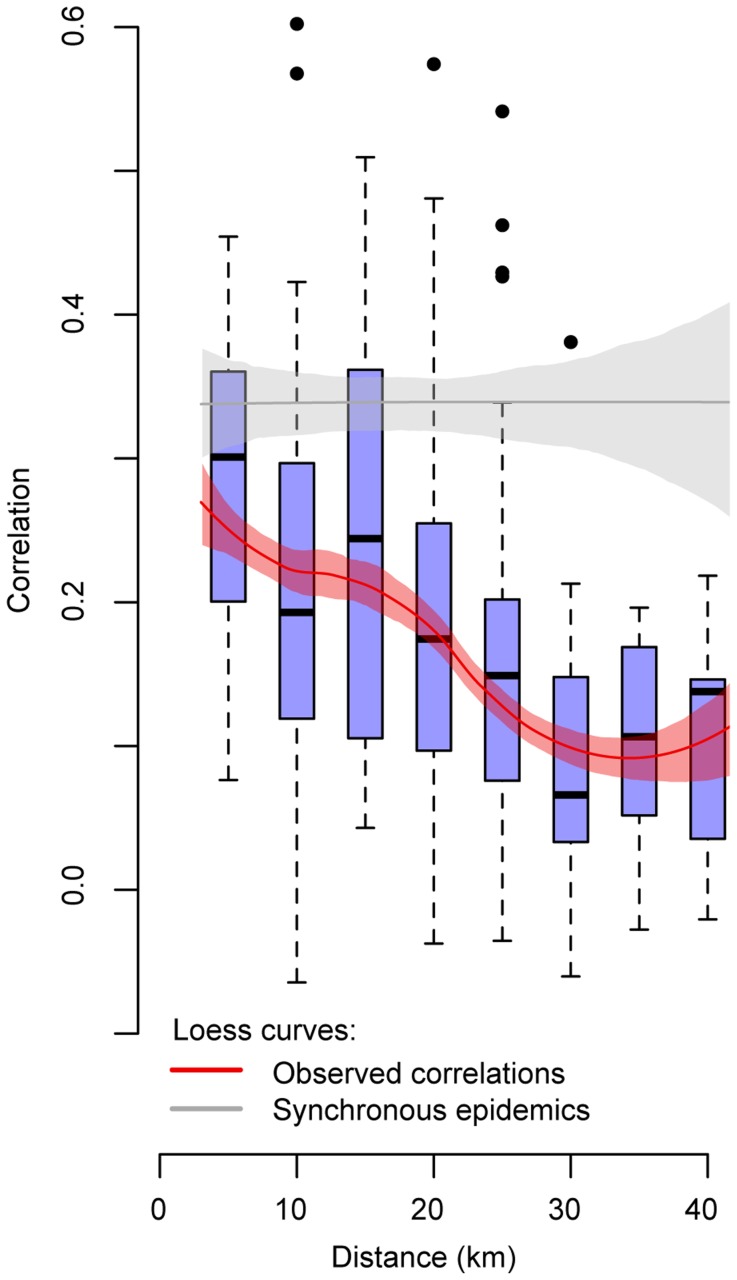
Methodology/principal findings: We geocoded the home locations of 4,768 confirmed dengue cases admitted to the main hospital in Kamphaeng Phet province between 1994 and 2008. We used the phi clustering statistic to characterize short-term spatial dependence between cases. Further, to see if clustering of cases led to similar temporal patterns of disease across villages, we calculated the correlation in the long-term epidemic curves between communities. We found that cases were 2.9 times (95% confidence interval 2.7-3.2) more likely to live in the same village and be infected within the same month than expected given the underlying spatial and temporal distribution of cases. This fell to 1.4 times (1.2-1.7) for individuals living in villages 1 km apart. Significant clustering was observed up to 5 km. We found a steadily decreasing trend in the correlation in epidemics curves by distance: communities separated by up to 5 km had a mean correlation of 0.28 falling to 0.16 for communities separated between 20 km and 25 km. A potential explanation for these patterns is a role for human movement in spreading the pathogen between communities. Gravity style models, which attempt to capture population movement, outperformed competing models in describing the observed correlations.
Conclusions: There exists significant short-term clustering of cases within individual villages. Effective spatially and temporally targeted interventions deployed within villages may target ongoing transmission and reduce infection risk.
Conflict of interest statement
The authors have declared that no competing interests exist.
Figures
References
-
- Nisalak A, Endy TP, Nimmannitya S, Kalayanarooj S, Thisayakorn U, et al. (2003) Serotype-specific dengue virus circulation and dengue disease in Bangkok, Thailand from 1973 to 1999. The American Journal of Tropical Medicine and Hygiene 68: 191–202. - PubMed
-
- Burke DS, Nisalak A, Johnson DE, Scott RM (1988) A prospective study of dengue infections in Bangkok. The American Journal of Tropical Medicine and Hygiene 38: 172–180. - PubMed
Publication types
MeSH terms
Grants and funding
LinkOut - more resources
Full Text Sources
Other Literature Sources
Medical
