Clinical Trial
. 2014 Sep 11;9(9):e106241.
doi: 10.1371/journal.pone.0106241. eCollection 2014.

Sterile immunity to malaria after DNA prime/adenovirus boost immunization is associated with effector memory CD8+T cells targeting AMA1 class I epitopes

Affiliations
Clinical Trial

Sterile immunity to malaria after DNA prime/adenovirus boost immunization is associated with effector memory CD8+T cells targeting AMA1 class I epitopes

Martha Sedegah et al. PLoS One. .

Abstract

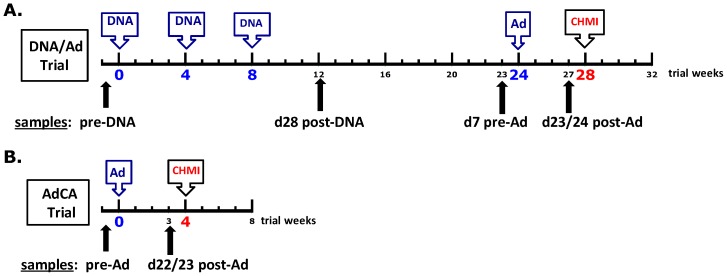
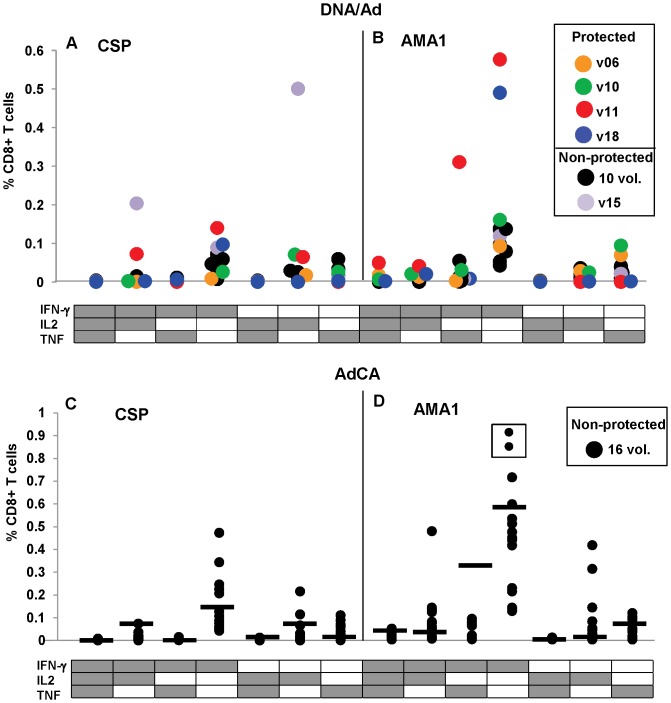
Background: Fifteen volunteers were immunized with three doses of plasmid DNA encoding P. falciparum circumsporozoite protein (CSP) and apical membrane antigen-1 (AMA1) and boosted with human adenovirus-5 (Ad) expressing the same antigens (DNA/Ad). Four volunteers (27%) demonstrated sterile immunity to controlled human malaria infection and, overall, protection was statistically significantly associated with ELISpot and CD8+ T cell IFN-γ activities to AMA1 but not CSP. DNA priming was required for protection, as 18 additional subjects immunized with Ad alone (AdCA) did not develop sterile protection.

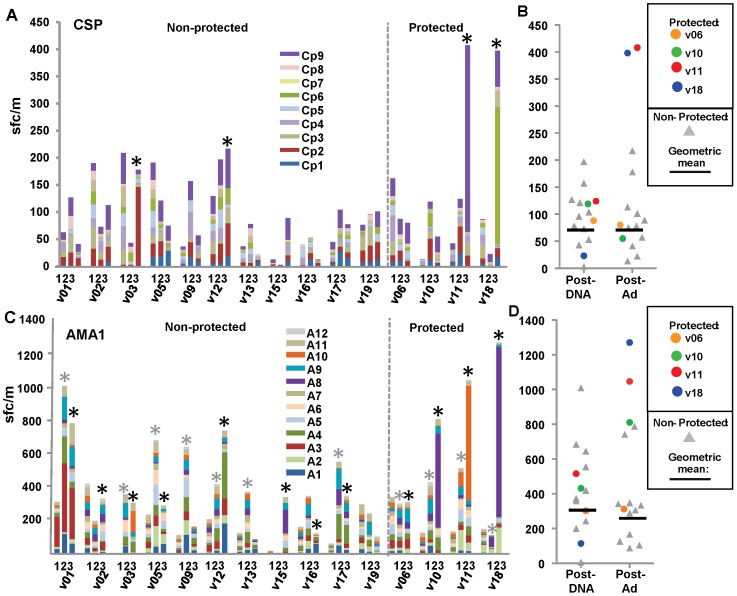
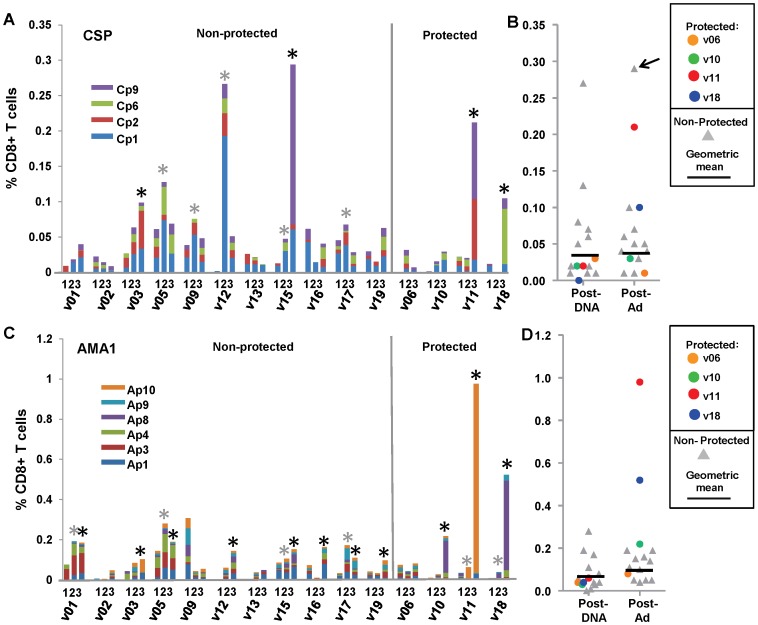
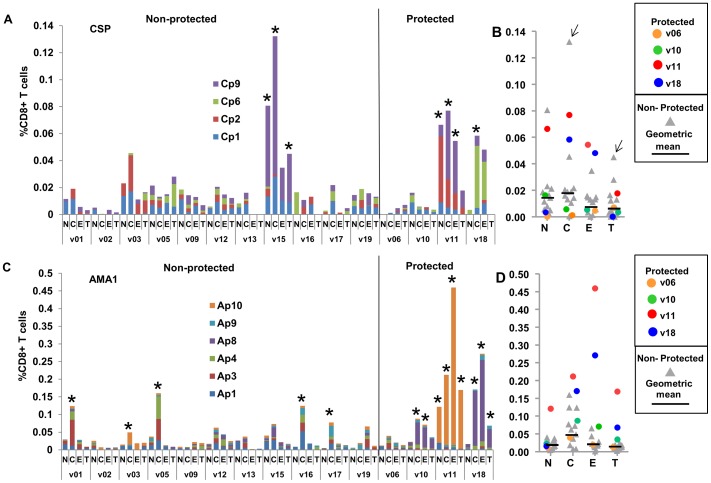
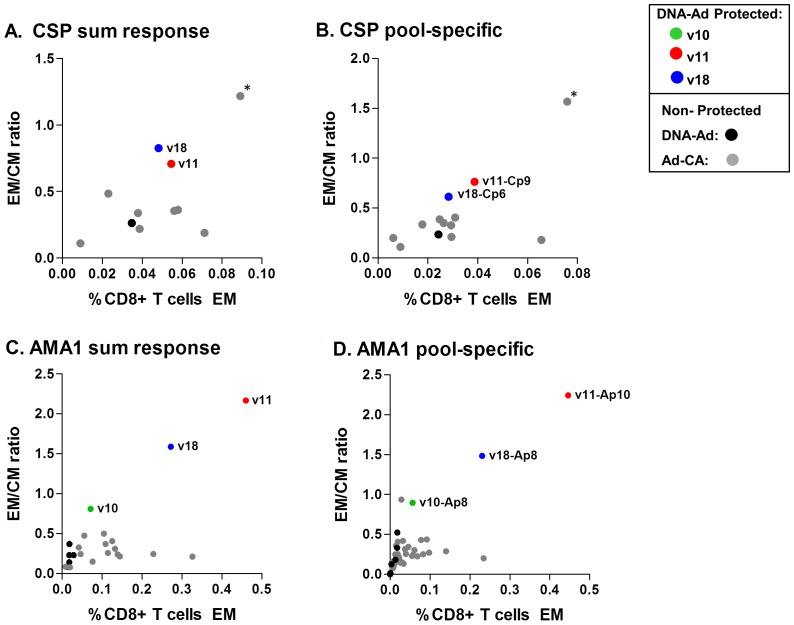
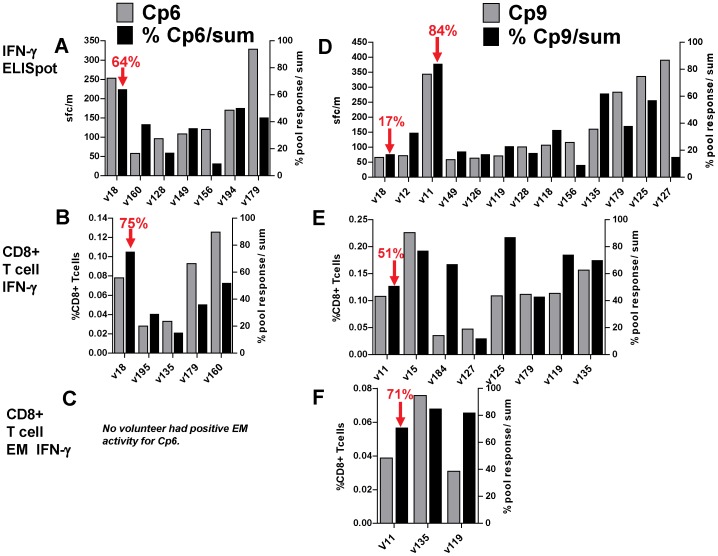
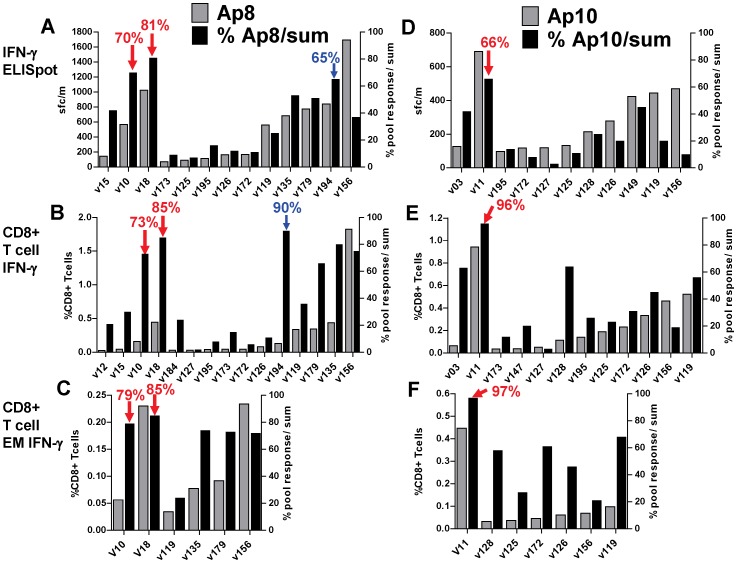
Methodology/principal findings: We sought to identify correlates of protection, recognizing that DNA-priming may induce different responses than AdCA alone. Among protected volunteers, two and three had higher ELISpot and CD8+ T cell IFN-γ responses to CSP and AMA1, respectively, than non-protected volunteers. Unexpectedly, non-protected volunteers in the AdCA trial showed ELISpot and CD8+ T cell IFN-γ responses to AMA1 equal to or higher than the protected volunteers. T cell functionality assessed by intracellular cytokine staining for IFN-γ, TNF-α and IL-2 likewise did not distinguish protected from non-protected volunteers across both trials. However, three of the four protected volunteers showed higher effector to central memory CD8+ T cell ratios to AMA1, and one of these to CSP, than non-protected volunteers for both antigens. These responses were focused on discrete regions of CSP and AMA1. Class I epitopes restricted by A*03 or B*58 supertypes within these regions of AMA1 strongly recalled responses in three of four protected volunteers. We hypothesize that vaccine-induced effector memory CD8+ T cells recognizing a single class I epitope can confer sterile immunity to P. falciparum in humans.

Conclusions/significance: We suggest that better understanding of which epitopes within malaria antigens can confer sterile immunity and design of vaccine approaches that elicit responses to these epitopes will increase the potency of next generation gene-based vaccines.

Trial registration: ClinicalTrials.gov NCT00392015 NCT00870987.


Conflict of interest statement

Competing Interests: CD and LS from USAID (funders) played a role in study design. This does not alter the authors' adherence to all the PLOS ONE policies on sharing data and materials.

Figures

Figure 1
Figure 1. DNA/Ad Trial design.
DNA/Ad Trial: Healthy, malaria-naïve adult research subjects received three doses of two DNA plasmids (mixture of 1 mg CSP and 1 mg AMA1, 2 mg total dose, in 2 ml phosphate buffered saline) in two divided doses of 1 ml into each deltoid muscle by needleless jet injection, followed by one dose of two adenovectors (mixture of 1×10¹⁰ particle units CSP and 1×10¹⁰ particle units of AMA1, 2×10¹⁰ particle units total dose, in 1 ml final formulation buffer) into one deltoid muscle by needle and syringe. Both Ad5 seropositive and seronegative study subjects were enrolled. AdCA Trial: Malaria-naïve adult research subjects received one dose of two adenovectors (formulated identically as in DNA/Ad) into one deltoid muscle by needle and syringe. Only Ad5 seronegative study subjects (neutralizing antibody titer <500, NVITAL assay) were enrolled. CHMI  =  controlled human malaria infection, administered via the bites of five laboratory-reared P. falciparum-infected Anopheles stephensi mosquitoes.
Figure 2
Figure 2. DNA/Ad ELISpot IFN-γ activities to CSP and AMA1 peptide pools.
Panels A and C: ELISpot activities (sfc/m) of each volunteer to CSP or AMA1 peptide pools are shown as color coded stacked bars at pre-immunization (1), 28 days after DNA immunization (2) and 22/23 days after the Ad boost (3). *Positive activities. Panels B and D: ELISpot activities were summed and protected subjects shown as color-coded dots. Horizontal bars represent geometric mean activities of non-protected volunteers. The geometric means of summed activities of non-protected volunteers and the activities of each protected volunteer are shown in Table 1. Panel A: CSP: All volunteers were negative after DNA immunization, but four volunteers were positive after Ad boost including protected v11 (408 sfc/m) and v18 (398 sfc/m) that were above non-protected volunteers, whereas protected v06 and v10 were negative. Most activity of v11 and v18 was directed to single CSP peptide pools. Panel B: CSP: Geometric means of non-protected volunteers remained similar after DNA immunization and Ad boost when v11 and v18 were higher than all other volunteers. Panel C: AMA1: 11 volunteers were positive after DNA immunization (*gray), and 11 were positive after Ad boost (*black), including protected v10 (810 sfc/m), v11 (1046 sfc/m) and v18 (1270 sfc/m) that were above non-protected volunteers, whereas protected v06 was within the range of non-protected volunteers. Most activity of v10, v11 and v18 was directed to single AMA1 peptide pools. Panel D: AMA1: Geometric means of non-protected volunteers were higher Ad boost when v10, v11 and v18 higher than all volunteers.
Figure 3
Figure 3. DNA/Ad CD8+ T cell IFN-γ activities to CSP and AMA1 peptide pools.
Panels A and C: CD8+ T cell IFN-γ activities of each volunteer to CSP or AMA1 peptide pools are shown as color coded stacked bars at pre-immunization (1), 28 days after DNA immunization (2) and 22/23 days after the Ad boost (3). *Positive activities (gray: post-DNA: black: post-Ad). Panels B and D: CD8+ T cell IFN-γ activities were summed and are shown as color-coded dots. Horizontal bars represent geometric mean activities of non-protected volunteers. The geometric means of summed activities of non-protected volunteers and the activities of each protected volunteer are shown in Table 1. Panel A: CSP: Five non-protected volunteers were positive after DNA immunization, but four volunteers were positive after Ad boost including protected v11 (0.21%) and v18 (0.10%) that were above non-protected volunteers, except v15 that had highest activity (0.29%), whereas protected v06 and v10 were negative. Most activity of v11, v18 and v15 was directed to single CSP peptide pools. Panel B: CSP: Geometric means of non-protected volunteers remained similar after DNA immunization and Ad boost when v11 and v18 were higher than all other volunteers, except v15 (arrow). Panel C: AMA1: Four non-protected volunteers were positive after DNA immunization, and 11 were positive after Ad boost, including protected v10 (0.22%), v11 (0.98%) and v18 (0.52%) that were above non-protected volunteers, whereas protected v06 negative. Most activity of v10, v11 and v18 was directed to single AMA1 peptide pools. Panel D: AMA1: Geometric means of non-protected volunteers rose after Ad boost compared to after DNA immunization, and v10, v11 and v18 higher than all volunteers.
Figure 4
Figure 4. DNA/Ad CD8+ T cell memory IFN-γ activities to CSP and AMA1 peptide pools.
Panels A and C: CD8+ T cell IFN-γ activities of each volunteer to CSP or AMA1 peptide pools 22/23 days after the Ad boost are shown as color coded stacked bars, differentiating memory naïve (N), central (C), effector (E) and terminally differentiated (T) cells (per cent of CD8+ T cells) to CSP and AMA1 peptides as color-coded bars. Non-protected and protected volunteers are grouped. *Positive activities (defined in Methods). Panels B and D: CD8+ T cell IFN-γ memory activities were summed and are shown as color-coded dots. Horizontal bars represent geometric mean activities of non-protected volunteers. The geometric means of summed activities of non-protected volunteers and the activities of each protected volunteer are shown in Table 1. Panel A: CSP: among non-protected volunteers, only one (v15) had positive CM and TD activities and none had positive EM activities. One protected volunteer (v11) had positive CM, EM and TD activities whereas protected v18 had only positive CM activity. Positive CM, EM and TD activities were predominantly directed to single CSP peptide pools. Panel B: the geometric mean of CM and EM activities of non-protected volunteers were lower than protected v11 and v18, except CM activity of non-protected v15 (arrow). Panel C: AMA1: five non-protected volunteers only had positive CM activities, whereas protected v10 had positive CM and EM, and v11 and v18 had positive CM, EM and TD activities that were mostly directed to single AMA1 peptide pools. Panel D: AMA1: the geometric mean of CM activities of non-protected volunteers was similar to v10 but lower than v11 and v18; however, protected v10, v11 and v18 were above the geometric means of EM and TD activities of non-protected volunteers.
Figure 5
Figure 5. DNA/Ad and AdCA CD8+ T cell antigen-specific activities are predominantly monofunctional with lower polyfunctional responses.
Monofunctional and polyfunctional CD8+ T cell activities to CSP and AMA1 after DNA/Ad (Panels A and B) and AdCA (Panels C and D) immunization are shown as color-coded filled circles that represent the percent of CD8+ T cells containing cytokine(s). Black horizontal bar denotes highest activities in DNA/Ad compared with AdCA activities. Activities to individual CSP and AMA1 peptide pools are shown in Figures S1 and S2. Panel A: DNA/Ad CSP: IFN-γ monofunctional activities of protected v11 and v18 were higher (v11, 0.14%; v18, 0.1%) than the two positive non-protected volunteers (v03, 0.07%; v15, 0.09%). Non-protected v15 developed the highest IFN-γ/IL2 polyfunctional (0.20%) and IL2 monofunctional (0.5%) activities. Protected v11 developed positive IFN-γ/IL2 polyfunctional (0.07%) and IL2 monofunctional (0.06%) activities. Panel B: DNA/Ad AMA1: IFN-γ monofunctional activities of protected v10, v11 and v18 (v10, 0.16%; v11, 0.58%, v18, 0.49%) were higher than the eight non-protected volunteers (range 0.05–0.14%). Non-protected v17 and protected v10 also developed lower TNF-α monofunctional (0.07%, 0.09%) activity; v11 also developed IFN-γ/TNF-α polyfunctional (0.31%) activity and lower IFN-γ/IL2 polyfunctional (0.04%), and IFN-γ/IL2/TNF-α polyfunctional (0.05%) activities. Panel C: AdCA CSP: 11 volunteers developed IFN-γ monofunctional activities (0.05%–0.48%), of whom one volunteer developed IFN-γ/IL2 polyfunctional, three developed IL2 monofunctional and two additional volunteers also developed IL2 monofunctional activities. Four volunteers had higher IFN-γ and two volunteers had higher IL2 monofunctional activities than protected volunteers in DNA/Ad. Panel D: AdCA AMA1: all 16 volunteers developed positive IFN-γ monofunctional – boxed volunteers are above scale (1.60% and 1.79% respectively), of whom nine developed lower IFN-γ/IL2 polyfunctional or IFN-γ/TNF-α polyfunctional activities; three volunteers developed IL2 monofunctional and TNF-α monofunctional activities. Four volunteers had higher IFN-γ monofunctional and eight volunteers had higher IFN-γ/IL2 polyfunctional activities than protected volunteers in the DNA/Ad trial.
Figure 6
Figure 6. Ratios of effector to central memory in DNA/Ad and AdCA trials for CSP and AMA1 (based on summed and pool-specific responses).
All volunteers who had positive summed and pool-specific CD8+ IFN-γ memory central (CM) and effector (EM) activities after Ad boost for CSP or AMA1 were plotted as the ratio of EM:CM vs. EM activity. In addition, some volunteers who had positive CM but negative EM activities were included. Volunteers with negative CM and EM activities were not included. Panel A. CSP summed response: protected v11 and v18 had a higher EM:CM ratio than all other volunteers in the DNA/Ad and AdCA trials, except v135 in the AdCA trial (*). EM activity of v18 did not meet the positivity definition. Panel B. CSP pool-specific response: protected v11 and v18 had a higher EM:CM ratios against Cp9 (v11) and Cp6 (v18) respectively than all other volunteers with positive EM and/or CM activities against any individual pools in the DNA/Ad and AdCA trials, except v135 in the AdCA trial. EM activity of v18 did not meet the positivity definition. Panel C. AMA1 summed response: protected v10, v11, and v18 had a higher EM:CM ratio than all other volunteers with positive EM and/or CM activities in the DNA/Ad and AdCA trials. Panel D. AMA1 pool specific response: protected v10, v11 and v18 had a higher EM:CM ratios against Ap8 (v10 and v18) and Ap10 (v11) compared to all other volunteers in the DNA/Ad and AdCA trials.
Figure 7
Figure 7. DNA/Ad and AdCA: Comparison of positive T cell activities and percent of total activities to CSP peptide pools.
ELISpot, CD8+ T cell IFN-γ, and CD8+ T cell EM IFN-γ activities to individual CSP peptide pools (Cp6 and Cp9) were calculated as per cent of total activities of summed responses to all CSP peptide pools. All volunteers positive with Cp6 or Cp9 were selected. Panels A, B, C: Cp6: protected v18 had lower activities than some AdCA volunteers, but highest per cent activities; v194 (delay to patency) had higher per cent ELISpot activity than other AdCA volunteers, but lower than v18. None of the DNA/Ad or AdCA volunteers had positive EM activity to Cp6. Panels D, E, F: Cp9: protected v11 had highest per cent ELISpot activity to Cp9, but CD8+ T cell IFN-γ and EM activities were lower than some AdCA volunteers.
Figure 8
Figure 8. DNA/Ad and AdCA: Comparison of positive T cell activities and per cent of total activities to AMA1 peptide pools.
ELISpot IFN-γ, CD8+ T cell IFN-γ, and CD8+ T cell EM IFN-γ activities to individual AMA1 peptide pools (Ap8 and Ap10) were calculated as per cent of total activities of summed responses to all AMA1 peptide pools. All volunteers positive with Ap8 or Ap10 were selected. Panels A, B, C: Ap8: protected v10 and v18 had lower activities than one or more AdCA volunteers, but highest per cent activities; v194 (delay to patency, blue arrows) had higher per cent ELISpot and CD8+ T cell IFN-γ activities than other AdCA volunteers, but no CD8+ T cell IFN-γ EM activity. Panels D, E, F: Ap10: protected v11 had highest per cent ELISpot, CD8+ T cell IFN-γ and CD8+ T cell IFN-γ EM activities to Ap10.

Similar articles

Cited by

References

    1. Murray CJ, Rosenfeld LC, Lim SS, Andrews KG, Foreman KJ, et al. (2012) Global malaria mortality between 1980 and 2010: a systematic analysis. Lancet 379: 413–431. - PubMed
    1. Das P, Horton R (2010) Malaria elimination: worthy, challenging, and just possible. Lancet 376: 1515–1517. - PubMed
    1. Weiss WR, Good MF, Hollingdale MR, Miller LH, Berzofsky JA (1989) Genetic control of immunity to Plasmodium yoelii sporozoites. J Immunol 143: 4263–4266. - PubMed
    1. Hoffman SL, Weiss W, Mellouk S, Sedegah M (1990) Irradiated sporozoite vaccine induces cytotoxic T lymphocytes that recognize malaria antigens on the surface of infected hepatocytes. Immunol Lett 25: 33–38. - PubMed
    1. Weiss WR, Jiang CG (2012) Protective CD8+ T lymphocytes in primates immunized with malaria sporozoites. PLoS One 7: e31247. - PMC - PubMed

Publication types

MeSH terms

Associated data