Review
. 2014 Aug;58(6):600-9.
doi: 10.1590/0004-2730000003223.

Obesity, insulin resistance and comorbidities? Mechanisms of association

Affiliations
Review

Obesity, insulin resistance and comorbidities? Mechanisms of association

Ana Valeria B Castro et al. Arq Bras Endocrinol Metabol. 2014 Aug.

Abstract

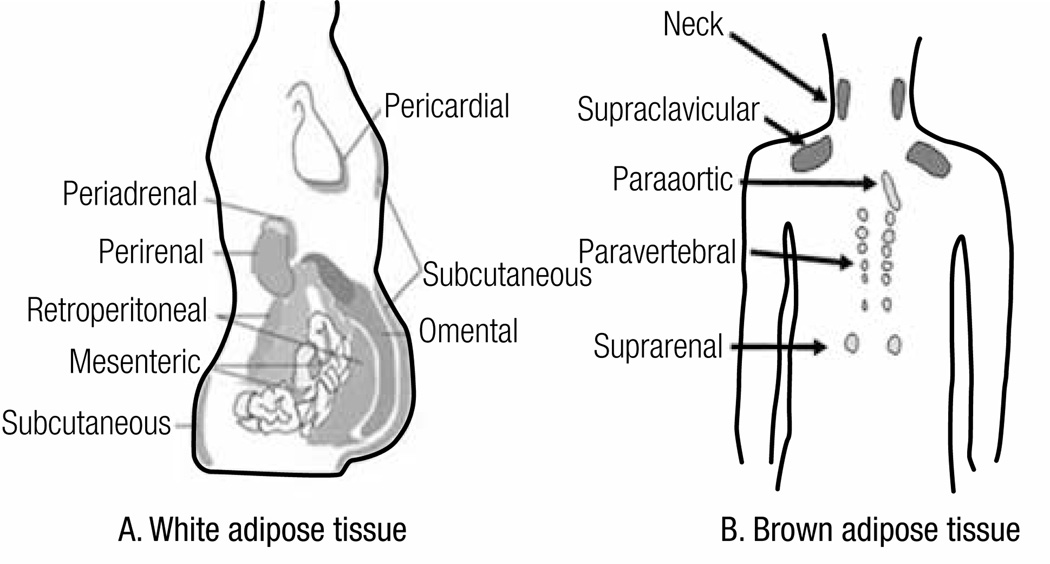
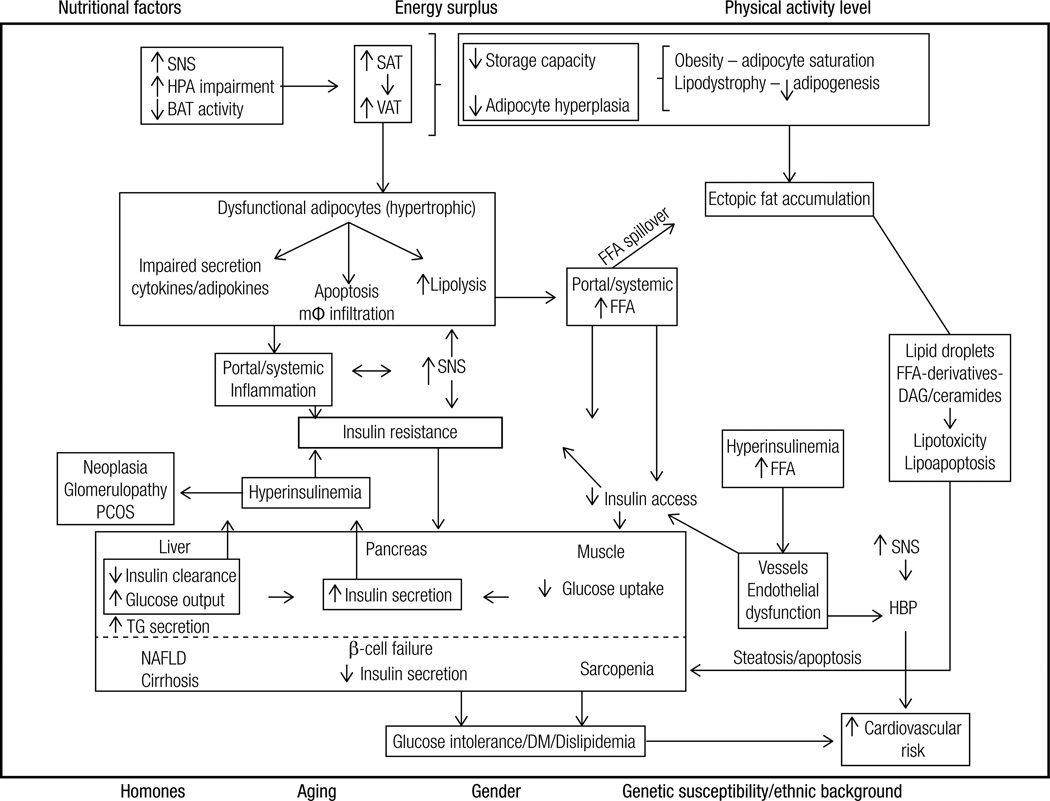
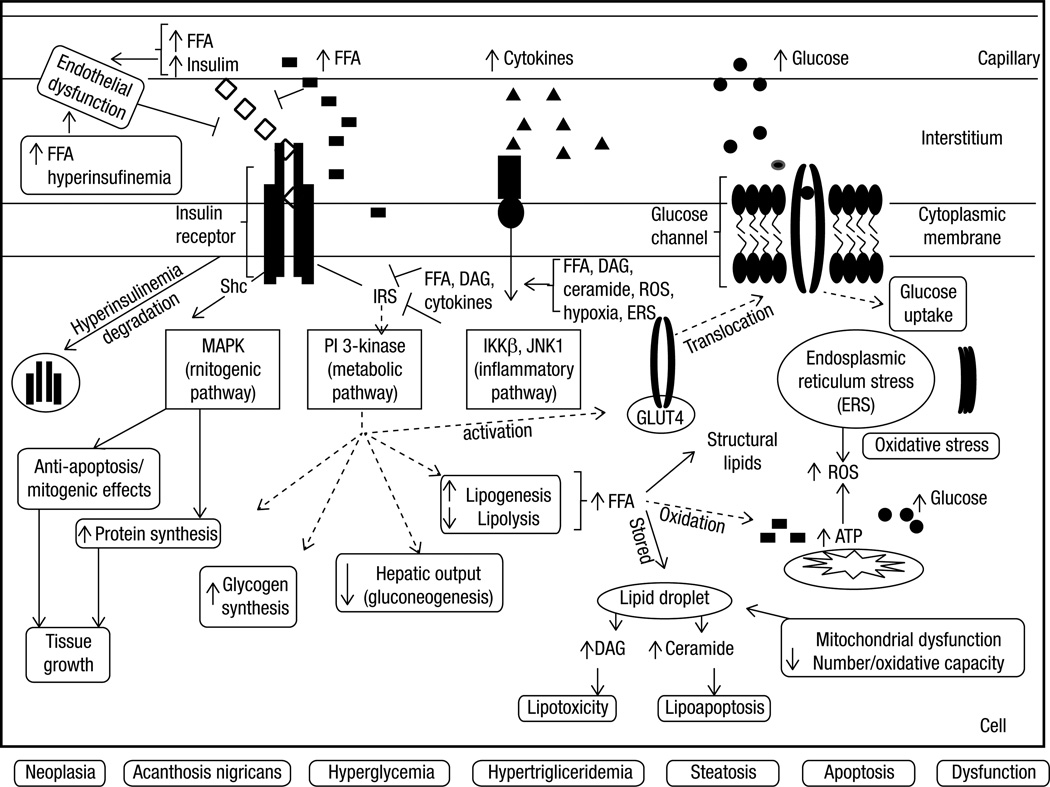
Overall excess of fat, usually defined by the body mass index, is associated with metabolic (e.g. glucose intolerance, type 2 diabetes mellitus (T2DM), dyslipidemia) and non-metabolic disorders (e.g. neoplasias, polycystic ovary syndrome, non-alcoholic fat liver disease, glomerulopathy, bone fragility etc.). However, more than its total amount, the distribution of adipose tissue throughout the body is a better predictor of the risk to the development of those disorders. Fat accumulation in the abdominal area and in non-adipose tissue (ectopic fat), for example, is associated with increased risk to develop metabolic and non-metabolic derangements. On the other hand, observations suggest that individuals who present peripheral adiposity, characterized by large hip and thigh circumferences, have better glucose tolerance, reduced incidence of T2DM and of metabolic syndrome. Insulin resistance (IR) is one of the main culprits in the association between obesity, particularly visceral, and metabolic as well as non-metabolic diseases. In this review we will highlight the current pathophysiological and molecular mechanisms possibly involved in the link between increased VAT, ectopic fat, IR and comorbidities. We will also provide some insights in the identification of these abnormalities.


Conflict of interest statement

Disclosure: no potential conflict of interest relevant to this article was reported.

Figures

Figure 1
Figure 1. Classification of fat and distribution of white adipose tissue (WAT) and brown adipose tissue (BAT)
(A) WAT is classified in subcutaneous adipose tissue (SAT) and internal adipose tissue. SAT is further subdivided in superficial and deep adipose tissue. Internal adipose tissue is comprised by intrathoracic (e.g. pericardial) and visceral adipose tissue (VAT). The latter is further compartmentalized in intraperitoneal fat (greater omentum and mesenteric) and extraperitoneal fat (pre and retroperitoneal). (B) BAT is found along vessels (aorta, carotid, coronary arteries etc.), neck, interscapular and supraclavicular regions, axilla, abdominal wall, inguinal fossa and muscle (not shown). (A – adapted from Cook A. and Cowan C., Adipose (2009)- doi/10.3824/stembook.1.40.1, B – adapted from Awada R, Parimisetty A, Lefebvre d’Hellencourt C (2013)- doi/10.5772/5367).
Figure 2
Figure 2. Summary of the pathophysiological mechanisms associated with the development of insulin resistance associated with obesity and comorbidities
Hormonal status (e.g. menopause), aging, gender, genetic susceptibility and ethnic background interact with lifestyle factors to predispose to the increase of VAT/ectopic fat and the development of IR. Energy surplus secondary to nutritional factors (e.g. high energy food intake) associated with low physical activity levels lead to an increase in SAT/VAT. When the capacity of these tissues to expand becomes saturated (obesity) or limited (lipodystrophy), lipids spill over to non-adipose tissue sites (ectopic fat deposition). Fat growth by hypertrophy generates dysfunctional adipocytes that are more resistant to insulin’s antilipolytic effect and present impaired secretion of cytokines/adipokines (e.g. decreased adiponectin, increased TNFalpha and IL-6). Consequently, FFA and cytokines are released into the circulation. The surplus of FFA to the cells is oxidized, stored (lipids droplets) or metabolized into toxic derivatives (DAG and ceramides). These toxic derivatives lead to insulin resistance, impair cell function (lipotoxicity) or lead to apoptosis (lipoapoptosis). In the pancreas these toxic effects lead to decreased number and impaired capacity of β-cells to secrete insulin, predisposing to the development of type 2 diabetes mellitus; in the liver it leads to non-alcoholic steatohepatitis and subsequently to cirrhosis; in the muscle, to sarcopenia; in the kidney to glomerulopathy etc. Cell dysfunction and death elicit macrophage infiltration, and local and systemic inflammation. In addition, the secretion of inflammatory molecules into the circulation also impairs intracellular insulin signaling. The consequent insulin resistance increases endogenous glucose production by the liver and decreases glucose utilization by peripheral tissues (e.g. muscle). Consequently, glycemia rises and promotes increase in insulin secretion by the pancreas. In addition, hepatic insulin clearance is impaired contributing to hyperinsulinemia, which promotes down regulation of insulin receptor. Among several effects, hyperinsulinemia promotes cell growth (e.g. acanthosis nigricans, neoplasias) and leads to endothelial dysfunction (increased vasoconstriction). SAT: subcutaneous adipose tissue; VAT: visceral adipose tissue; BAT: brown adipose tissue; FFA: free fatty acids; mφ-macrophage; TG: triglycerides; SNS: sympathetic nervous system; DM: type 2 diabetes mellitus; DAG: diacylglycerol; NAFLD: non-alcoholic fatty liver disease; PCOS: polycystic ovary syndrome; HBP: high blood pressure
Figure 3
Figure 3. Summary of the main putative molecular mechanisms involved in the development of insulin resistance associated with obesity in a hypothetical cell (e.g. hepatocyte, myocyte, adipocyte)
Insulin resistance associated with obesity, especially central, occurs due to pre-receptor, receptor and/or post-receptor impairments, mainly secondary to elevated FFA, hyperinsulinemia and increased cytokines. Insulin access to the interstitial space (pre-receptor impairment) may be induced by the excess of FFA and their metabolites as well by endothelial dysfunction secondary to increased circulating insulin. Hyperinsulinemia, secondary to the decrease of FFA-induced insulin clearance and the increase of insulin secretion, causes downregulation of insulin receptors (receptor impairment). In addition, insulin receptor downstream signaling (post-receptor impairment) is inhibited by FFA and cytokines. Increased intracellular FFA also contribute to excessive production of ATP, oxidative stress and mitochondrial dysfunction, production of reactive oxidative species, endoplasmic reticulum stress and lipid storage and accumulation of non-oxidative toxic derivatives (dyacylgycerol and ceramide). The aforementioned factors also activate inflammation pathways. Independently of the upstream or downstream level of the insulin receptor impairment, insulin resistance occurs by the inhibition of the phosphorylation of the insulin receptor substrates (IRS-1 or 2) and the subsequent inhibition of PI3K pathway, responsible for metabolic effects. Consequently to this inhibition occurs 1) decrease in the activation of GLUT-4 which impairs glucose uptake; 2) increase of glucose production by the liver (either by inhibiting glucogenesis and/or promoting glycogenolysis) and 3) increase of de novo lipogenesis, storage of lipid (lipid droplets) and toxic derivatives. On the other hand, the insulin receptor substrate, Shc, is spared from inhibition by FFA or cytokines and is stimulated by hyperinsulinemia. Consequently, MAPK pathway (mitogenic) is activated leading to anti-apoptotic and proliferation effects, culminating with tissue growth. Metabolic and non-metabolic consequences of IR and ectopic accumulation of fat are: hyperglycemia, hypertriglyceridemia, acanthosis nigricans, neoplasias, steatosis, cell growth or apoptosis or cell dysfunction. FFA: free fatty acids; IRS: insulin receptor substrates; MAPK: mitogen-activated protein kinase; PI3K: phosphoinositide 3-kinase; DAG: dyacylgycerol; ROS: reactive oxidative species; ERS: endoplasmic reticulum stress, AN: acanthosis nigricans.

References

    1. Tchernof A, Despres JP. Pathophysiology of human visceral obesity: an update. Physiol Rev. 2013;93(1):359–404. - PubMed
    1. Vazquez G, Duval S, Jacobs DR, Jr, Silventoinen K. Comparison of body mass index, waist circumference, and waist/hip ratio in predicting incident diabetes: a meta-analysis. Epidemiol Rev. 2007;29:115–128. - PubMed
    1. Fabbrini E, Sullivan S, Klein S. Obesity and nonalcoholic fatty liver disease: biochemical, metabolic, and clinical implications. Hepatology. 2010;51(2):679–689. - PMC - PubMed
    1. Kawai M, de Paula FJ, Rosen CJ. New insights into osteoporosis: the bone-fat connection. J Intern Med. 2012;272(4):317–329. - PMC - PubMed
    1. Després JP. Body fat distribution and risk of cardiovascular disease: an update. Circulation. 2012;126(10):1301–1313. - PubMed

LinkOut - more resources