

Development and evaluation of single domain antibodies for vaccinia and the L1 antigen
- PMID: 25211488
- PMCID: PMC4161341
- DOI: 10.1371/journal.pone.0106263
Development and evaluation of single domain antibodies for vaccinia and the L1 antigen
Abstract
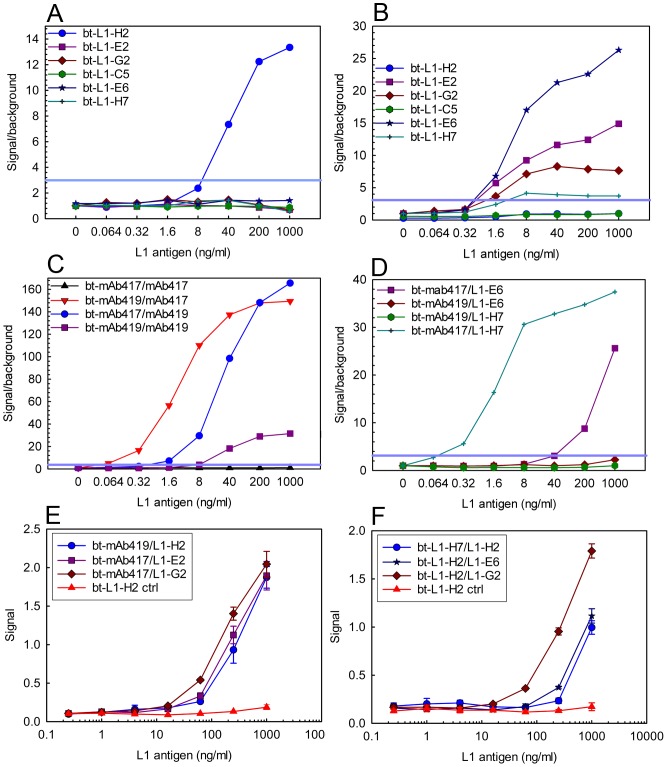
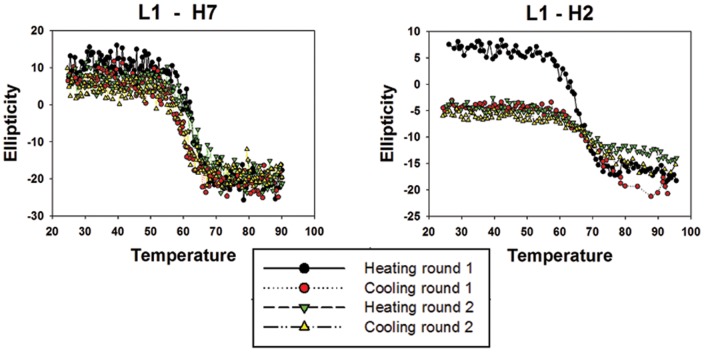
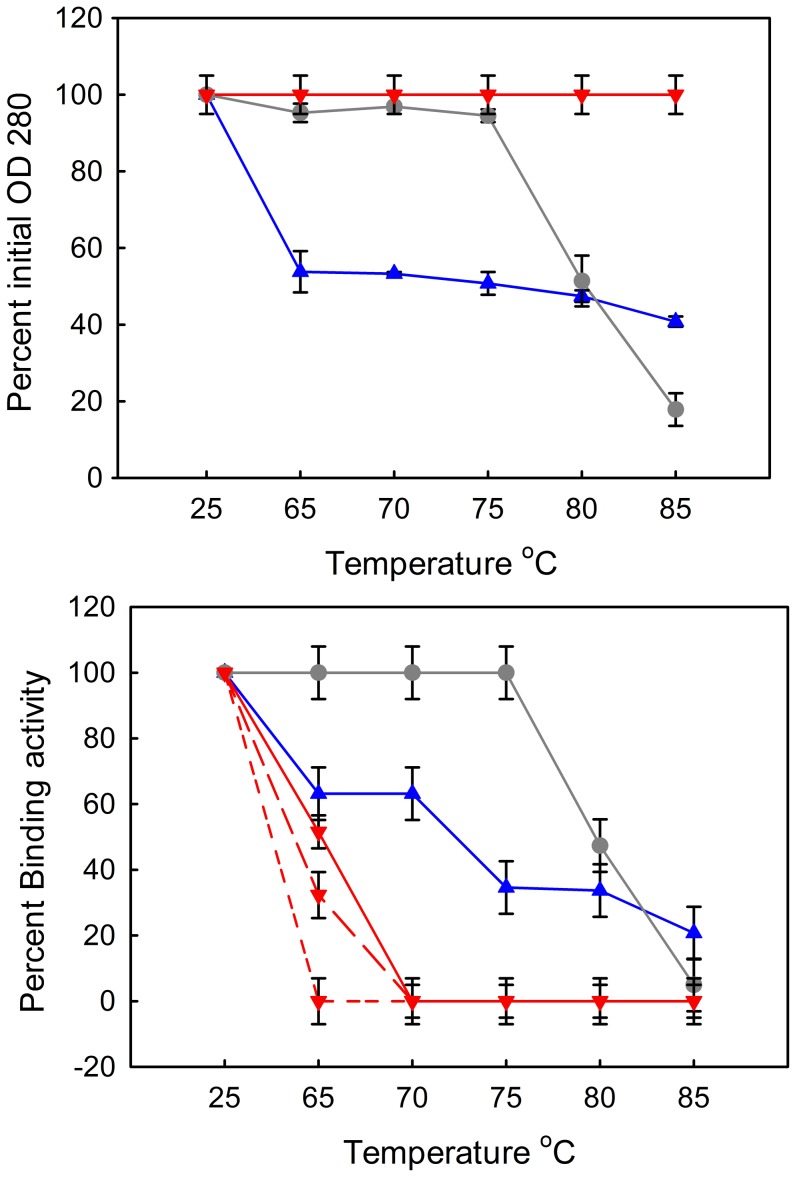
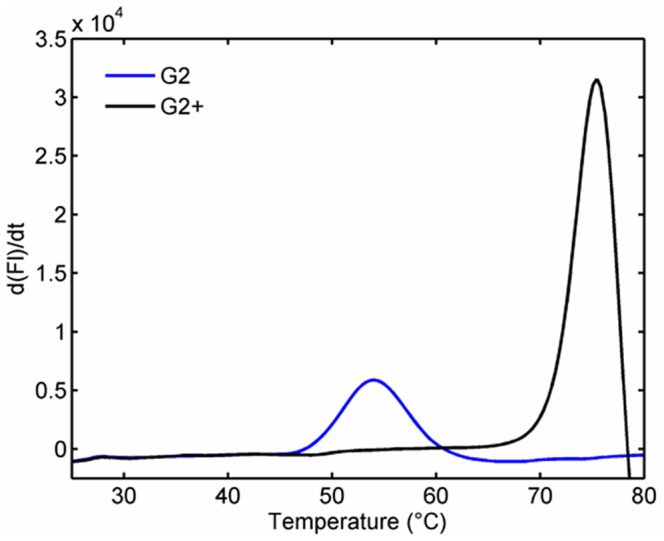
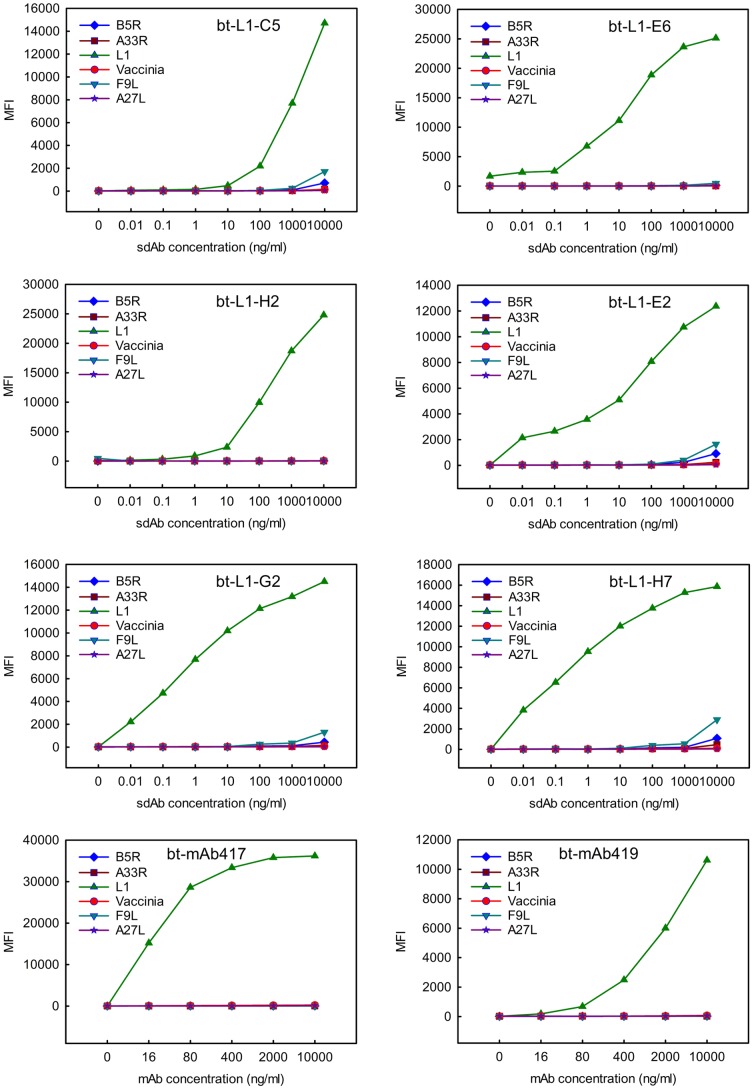
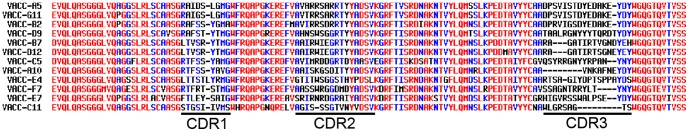
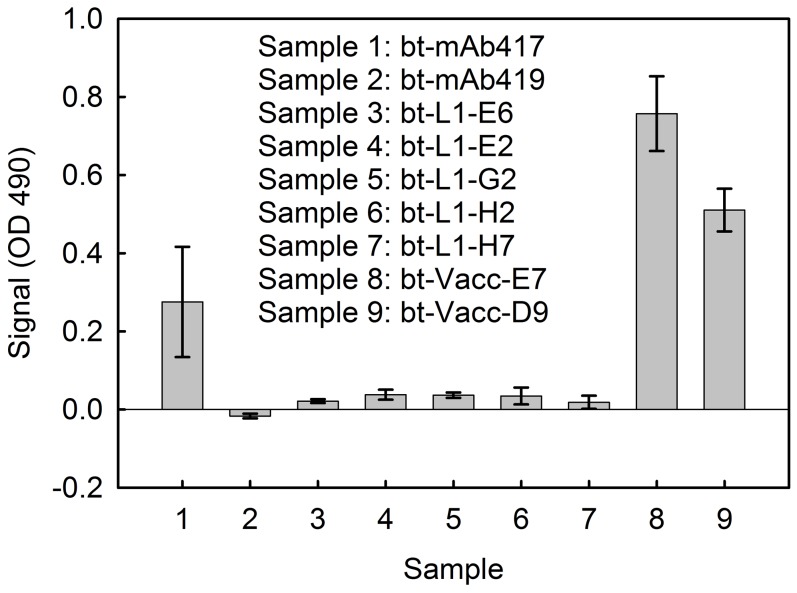
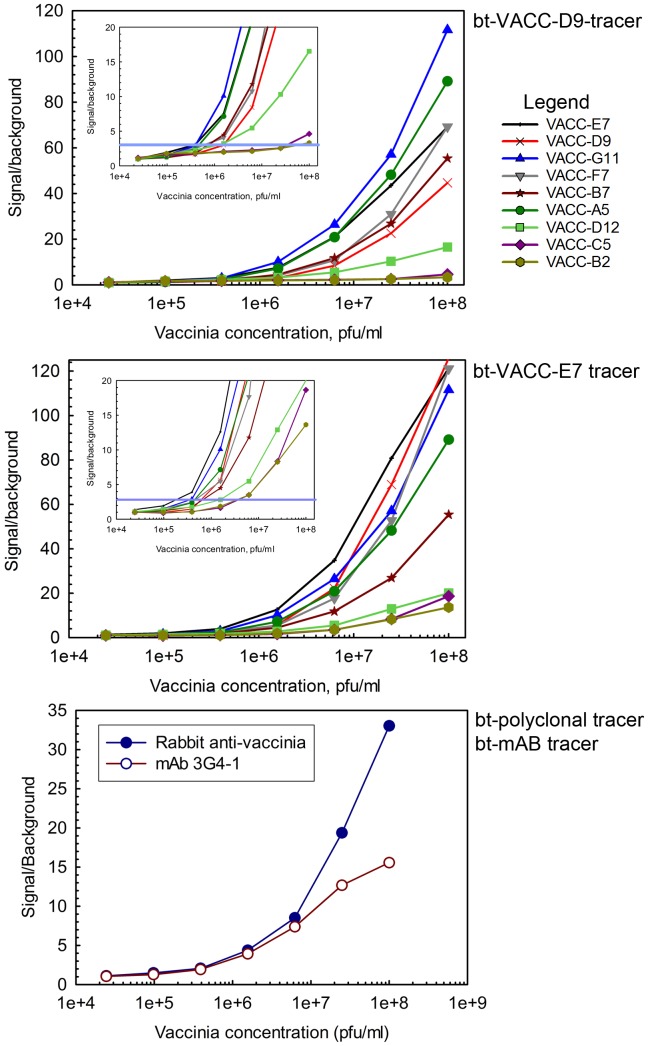
There is ongoing interest to develop high affinity, thermal stable recognition elements to replace conventional antibodies in biothreat detection assays. As part of this effort, single domain antibodies that target vaccinia virus were developed. Two llamas were immunized with killed viral particles followed by boosts with the recombinant membrane protein, L1, to stimulate the immune response for envelope and membrane proteins of the virus. The variable domains of the induced heavy chain antibodies were selected from M13 phage display libraries developed from isolated RNA. Selection via biopanning on the L1 antigen produced single domain antibodies that were specific and had affinities ranging from 4×10(-9) M to 7.0×10(-10) M, as determined by surface plasmon resonance. Several showed good ability to refold after heat denaturation. These L1-binding single domain antibodies, however, failed to recognize the killed vaccinia antigen. Useful vaccinia binding single domain antibodies were isolated by a second selection using the killed virus as the target. The virus binding single domain antibodies were incorporated in sandwich assays as both capture and tracer using the MAGPIX system yielding limits of detection down to 4×10(5) pfu/ml, a four-fold improvement over the limit obtained using conventional antibodies. This work demonstrates the development of anti-vaccinia single domain antibodies and their incorporation into sandwich assays for viral detection. It also highlights the properties of high affinity and thermal stability that are hallmarks of single domain antibodies.
Conflict of interest statement
Figures

Similar articles
-
Enhanced production of a single domain antibody with an engineered stabilizing extra disulfide bond.Microb Cell Fact. 2015 Oct 9;14:158. doi: 10.1186/s12934-015-0340-3. Microb Cell Fact. 2015. PMID: 26449768 Free PMC article.
-
Facile generation of heat-stable antiviral and antitoxin single domain antibodies from a semisynthetic llama library.Anal Chem. 2006 Dec 15;78(24):8245-55. doi: 10.1021/ac0610053. Anal Chem. 2006. PMID: 17165813 Free PMC article.
-
Selection, characterization, and thermal stabilization of llama single domain antibodies towards Ebola virus glycoprotein.Microb Cell Fact. 2017 Dec 12;16(1):223. doi: 10.1186/s12934-017-0837-z. Microb Cell Fact. 2017. PMID: 29233140 Free PMC article.
-
Introduction to heavy chain antibodies and derived Nanobodies.Methods Mol Biol. 2012;911:15-26. doi: 10.1007/978-1-61779-968-6_2. Methods Mol Biol. 2012. PMID: 22886243 Review.
-
Nanobodies: natural single-domain antibodies.Annu Rev Biochem. 2013;82:775-97. doi: 10.1146/annurev-biochem-063011-092449. Epub 2013 Mar 13. Annu Rev Biochem. 2013. PMID: 23495938 Review.
Cited by
-
Bglbrick strategy for the construction of single domain antibody fusions.Heliyon. 2017 Dec 28;3(12):e00474. doi: 10.1016/j.heliyon.2017.e00474. eCollection 2017 Dec. Heliyon. 2017. PMID: 29322100 Free PMC article.
-
Enhanced production of a single domain antibody with an engineered stabilizing extra disulfide bond.Microb Cell Fact. 2015 Oct 9;14:158. doi: 10.1186/s12934-015-0340-3. Microb Cell Fact. 2015. PMID: 26449768 Free PMC article.
-
Nanoscale warriors against viral invaders: a comprehensive review of Nanobodies as potential antiviral therapeutics.MAbs. 2025 Dec;17(1):2486390. doi: 10.1080/19420862.2025.2486390. Epub 2025 Apr 9. MAbs. 2025. PMID: 40201976 Free PMC article. Review.
-
Selection and Characterization of Anti-Dengue NS1 Single Domain Antibodies.Sci Rep. 2018 Dec 27;8(1):18086. doi: 10.1038/s41598-018-35923-1. Sci Rep. 2018. PMID: 30591706 Free PMC article.
-
Evaluation of disulfide bond position to enhance the thermal stability of a highly stable single domain antibody.PLoS One. 2014 Dec 19;9(12):e115405. doi: 10.1371/journal.pone.0115405. eCollection 2014. PLoS One. 2014. PMID: 25526640 Free PMC article.
References
-
- Goebel SJ, Johnson GP, Perkus ME, Davis SW, Winslow JP, et al. (1990) The complete DNA-sequence of Vaccinia virus. Virology 179: 247–266. - PubMed
-
- Ravanello MP, Hruby DE (1994) Characterization of the vaccinia virus L1R myristylprotein as a component of the intracellular virion envelope. J Gen Virol 75: 1479–1483. - PubMed
-
- Aldaz-Carroll L, Whitbeck JC, de Leon MP, Lou H, Pannell LK, et al. (2005) Physical and immunological characterization of a recombinant secreted form of the membrane protein encoded by the vaccinia virus L1R gene. Virology 341: 59–71. - PubMed
Publication types
MeSH terms
Substances
LinkOut - more resources
Full Text Sources
Other Literature Sources
Research Materials
