Review
. 2014 Nov;88(11):1965-85.
doi: 10.1007/s00204-014-1357-9. Epub 2014 Sep 12.

Single-molecule tools for enzymology, structural biology, systems biology and nanotechnology: an update

Affiliations
Review

Single-molecule tools for enzymology, structural biology, systems biology and nanotechnology: an update

Julia R Widom et al. Arch Toxicol. 2014 Nov.

Abstract

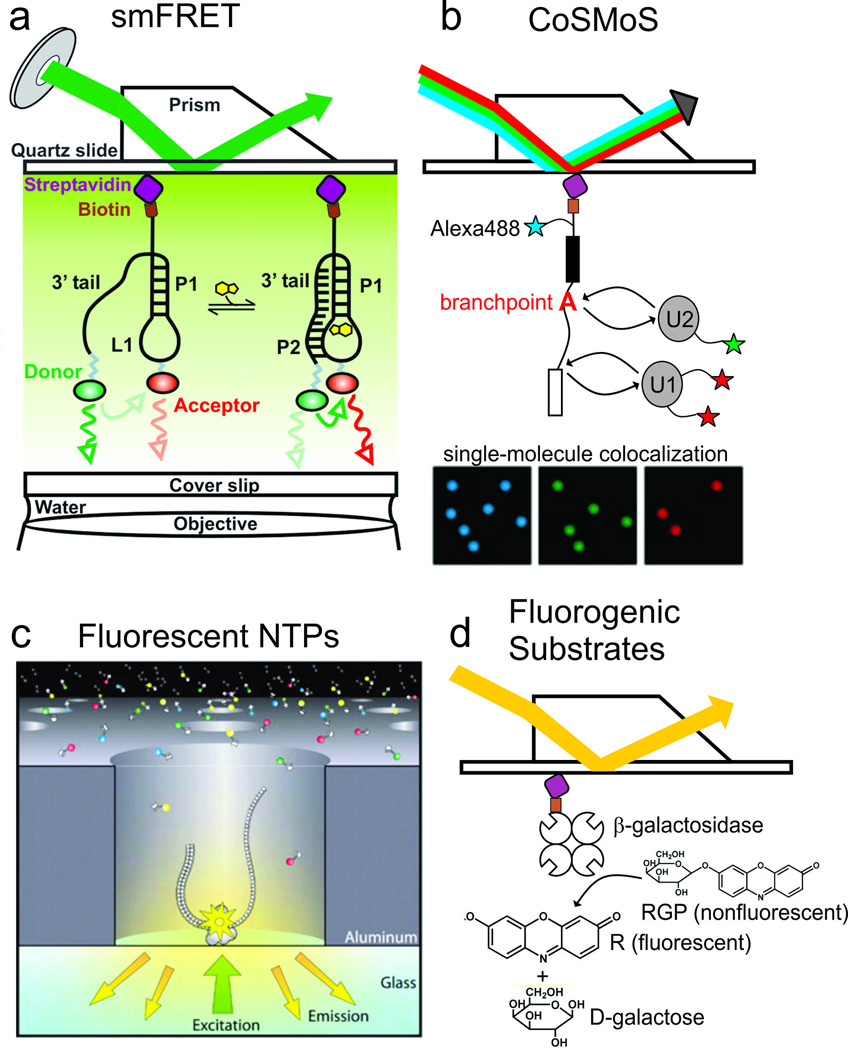
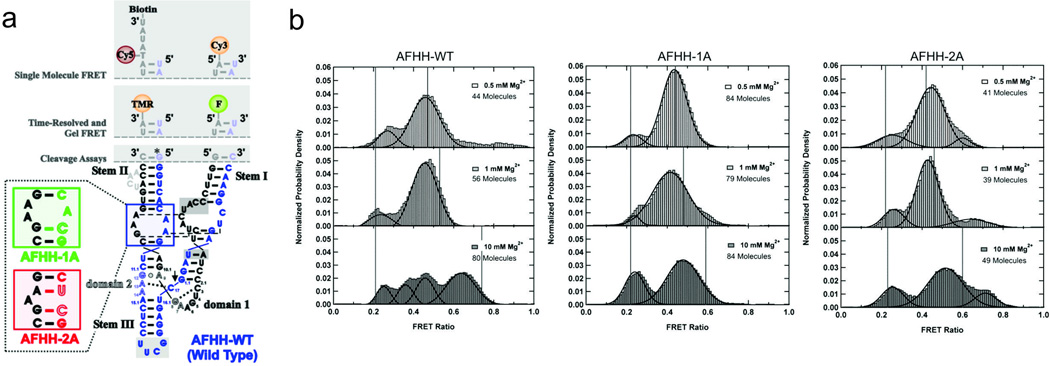
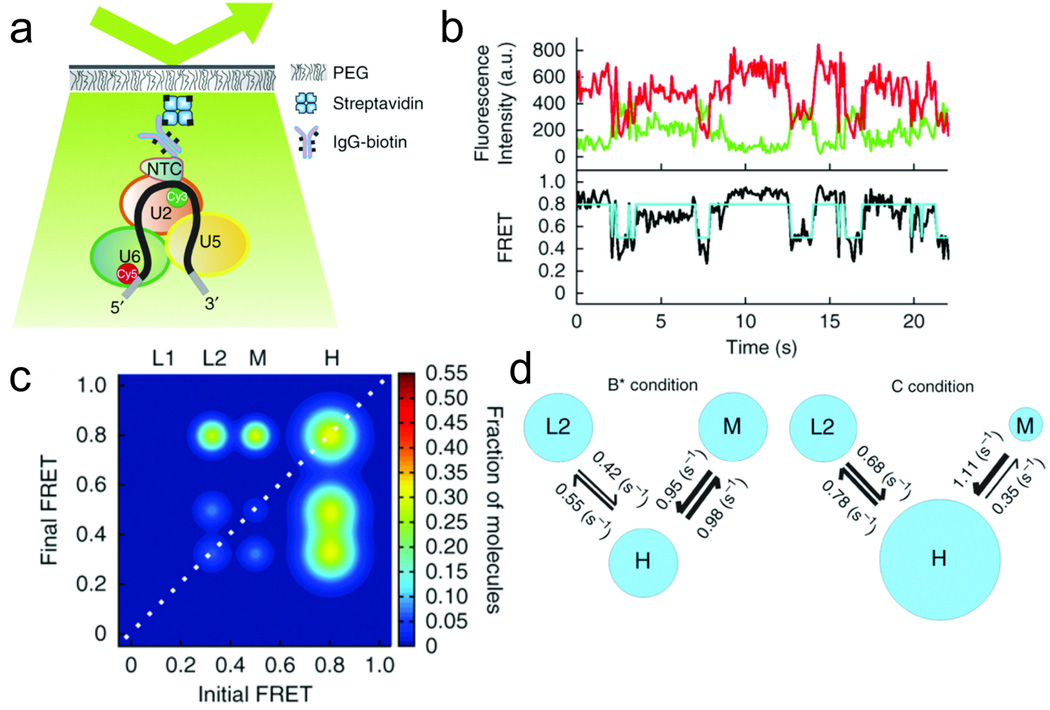
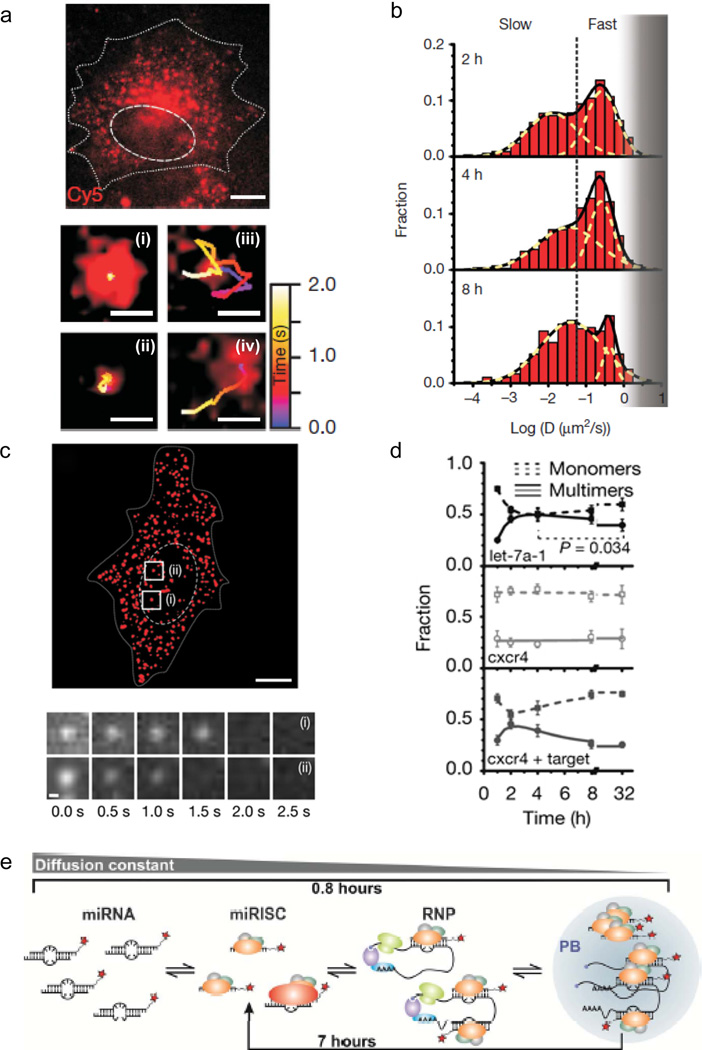
Toxicology is the highly interdisciplinary field studying the adverse effects of chemicals on living organisms. It requires sensitive tools to detect such effects. After their initial implementation during the 1990s, single-molecule fluorescence detection tools were quickly recognized for their potential to contribute greatly to many different areas of scientific inquiry. In the intervening time, technical advances in the field have generated ever-improving spatial and temporal resolution and have enabled the application of single-molecule fluorescence to increasingly complex systems, such as live cells. In this review, we give an overview of the optical components necessary to implement the most common versions of single-molecule fluorescence detection. We then discuss current applications to enzymology and structural studies, systems biology, and nanotechnology, presenting the technical considerations that are unique to each area of study, along with noteworthy recent results. We also highlight future directions that have the potential to revolutionize these areas of study by further exploiting the capabilities of single-molecule fluorescence microscopy.


Conflict of interest statement

CONFLICT OF INTEREST

The authors declare that they have no conflict of interest.

Figures

Fig. 1
Fig. 1
Single-molecule fluorescence optical setups and data collection. a Prism-based TIRF optical setup. b Objective-based TIRF optical setup. c Example experimental setup and fluorescence intensity trace for an experiment investigating binding and unbinding of fluorescently-labeled probes to an immobilized oligonucleotide. d Example experimental setup and data for an intracellular single-molecule high resolution localization and counting (iSHiRLoC) experiment investigating microRNA diffusion in live cells (Johnson-Buck and Walter 2014; Pitchiaya et al. 2013)
Fig. 2
Fig. 2
Single-molecule approaches used in enzymology and structural biology. a Single-molecule FRET, with the PreQ1 riboswitch as an example. b Colocalization single-molecule spectroscopy, applied to the assembly of the spliceosome. c Tracking DNA polymerase activity using fluorescently-labeled NTPs. d Visualizing enzymatic activity using fluorogenic substrates (Eid et al. 2009; Gorris et al. 2007; Hoskins et al. 2011; Suddala et al. 2013)
Fig. 3
Fig. 3
Single-molecule FRET investigation of the hammerhead ribozyme. a Full-length hammerhead ribozyme used in the studies discussed. The labeling sites for single-mol ecule FRET are indicated at the top, and the mutations used to disrupt loop-loop interactions are shown in the bottom-left. b Single-molecule FRET histograms showing the effect of magnesium concentration and loop mutations on the conformations adopted by wild-type (left panel) and two mutant (center and right panels) ribozymes. The active, high-FRET conformation is sampled only by the wild-type ribozyme, and only under high magnesium conditions (McDowell et al. 2010)
Fig. 4
Fig. 4
smFRET studies of splicing. a The spliceosome is immobilized on a slide through an affinity tag on the NTC. b Cy3 (green) and Cy5 (red) intensity traces of spliceosomes that had been stalled by a mutation in Prp2, then chased through step 1 of chemistry by the addition of active Prp2, Spp2, ATP and Cwc25. Under these conditions, the pre-mRNA explored mostly mid- and high-FRET states. The light blue trace in the lower plot is a hidden Markov model (HMM) fit to the FRET trace (black). c Transition occupancy density plot made from the HMM fits to 156 molecules under the conditions described in b. L1, L2, M and H indicate, respectively, low-FRET states 1 and 2, a mid-FRET state, and a high-FRET state. This plot shows that under these conditions, there is a population that dynamically samples states L2, M and H, and another population that exists stably in H. d Kinetic map showing the rate constants extracted for transitions between different FRET states under conditions that stall the spliceosome before step 1 of chemistry (“B* condition”) or after step 1 (“C condition”) (Krishnan et al. 2013)
Fig. 5
Fig. 5
Study of Bsu and Tte PreQ1 riboswitches using smFRET. a Crystal structures of the Bsu (colored) and Tte (grey) riboswitches, showing their close structural similarity. b Both riboswitches exhibited dynamically interconverting high- and low-FRET states, with the population of the high-FRET state increasing with increasing concentration of PreQ1 (upper pair of plots). In only the Tte riboswitch, however, the mean FRET values of the two states also changed with PreQ1 concentration (lower pair of plots). c These results, along with other experiments and modeling, suggested that the Tte riboswitch follows an induced fit mechanism of ligand-induced folding, while the Bsu riboswitch follows a conformational selection mechanism (Suddala et al. 2013)
Fig. 6
Fig. 6
Tracking and counting single miRNAs using iSHiRLoC. a Psuedocolored, live U2OS cell microinjected with miR-let-7a-1-Cy5 and imaged 4 h post-injection; miRNP particles exhibit very slow (i), corralled (ii), fast (iii), and biased (iv) Brownian diffusion. b Distribution of diffusion coefficient for let-7a-1-Cy5 at various time points. c Pseudocolored, fixed U2OS cell microinjected with miR-let-7a-1-Cy5 and imaged 4 h post-injection (top) and photobleaching steps detected by iSHiRLoC (bottom). d Particle counting time course reveals assembly of multimeric let-7a-1-Cy5 particles (top), but not cxcr4-Cy5 particles (middle). Co-injection of cxcr4-Cy5 with an mRNA target promotes assembly of multimeric cxcr4-Cy5 particles (bottom). e Model established using iSHiRLoC data of miRNA-mediated translational repression and degradation (Pitchiaya et al. 2012)
Fig. 7
Fig. 7
Tracking single mRNPs through the nuclear pore complex in HeLa cells using SPEED microscopy. a Wide-field epifluorescence illumination of four mCherry-tagged mRNPs (red) and GFP-nuclear envelope (green). b A successful mRNP export event through the NPC captured using SPEED microscopy. c An abortive mRNP export event. d, e Single particle tracks (black) and the centroid of the NPC (red) of successful and abortive mRNP export events through the NPC, as shown in b and c, respectively. f, g Export time distributions and single-exponential fit of successful (f) and abortive (g) mRNP export events through the NPC as shown in b and c, respectively (Ma et al. 2013)
Fig. 8
Fig. 8
Tracking a molecular spider that walks along an origami track. a Schematic of a DNAzyme-based molecular walker on a two-dimensional DNA track. b DNA origami landscape with positions A—E (left). The substrate track (brown), start position (green), stop and control positions (red) and imaging marker (blue) are highlighted. The middle panel shows the movement of the spider tracked by high-resolution fluorescence microscopy. The right panel shows the displacement of the spider trajectory from its initial position as a function of time (Lund et al. 2010)
Fig. 9
Fig. 9
Imaging of nanostructures using DNA-PAINT. a Schematic of single-molecule set up to monitor chemical changes by two-color DNA-PAINT. Abbreviations: Cy5-labeled ssDNA target ‘T1’, Cy3-labeled ssDNA target ‘T2’, streptavidin ‘STV’, and substrate ‘S’. b Effective volume overlap of neighboring strands on origami predicted by CanDo modeling. c Heterogeneous probe binding pattern revealed by two-color reconstructions of P strands on rectangular DNA origami (Johnson-Buck et al. 2013)

Similar articles

Cited by

References

    1. Abelson J, et al. Conformation dynamics of single pre-mRNA molecules in spliceosome assembly. Nat Struct Mol Biol. 2010;17:504–512. - PMC - PubMed
    1. Aitken CE, Petrov A, Puglisi JD. Single ribosome dynamics and the mechanism of translation. Annu Rev Biophys. 2010;39:491–513. - PubMed
    1. Alemán EA, Silva Cd, Patrich EM, Musier-Forsyth K, Rueda D. Single-molecule fluorescence using nucleotide analogues: a proof-of-principle. J Phys Chem Lett. 2014;5:777–781. - PMC - PubMed
    1. Alvarez-Dominguez JR, et al. Global discovery of erythroid long noncoding RNAs reveals novel regulators of red cell maturation. Blood. 2014;123:570–581. - PMC - PubMed
    1. Axelrod D, Burghardt TP, Thompson NL. Total internal reflection fluorescence. Annu Rev Biophys Bioeng. 1984;13:247–268. - PubMed

Publication types