

doi: 10.1007/s00216-014-8119-7.
Epub 2014 Sep 12.
N-Methyl-4-hydrazino-7-nitrobenzofurazan: a fluorogenic substrate for peroxidase-like DNAzyme, and its potential application
Affiliations
- PMID: 25213215
- PMCID: PMC4206775
- DOI: 10.1007/s00216-014-8119-7
Item in Clipboard
N-Methyl-4-hydrazino-7-nitrobenzofurazan: a fluorogenic substrate for peroxidase-like DNAzyme, and its potential application
Anal Bioanal Chem.
2014 Nov.
Abstract
Characterization and optimization studies of N-methyl-4-hydrazino-7-nitrobenzofurazan (MNBDH) as a new fluorogenic substrate in the peroxidation reaction catalyzed by DNAzyme are reported. The effects of pH, H2O2 concentration, metal-cation type, and the concentration and type of surfactant on the fluorescence intensity were investigated. The optimized reaction was subsequently used for the development of an assay for DNA detection based on a molecular-beacon probe. The use of a fluorogenic substrate enabled the detection of a single-stranded DNA target with a 1 nmol L(-1) detection limit.
Figures
ᅟ
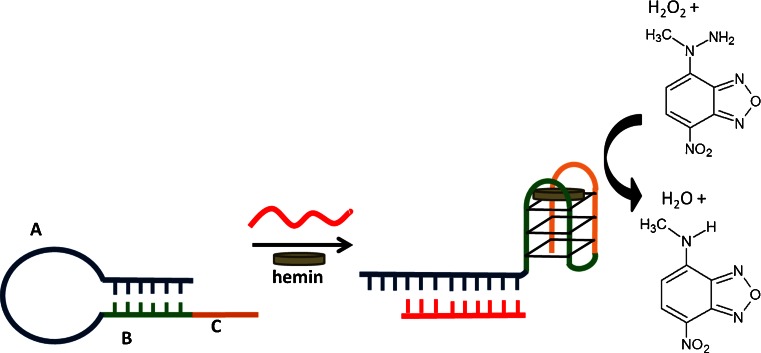
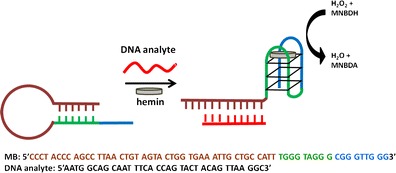
Scheme of the analytical approach for DNA detection based on a molecular-beacon probe that consists of the PS2.M sequence (domains B + C) and a domain A that is complementary to the analyte. The DNAzyme formed by the probe after analyte–DNA hybridization is able to catalyze MNBDH oxidation to MNBDA
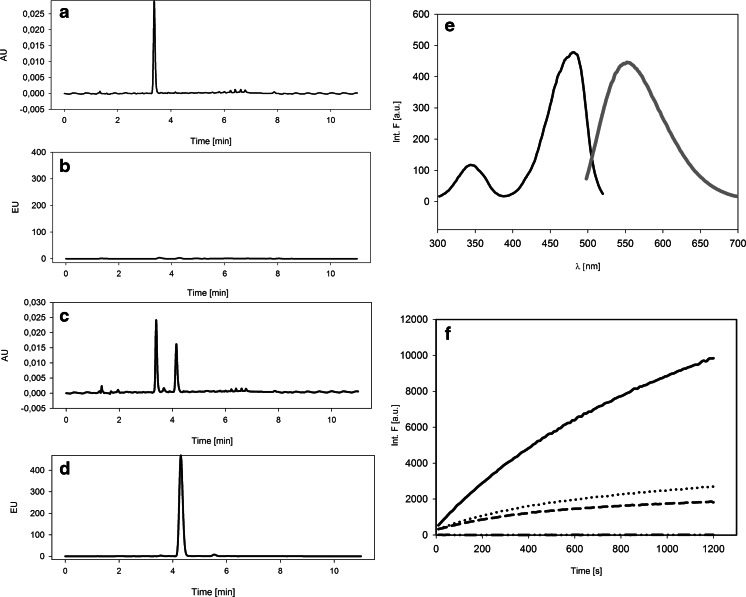
HPLC chromatogram of MNBDH with (a) colorimetric and (b) fluorescence detection. Chromatogram of MNBDH after the reaction catalyzed by DNAzyme, using the (c) colorimetric detector and (d) fluorescence detector. (e) Absorption (black) and fluorescence (gray) spectra of MNBDA: λ
ex = 450, λ
em = 540 nm, and 5-nm slits. (f) Dependence on time of the fluorescence intensity of the MNBDA for (a) 10 mmol L−1 Tris–HCl pH = 8.0, 100 mmol L−1 KCl (buffer A); (b) buffer A + 2 μmol L−1 hemin; (c) buffer A, 2 μmol L−1 hemin, 1 μmol L−1 HT; and (d) buffer A, 2 μmol L−1 hemin, 1 μmol L−1 PS2.M. All probes contained 100 μmol L−1 MNBDH, and the reaction was initiated by the injection of H2O2 into the final 100 μmol L−1 concentration. The kinetic traces were recorded for 20 min with 10 s intervals: λ
ex = 470, λ
em = 557 nm
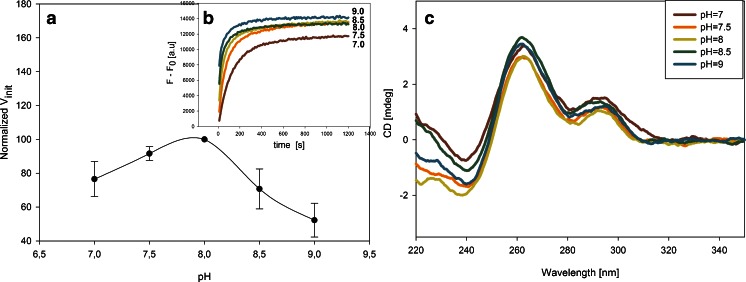
Effect of pH on the MNBDH oxidation catalyzed by DNAzyme based on the PS2.M sequence. (a) Dependence of the normalized initial rate on the pH of the reaction solution. (b) Kinetic profiles (fluorescence changes) of the MNBDA generated in the peroxidase reaction at selected pH values of 10 mmol L−1 Tris–HCl buffer (1 μmol L−1 G4 DNA, 2 μmol L−1 hemin, 100 mmol L−1 KCl, 100 μmol L−1 MNBDH, and 15 mmol L−1 H2O2). (c) CD spectra of the PS2.M quadruplex at different pH values (1 μmol L−1 DNA, 10 mmol L−1 Tris–HCl, and 100 mmol L−1 KCl)
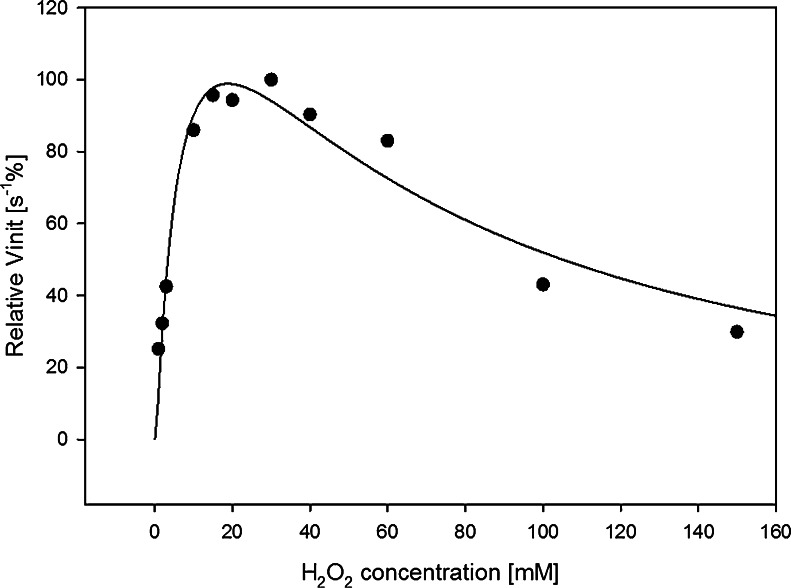
Effect of hydrogen peroxide on V
init of the DNAzyme-catalyzed oxidation of MNBDH. Conditions: 1 μmol L−1 PS2.M, 2 μmol L−1 hemin, 10 mmol L−1 Tris–HCl pH = 8.0, 100 μmol L−1 MNBDH, 100 mmol L−1 KCl, and 0.05 % Triton X-100. The remaining conditions are as in Fig. 3
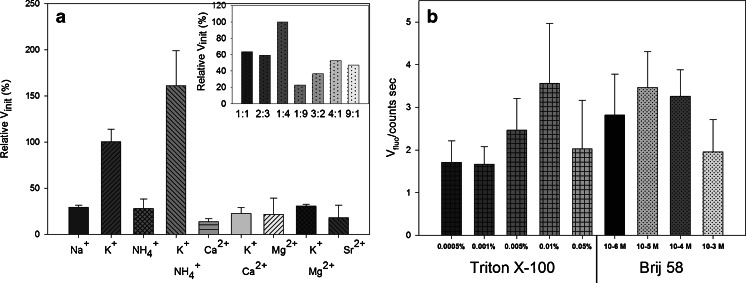
The effect of the type and concentration of cations (a) and surfactants (b) on the initial rate of the MNBDH oxidation catalyzed by the peroxidase-mimicking DNAzyme. (a) Relative initial velocity of the reaction in the samples containing different cations. Insert: the effect of the concentration ratio of K+/NH4
+ on the initial velocity. (b) Initial reaction rates for the systems containing the surfactants Triton X-100 and Brij 58 at the selected concentrations. All conditions are as in Fig. 3
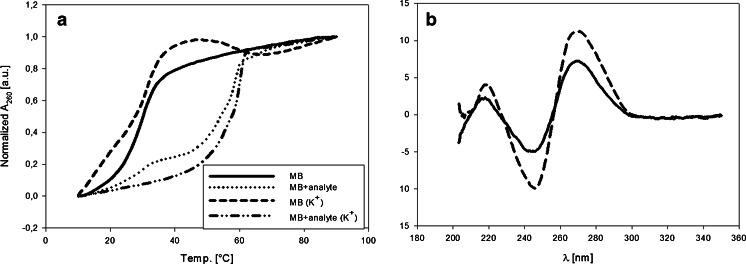
Characterization of the MB–analyte system. (a) Melting profiles of the MB systems in the absence and presence of 100 mmol L−1 potassium. The solid line represents MB alone, the dotted line represents MB with the analyte, the dashed line represents MB in the presence of potassium cations, and the dash-dot line represents MB as an analyte in the presence of K+. Conditions: 1 μmol L−1 DNA (MB or analyte), and 10 mmol L−1 Tris–HCl pH = 8.0. (b) CD spectra of MB (black) and MB + analyte (dashed): 1 μmol L−1 DNA, 10 mmol L−1 Tris–HCl pH = 8.0, and 100 mmol L−1 KCl
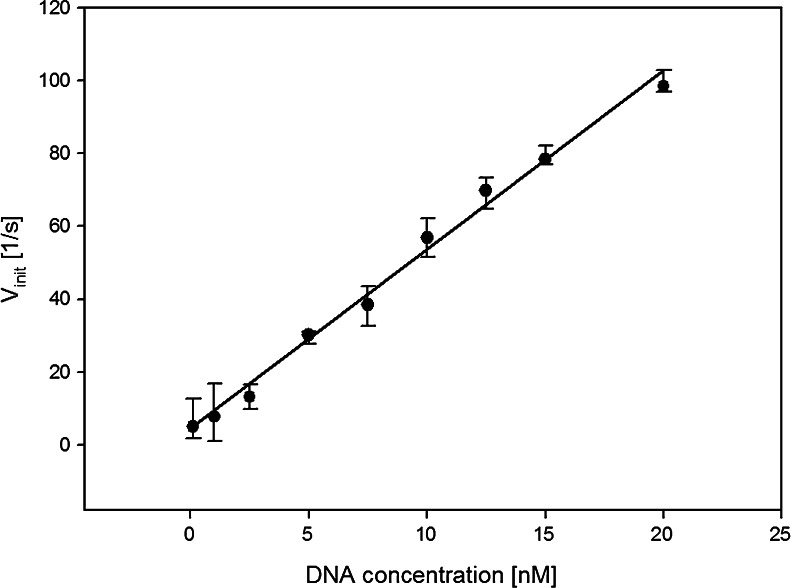
Analytical performance of the MB-probe-based DNAzyme fluorimetric DNA assay. Calibration curve for the DNA-analyte determination using the DNAzyme-based MB assay with the fluorogenic MNBDH substrate. Conditions: 20 nmol L−1 MB, 40 nmol L−1 hemin, 5 μmol L−1 MNBDH, and 1.5 mmol L−1 H2O2
Similar articles
-
A simple mix-and-read bacteria detection system based on a DNAzyme and a molecular beacon.Chem Commun (Camb). 2019 Jun 20;55(51):7358-7361. doi: 10.1039/c9cc03746b. Chem Commun (Camb). 2019. PMID: 31172143
-
Fluorogenic substrate screening for G-quadruplex DNAzyme-based sensors.Biosens Bioelectron. 2013 Nov 15;49:312-7. doi: 10.1016/j.bios.2013.05.034. Epub 2013 May 29. Biosens Bioelectron. 2013. PMID: 23792624
-
A quencher-free DNAzyme beacon for fluorescently sensing uranyl ions via embedding 2-aminopurine.Biosens Bioelectron. 2019 Jun 15;135:166-172. doi: 10.1016/j.bios.2019.04.021. Epub 2019 Apr 15. Biosens Bioelectron. 2019. PMID: 31009884
-
DNA-nanoparticle micelles as supramolecular fluorogenic substrates enabling catalytic signal amplification and detection by DNAzyme probes.Chem Commun (Camb). 2011 Jan 7;47(1):167-9. doi: 10.1039/c0cc02291h. Epub 2010 Sep 7. Chem Commun (Camb). 2011. PMID: 20830351
-
Peroxidase-mimicking DNAzymes for biosensing applications: a review.Anal Chim Acta. 2011 Nov 30;707(1-2):7-17. doi: 10.1016/j.aca.2011.08.050. Epub 2011 Sep 16. Anal Chim Acta. 2011. PMID: 22027115 Review.
References
-
- Briones C, Martin-Gago JA. Nucleic Acids and Their Analogs as Nanomaterials for Biosensor Development. Curr Nanosci. 2006;2:257–273. doi: 10.2174/1573413710602030257. - DOI
Publication types
MeSH terms
Substances
LinkOut - more resources
Full Text Sources
Other Literature Sources
