. 2014 Sep 26;345(6204):1623-1627.
doi: 10.1126/science.1255904. Epub 2014 Sep 11.

Immune dysregulation in human subjects with heterozygous germline mutations in CTLA4

Affiliations

Immune dysregulation in human subjects with heterozygous germline mutations in CTLA4

Hye Sun Kuehn et al. Science. .

Abstract

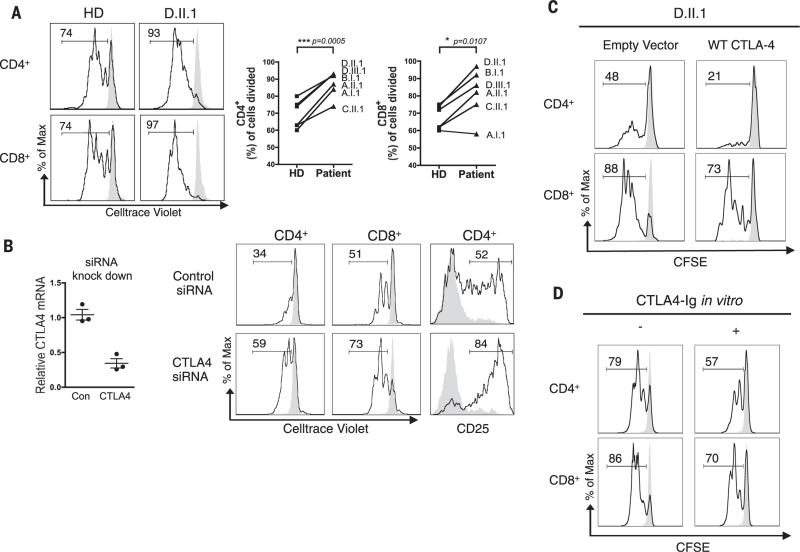
Cytotoxic T lymphocyte antigen-4 (CTLA-4) is an inhibitory receptor found on immune cells. The consequences of mutations in CTLA4 in humans are unknown. We identified germline heterozygous mutations in CTLA4 in subjects with severe immune dysregulation from four unrelated families. Whereas Ctla4 heterozygous mice have no obvious phenotype, human CTLA4 haploinsufficiency caused dysregulation of FoxP3(+) regulatory T (Treg) cells, hyperactivation of effector T cells, and lymphocytic infiltration of target organs. Patients also exhibited progressive loss of circulating B cells, associated with an increase of predominantly autoreactive CD21(lo) B cells and accumulation of B cells in nonlymphoid organs. Inherited human CTLA4 haploinsufficiency demonstrates a critical quantitative role for CTLA-4 in governing T and B lymphocyte homeostasis.


Figures

Fig. 1
Fig. 1. Clinical phenotype and pedigree of the patients
(A) Top: Computed tomography images of lung and brain from patient A.II.1. Bottom: Histological section (magnification 20×) from a duodenal biopsy from a healthy donor (HD) and patient A.II.1 stained for CD3 (brown cells), showing an increased number of transepithelial T cells within the villi. (B) Flow cytometric analyses of CD4+ cells or total lymphocytes stained for the indicated surface markers from a healthy donor and patient A.I.1. Data showing decreased CD45RA+CD62L+ naïve CD4+ T cells are representative of three patients (A.I.1, A.II.1, and B.I.1). Programmed cell death–1 (PD1) expression data shown are representative of five patients (A.I.1, A.II.1, B.I.1, C.II.1, and D.II.1) and three healthy donors. Data showing decreased circulating B cells are representative of two patients (A.I.1 and A.II.1). (C) Mutations in patient alleles displayed on a schematic of the four exons of CTLA4, pedigrees, and phenotype summary highlighting organs (gray) with inflammatory infiltrates and autoimmune cytopenias for affected family members.TM, transmembrane domain. (D) Protein and mRNA expression of CTLA-4 in Treg cells. Left: Levels of CTLA-4 expression in Treg cells (CD4+CD25+FoxP3+) were assessed by intracellular staining. The numbers in the upper right corner depict mean fluorescence intensity (MFI) of anti-CD152 (CTLA-4) staining. Dotted line indicates the peak of CTLA-4 expression in a healthy donor. Data shown are representative of three experiments. Right: Levels of CTLA4 mRNA in Treg cells (CD4+CD25+CD127lo) sorted from seven different healthy donors and four patients were measured by real-time PCR using the probe for CTLA4 transcript variant 1 (full length) and normalized to GAPDH. Data are means of replicates from six experiments. For relative gene expression, all data were normalized to the same HD.The horizontal lines indicate mean values from healthy donors or patients.
Fig. 2
Fig. 2. Abnormal Treg cell phenotype and function in patients
(A) Flow cytometric analysis of FoxP3 and CD25 in CD4+ T cells from healthy donor (HD) and patients. (B) Mean fluorescence intensity of FoxP3 and CD25 in CD4+ FoxP3+ T cells from healthy donors and patients. Data are means T SEM of replicates of indicated patient [A.I.1 (N = 7), A.II.1 (N = 1), B.I.1 (N = 2), C.II.1 (N = 2), D.II.1 (N = 4)] and 10 healthy donors.The N values represent number of replicates from each patient. ***P = 0.0007 (Mann-Whitney test). Bar graph: Percentage of CD25+ and CD25 cells among CD4+FoxP3+ in 10 healthy donors and five patients. (C) Autologous and heterologous suppressive activities of Treg cells from five healthy donors and four patients (A.I.1, B.I.1, C.II.1, and D.II.1). The horizontal lines indicate the mean values. Data are from three experiments, with each indicated patient paired with one or two healthy donors. *P = 0.0239, **P = 0.0037 (paired t test).
Fig. 3
Fig. 3. CTLA-4 deficiency leads to a Tcell hyperproliferative phenotype
(A) Proliferation of PBMCs obtained from healthy donors or patients. PBMCs were stained with CellTrace violet and stimulated with (black line) or without (gray) anti-CD3 and anti-CD28. Numbers indicate percentage of cells having undergone at least one cellular division, assessed by dye dilution. Graphs at right indicate percentages of cells divided from healthy donor and patient in pairs. Data are shown as in (A) and are from five experiments with a healthy donor and indicated patient tested in pairs. *P = 0.0107, ***P = 0.0005 (paired t test). (B) Proliferation of PBMCs with CTLA4 knockdown. Healthy donor PBMCs were transfected with control (Con) or CTLA4 siRNA. Knockdown efficiency was evaluated using real-time PCR (left). Data are means ± SEM from three experiments, each with a different healthy donor. Cells were then assessed for proliferation and CD25 expression. Data shown are representative of three experiments with three healthy donors tested. (C) Reconstitution of wild-type CTLA-4 in patient cells. Patient D.II.1 PBMCs were transfected with control vector (pDsRed-N1) or CTLA-4–DsRed-N1 vector. Proliferation of DsRed+ CD4 and CD8 patient Tcells. Data shown are representative of three experiments with a total of three patients (B.I.1, C.II.1, D.II.1). (D) Effect of in vitro treatment with CTLA-4–Ig on proliferation of PBMCs. Patient D.III.1 PBMCs were stimulated with anti-CD3 in the presence (+) or absence (–) of CTLA-4–Ig. Data shown are representative of three experiments with a total of three patients (B.I.1, D.II.1, and D.III.1). Percentages of cells having undergone at least one cellular division are indicated in each histogram. Gray peak shows unstimulated cells.
Fig. 4
Fig. 4. Abnormal B cell phenotype in patients
(A) Percentages of B cells for patients A.I.1, A.II.1, B.I.1, C.II.1, D.II.1, and D.III.1; horizontal lines indicate means ± SD. **P = 0.0047 (Mann-Whitney test). (B) Absolute B cell numbers in blood for the indicated patients. Dotted lines indicate lower limit of normal range from the healthy donors. (C) B cells were labeled with antibodies to CD19, CD20, CD27, and CD10. Top panel: Proportions of B cells corresponding to transitional (CD10+CD27), naïve (CD10CD27), or memory (CD10CD27+) subsets. Middle and bottom panels: Abnormal accumulation of CD19hiCD21lo B cells within the population of CD20+CD10CD27 B cells (middle) and CD20+CD27 B cells (bottom) in CTLA-4–deficient patients compared to a healthy donor. (D) Enriched CD19+ cells (HD1 and A.I.1) or total PBMCs (HD2, HD3, A.II.1, C.II.1, and D.II.1) were stimulated with F(ab′)2 specific for anti-IgM, IL-4, and CD40 ligand. CD19+ cell proliferation was assessed by dye dilution.

Comment in

References

    1. Bluestone JA, et al. Nat. Rev. Immunol. 2010;10:797–803. - PubMed
    1. Goodnow CC. Cell. 2007;130:25–35. - PubMed
    1. Sakaguchi S, Yamaguchi T, Nomura T, Ono M. Cell. 2008;133:775–787. - PubMed
    1. Josefowicz SZ, Lu LF, Rudensky AY. Annu. Rev. Immunol. 2012;30:531–564. - PMC - PubMed
    1. Benoist C, Mathis D. Cold Spring Harb. Perspect. Biol. 2012;4:a007021. - PMC - PubMed

Publication types

Associated data