. 2014 Oct 10;346(6206):248-51.
doi: 10.1126/science.1256729. Epub 2014 Sep 11.

Sister kinetochores are mechanically fused during meiosis I in yeast

Affiliations

Sister kinetochores are mechanically fused during meiosis I in yeast

Krishna K Sarangapani et al. Science. .

Abstract

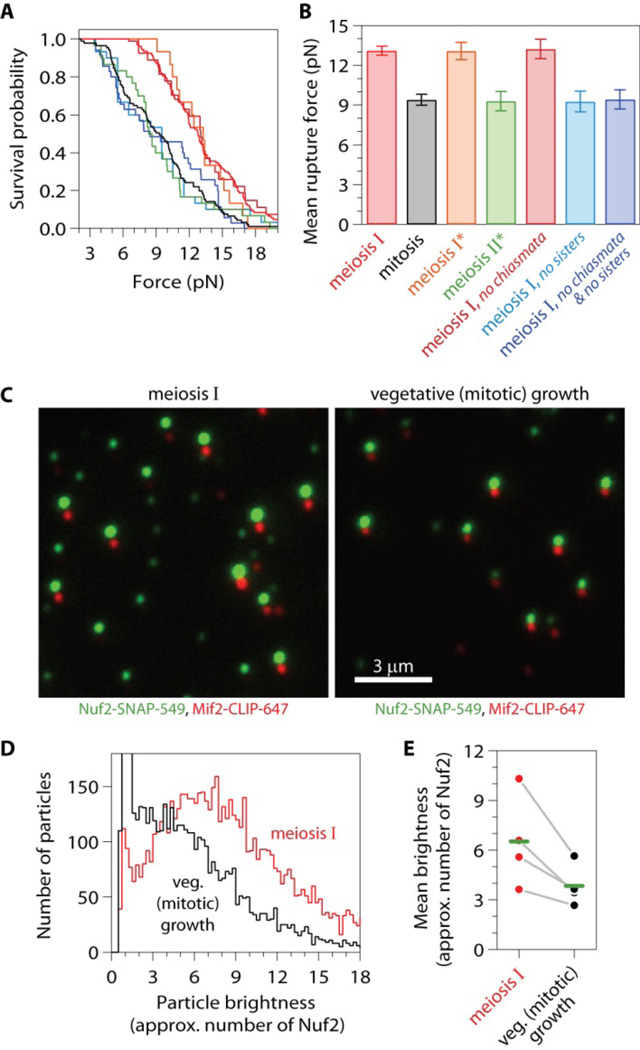
Production of healthy gametes requires a reductional meiosis I division in which replicated sister chromatids comigrate, rather than separate as in mitosis or meiosis II. Fusion of sister kinetochores during meiosis I may underlie sister chromatid comigration in diverse organisms, but direct evidence for such fusion has been lacking. We used laser trapping and quantitative fluorescence microscopy to study native kinetochore particles isolated from yeast. Meiosis I kinetochores formed stronger attachments and carried more microtubule-binding elements than kinetochores isolated from cells in mitosis or meiosis II. The meiosis I-specific monopolin complex was both necessary and sufficient to drive these modifications. Thus, kinetochore fusion directs sister chromatid comigration, a conserved feature of meiosis that is fundamental to Mendelian inheritance.


Figures

Fig. 1
Fig. 1. Native kinetochore particles from meiotic cells recapitulate tip-coupling in vitro
(A) Core kinetochore proteins co-purified from cells undergoing vegetative (mitotic) growth and cells arrested in metaphase I of meiosis, visualized by silver-stained SDS-PAGE (9). Mif2 (†) co-migrates with non-specific background proteins (8). (B) Kymograph showing movement of fluorescent meiosis I kinetochore particles (green) driven by a disassembling microtubule (red; see Movie S1). Filled arrowheads mark tip-particle encounters, open arrowhead marks particle release. Inset shows images at indicated times. (C) Position versus time for tip-attached meiosis I particles tested with a force clamp at indicated loads. Arrows mark catastrophes and rescue. Intervals when the laser trap was briefly shuttered (to clear debris) appear as gaps in the 1 and 7 pN traces. Inset shows schematic of assay (9). (D) Tensile force versus time for indicated particles bound to assembling tips and tested with a 0.25 pN s−1 force ramp. Gray dots show raw data. Colored traces show same data after smoothing (500–ms sliding boxcar average). Dashed vertical lines mark start of force ramp. Arrows mark rupture.
Fig. 2
Fig. 2. Meiosis I kinetochore particles are stronger and brighter
(A) and (B) Distributions of rupture force (A) and mean rupture force values (B) for indicated kinetochore particles (color matched). Asterisks (*) indicate particles from cells undergoing meiosis synchronized by release from a prophase I block. Error bars represent s.e.m. (N = 15–107 ruptures). (C) Fluorescence images of particles carrying Nuf2-SNAP-549 (green) and Mif2-CLIP-647 (red) bound to coverslips. Colors are offset slightly; green/red pairs represent colocalized, dual-color particles. (D) Distributions of Nuf2 brightness for dual-color particles (N > 4,900) relative to the brightness of a single Nuf2. (E) Mean Nuf2 brightnesses for dual-color particles from four pairs of kinetochore preparations. Points are means from individual preparations; gray lines connect means from particles prepared in tandem (9); green horizontal lines are means across all preparations.
Fig. 3
Fig. 3. Monopolin is necessary for the high strength of meiosis I kinetochore particles, and sufficient in vivo
(A) and (B) Distributions of rupture force (A) and mean rupture force values (B) for indicated kinetochore particles (color matched). Data for particles from meiosis I (red), from meiosis I without chiasmata (dark red), and from mitosis (black) are replotted from Figs. 2A and 2B for comparison. Error bars represent s.e.m. (N = 21–118 ruptures).
Fig. 4
Fig. 4. Pure recombinant monopolin is sufficient to increase the strength and brightness of kinetochore particles in vitro
(A) and (B) Distributions of rupture force (A) and mean rupture force values (B) for kinetochore particles (color matched) after incubation with recombinant monopolin (at molar ratio 1.8 versus Dsn1-His-Flag; ‘+’). Data for particles without monopolin incubation (‘−’ in B) are replotted from Figs 3A and 3B for comparison. Error bars represent s.e.m. (N = 17–118 ruptures). (C) Mean rupture forces for meiosis I, mam1Δ kinetochore particles after incubation with indicated amounts of recombinant monopolin (9). Filled circles are data from particles pre-incubated with monopolin before linking to polystyrene laser trapping beads. Open circle shows control in which particles were first linked to trapping beads and subsequently incubated with monopolin. Error bars represent s.e.m. (N = 28–118 ruptures). Dashed lines are means for mitotic (black) and meiosis I (red) particles (from Fig. 2B). (D) Mean Nuf2 brightnesses for dual-color particles isolated from cells undergoing vegetative (mitotic) growth, incubated with indicated amounts of recombinant monopolin. Error bars represent s.d. (N = 2–3 experiments). Dashed lines are mean brightnesses for dual-color vegetative (black) and meiosis I (red) kinetochore particles prepared on the same day, without monopolin incubation (from Fig. 2E).

References

    1. Corbett KD, et al. Cell. 2010;142:556. - PMC - PubMed
    1. Li X, Dawe RK. Nat Cell Biol. 2009;11:1103. - PubMed
    1. Goldstein LS. Cell. 1981;25:591. - PubMed
    1. Paliulis LV, Nicklas RB. J Cell Biol. 2000;150:1223. - PMC - PubMed
    1. Monje-Casas F, Prabhu VR, Lee BH, Boselli M, Amon A. Cell. 2007;128:477. - PMC - PubMed

Publication types

MeSH terms