

Genome-wide interaction of genotype by erythrocyte n-3 fatty acids contributes to phenotypic variance of diabetes-related traits
- PMID: 25213455
- PMCID: PMC4168207
- DOI: 10.1186/1471-2164-15-781
Genome-wide interaction of genotype by erythrocyte n-3 fatty acids contributes to phenotypic variance of diabetes-related traits
Abstract
Background: Little is known about the interplay between n-3 fatty acids and genetic variants for diabetes-related traits at the genome-wide level. The present study aimed to examine variance contributions of genotype by environment (GxE) interactions for different erythrocyte n-3 fatty acids and genetic variants for diabetes-related traits at the genome-wide level in a non-Hispanic white population living in the U.S.A. (n = 820). A tool for Genome-wide Complex Trait Analysis (GCTA) was used to estimate the genome-wide GxE variance contribution of four diabetes-related traits: HOMA-Insulin Resistance (HOMA-IR), fasting plasma insulin, glucose and adiponectin. A GxE genome-wide association study (GWAS) was conducted to further elucidate the GCTA results. Replication was conducted in the participants of the Boston Puerto Rican Health Study (BPRHS) without diabetes (n = 716).
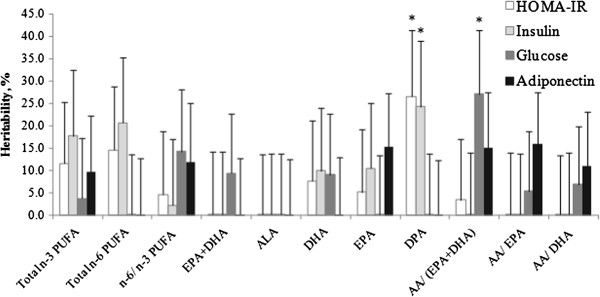
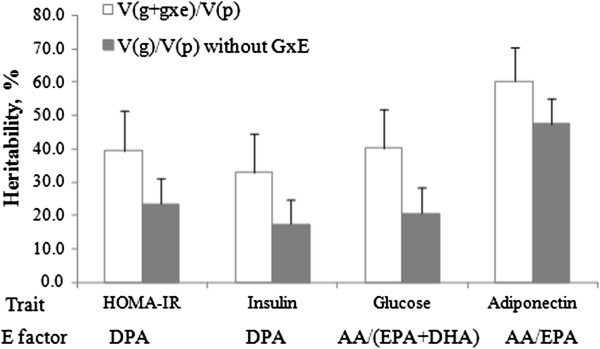
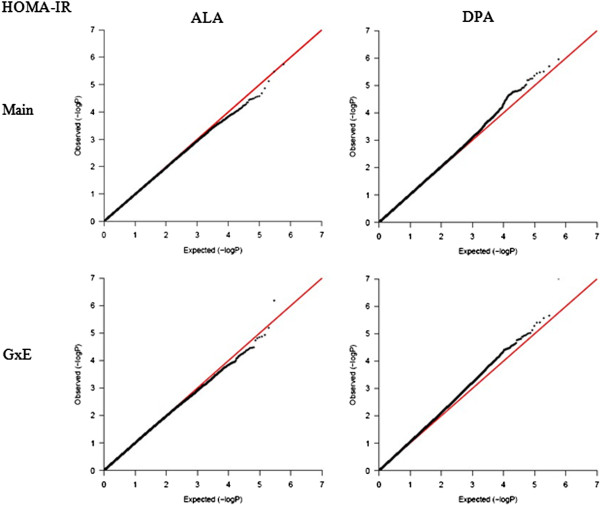
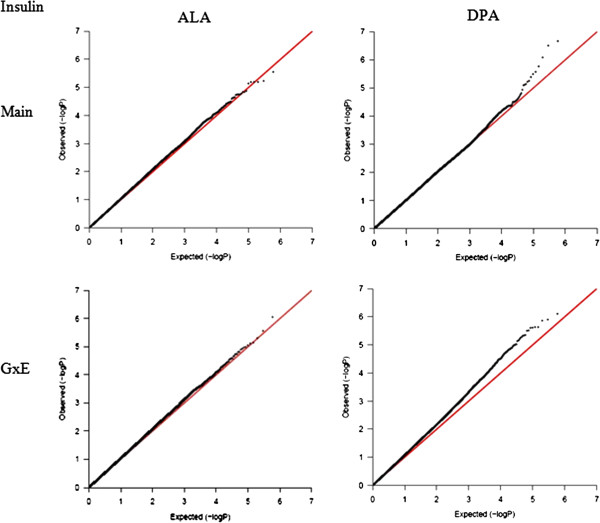
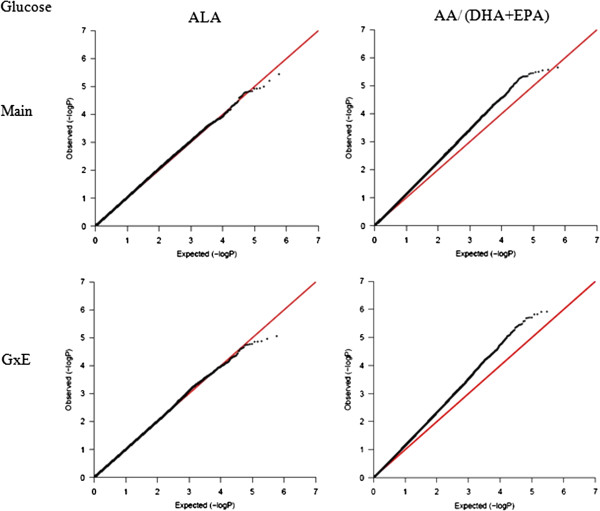
Results: In GOLDN, docosapentaenoic acid (DPA) contributed the most significant GxE variance to the total phenotypic variance of both HOMA-IR (26.5%, P-nominal = 0.034) and fasting insulin (24.3%, P-nominal = 0.042). The ratio of arachidonic acid to eicosapentaenoic acid + docosahexaenoic acid contributed the most significant GxE variance to the total variance of fasting glucose (27.0%, P-nominal = 0.023). GxE variance of the arachidonic acid/eicosapentaenoic acid ratio showed a marginally significant contribution to the adiponectin variance (16.0%, P-nominal = 0.058). None of the GCTA results were significant after Bonferroni correction (P < 0.001). For each trait, the GxE GWAS identified a far larger number of significant single-nucleotide polymorphisms (P-interaction ≤ 10E-5) for the significant E factor (significant GxE variance contributor) than a control E factor (non-significant GxE variance contributor). In the BPRHS, DPA contributed a marginally significant GxE variance to the phenotypic variance of HOMA-IR (12.9%, P-nominal = 0.068) and fasting insulin (18.0%, P-nominal = 0.033).
Conclusion: Erythrocyte n-3 fatty acids contributed a significant GxE variance to diabetes-related traits at the genome-wide level.
Figures

References
Publication types
MeSH terms
Substances
Grants and funding
- R01 HL091357/HL/NHLBI NIH HHS/United States
- P01AG023394/AG/NIA NIH HHS/United States
- P50HL105185/HL/NHLBI NIH HHS/United States
- R01 HL078885/HL/NHLBI NIH HHS/United States
- HL54776/HL/NHLBI NIH HHS/United States
- U01 HL072524/HL/NHLBI NIH HHS/United States
- HL078885/HL/NHLBI NIH HHS/United States
- L60 MD003562/MD/NIMHD NIH HHS/United States
- R01 HL054776/HL/NHLBI NIH HHS/United States
- K08 HL112845/HL/NHLBI NIH HHS/United States
- P50 HL105185/HL/NHLBI NIH HHS/United States
- P01 AG023394/AG/NIA NIH HHS/United States
LinkOut - more resources
Full Text Sources
Other Literature Sources
Medical
Molecular Biology Databases
