. 2014 Sep 13:7:65.
doi: 10.1186/s13041-014-0065-y.

Elevation of brain magnesium prevents synaptic loss and reverses cognitive deficits in Alzheimer's disease mouse model

Affiliations

Elevation of brain magnesium prevents synaptic loss and reverses cognitive deficits in Alzheimer's disease mouse model

Wei Li et al. Mol Brain. .

Abstract

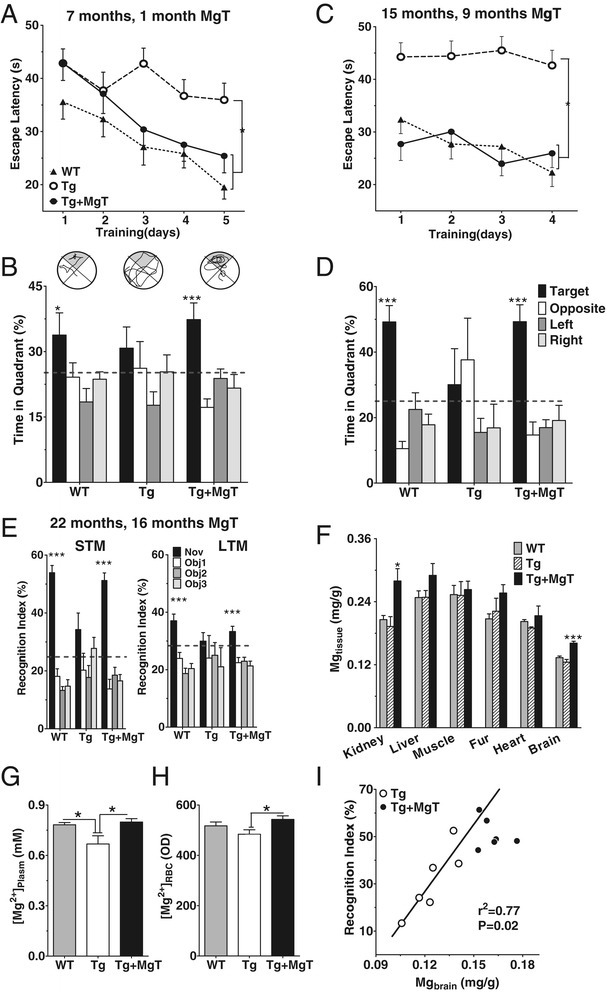
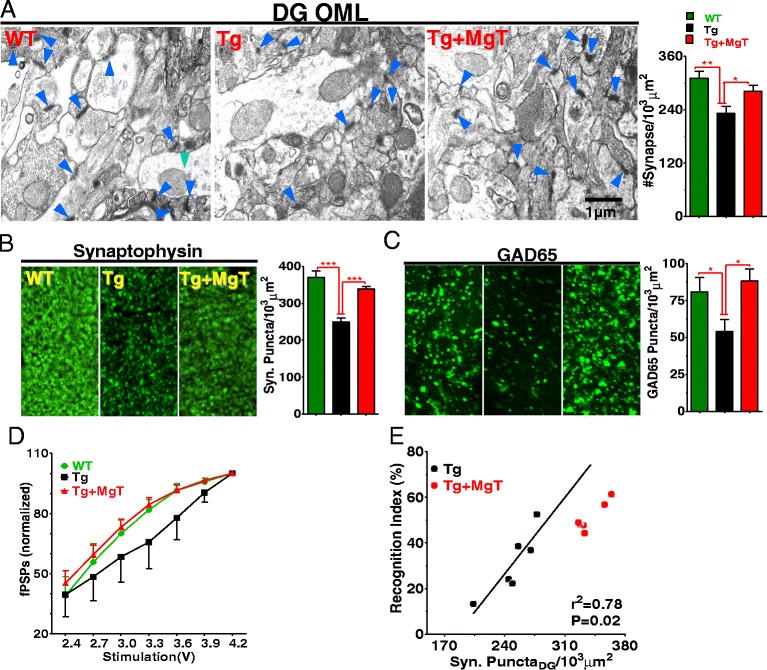
Background: Profound synapse loss is one of the major pathological hallmarks associated with Alzheimer's disease, which might underlie memory impairment. Our previous work demonstrates that magnesium ion is a critical factor in controlling synapse density/plasticity. Here, we tested whether elevation of brain magnesium, using a recently developed compound (magnesium-L-threonate, MgT), can ameliorate the AD-like pathologies and cognitive deficits in the APPswe/PS1dE9 mice, a transgenic mouse model of Alzheimer's disease.

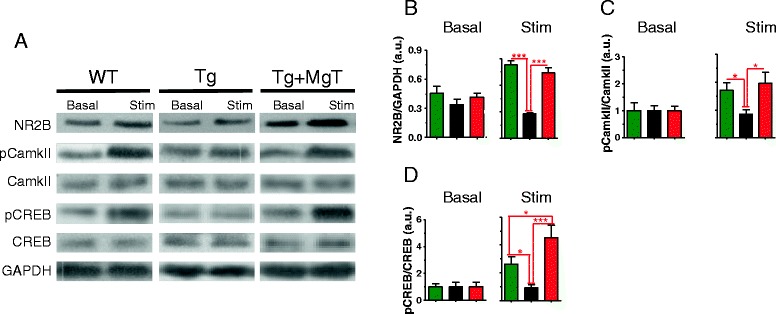
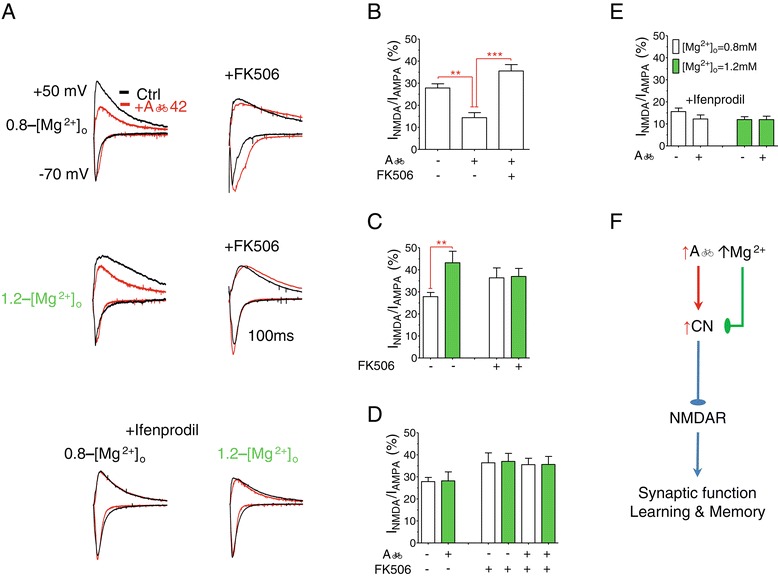
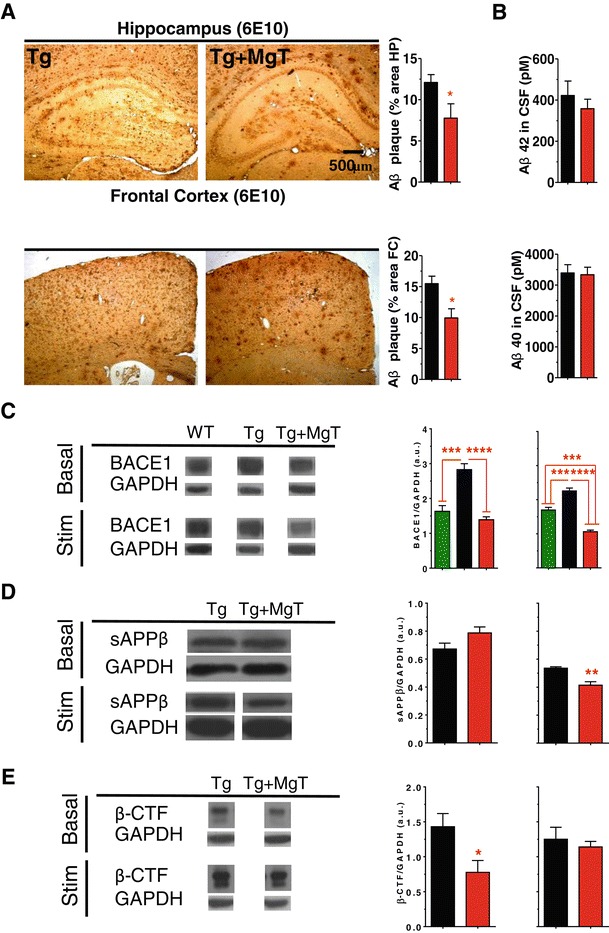
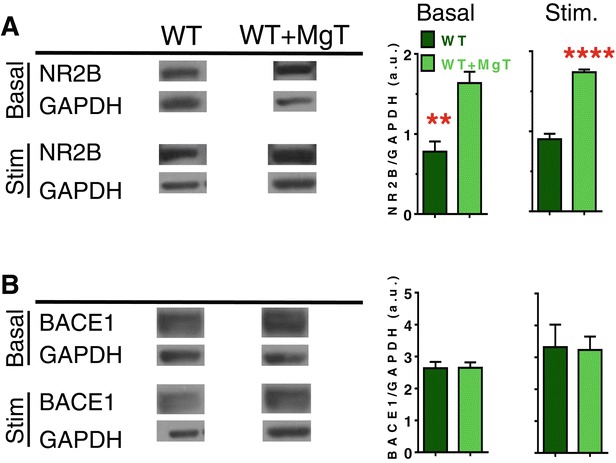
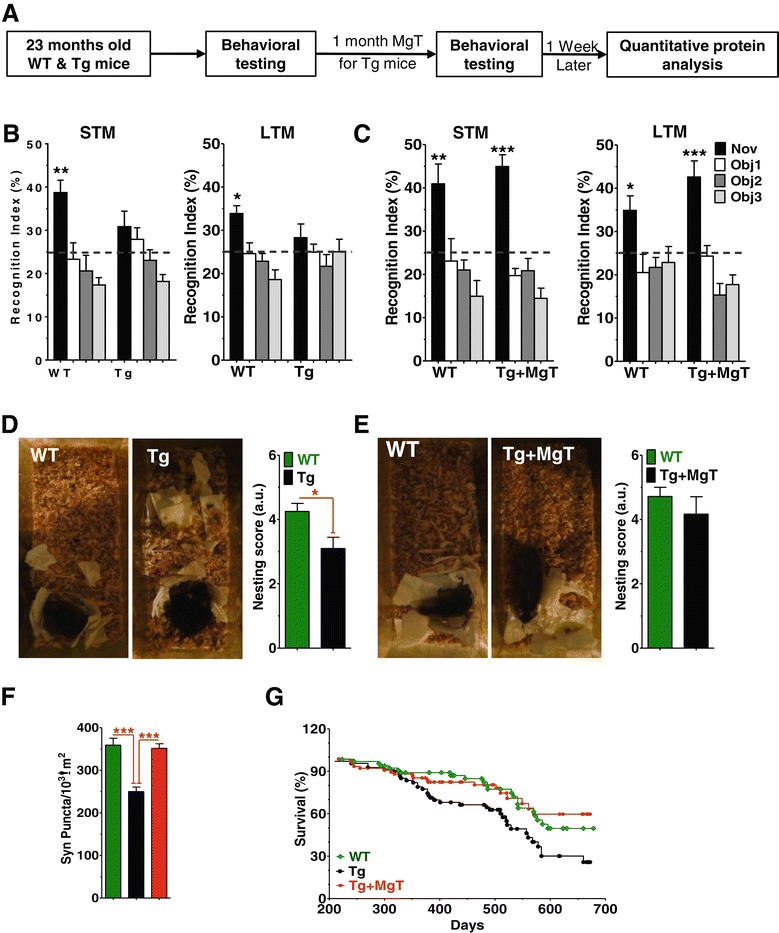
Results: MgT treatment reduced Aβ-plaque, prevented synapse loss and memory decline in the transgenic mice. Strikingly, MgT treatment was effective even when the treatment was given to the mice at the end-stage of their Alzheimer's disease-like pathological progression. To explore how elevation of brain magnesium ameliorates the AD-like pathologies in the brain of transgenic mice, we studied molecules critical for APP metabolism and signaling pathways implicated in synaptic plasticity/density. In the transgenic mice, the NMDAR signaling pathway was downregulated, while the BACE1 expression were upregulated. MgT treatment prevented the impairment of these signaling pathways, stabilized BACE1 expression and reduced sAPPβ and β-CTF in the transgenic mice. At the molecular level, elevation of extracellular magnesium prevented the high Aβ-induced reductions in synaptic NMDARs by preventing calcineurin overactivation in hippocampal slices.

Conclusions: Our results suggest that elevation of brain magnesium exerts substantial synaptoprotective effects in a mouse model of Alzheimer's disease, and hence it might have therapeutic potential for treating Alzheimer's disease.


Figures

Figure 1
Figure 1
Prevention of memory deficits in APPswe/PS1dE9 transgenic mice (Tg mice) by MgT treatment. (A) Escape latencies in seconds(s) during training (5 trials/day) in water maze task at 7 months of age, i.e., after 1 month of treatment. Three groups of mice were used; WT (n = 9), Tg (n = 13) and Tg + MgT (n = 9; ANOVA effect of treatment, p < 0.05). (B) Probe test conducted 24 h after the training. Top, representative path tracings. Bottom, percentage of time spent in each quadrant (ANOVA differences among quadrants; WT: p < 0.05; Tg + MgT: p < 0.0001). (C) Same as (A) and on the same mice, but tested at 15 months of age. WT (n = 9); Tg (n = 7); Tg + MgT (n = 6). ANOVA effect of treatment p < 0.05. (D) Probe test 24 h later (ANOVA differences among quadrants: WT: p < 0.0001; Tg + MgT: p < 0.0001). (E) Short-term (10 m in retention interval, left) and long-term (24 h, right) novel-object recognition memory tests performed on the same group of mice at 22 months of age. WT (n = 7), Tg (n = 6), and Tg + MgT (n = 6). Recognition index calculated as percentage of time spent exploring each object (Obj1-3). Black bars indicate novel object (Nov). ANOVA differences in recognition index of different objects in WT (STM: p < 0.0001; LTM: p < 0.0001) and Tg + MgT (STM: p < 0.0001; LTM: p < 0.001). Dashed lines represent chance levels of performance (25%). (F) Total magnesium (ionized and non-ionized) contents in different organs/tissues (Mgtissue) normalized to tissue weight (mg/g) in the same groups of mice. WT (n = 7), Tg (n = 6) and Tg + MgT (n = 6). ANOVA difference among groups (brain: p < 0.0001; kidney: p < 0.01). (G) Magnesium ion concentration in the plasma ([Mg2+]plasma, mM) of WT (n = 14), Tg (n = 9) and Tg + MgT mice (n = 8) as measured by the calmagite method. ANOVA difference among groups (p < 0.01). (H) The intracellular free Mg2+ concentration in the red blood cell ([Mg2+]RBC) of WT (n = 12), Tg (n = 11) and Tg + MgT mice (n = 11) as measured by the flow cytometry method (fluorescent optical density, OD). ANOVA difference among groups (p < 0.05). ANOVA was followed by Bonfferoni’s post hoc test. (I) Brain total magnesium content (Mgbrain, mg/g), in Tg mice (23 months old), significantly correlated with the recognition index in the short-term recognition memory test (Pearson’s test). Data from Tg + MgT mice (23 months old treated for 17 months) are displayed, but were not included in the correlation analysis. Error bars show SEM. * p < 0.05, *** p < 0.001.
Figure 2
Figure 2
Prevention by MgT treatment of synapse loss in APPswe/PS1dE9 transgenic mice (Tg mice). (A) Left: electron microscopic images showing structural synapses (blue arrows) in hippocampal outer molecular layer of dentate gyrus (DG-OML). Right: Estimated synaptic density. WT (n = 6), Tg (n = 6) and Tg + MgT (n = 5). (B) Left: Immunostaining of synaptophysin-positive terminals (Syn Puncta) in DG-OML. Right: Quantitative analysis of Syn Puncta (n = 6/group). (C) Same as in (B) and from same groups of mice; however, puncta represent GABAergic (GAD65). (D) Input–output (normalized) relationship of hippocampal CA1 synapses in vivo (n = 6/group). Field post synaptic potentials (fPSPs) were normalized by the maximum amplitude of fPSPs. Two Way ANOVA revealed significant effects of treatment: p < 0.05; and stimulus: p < 0.0001. (E) Correlation between the density of Syn Puncta and short-term recognition memory in Tg mice (23 months old). Tg + MgT (23 months old treated for 17 months) data are displayed but were not included in the regression analysis (Pearson’s test). Error bars show SEM. * p < 0.05, ** p < 0.01, *** p < 0.001.
Figure 3
Figure 3
Prevention by MgT treatment of impairment in NMDAR signaling pathway in APPswe/PS1dE9 transgenic mice (Tg mice). (A) Representative Western blots showing the expression levels of NR2B, pCaMKII, CaMKII, pCREB, and CREB in the hippocampus of mice sacrificed either after home-cage conditions (basal) or following 24 h of environmental enrichment-based behavioral stimulation (Stim). GAPDH expression served as loading control. (B) Left: Quantitative analysis of NR2B expression in the hippocampus of WT, Tg and Tg + MgT mice (n = 5/group), obtained by Western blot (arbitrarily units, a.u.). Mice were sacrificed under basal conditions without behavioral stimulation. Right: Quantitative analysis of NR2B expression the hippocampus of WT (n = 6), Tg (n = 6) and Tg + MgT mice (n = 5) obtained by Western blot following behavioral stimulation. (C and D) same as (B) but quantifying Phosphorylated CaMKII (pCaMKII)/CaMKII ratio (C) and Phosphorylated CREB (pCREB)/CREB ratio (D). ANOVAs (Table 2) were followed by Bonferroni’s post hoc test. Error bars show SEM. * p < 0.05, *** p < 0.001.
Figure 4
Figure 4
Prevention of exogenous Aβ 42-induced downregulation of synaptic NMDARs by elevation of [Mg 2+ ] o . (A) Top panel: Representative traces of EPSCs recorded at membrane potentials of −70 and +50 mV at 0.8 mM [Mg2+]o (0.8-[Mg2+]o) before (black) and after (red) application of Aβ42 with (right) or without (left) the addition of calcineurin inhibitor (FK506). Middle panel: Same as above but at 1.2 mM [Mg2+]o (1.2-[Mg2+]o). Lower panel: EPSCs at 0.8 and 1.2 mM [Mg2+]o with and without Aβ42 monomers in the presence of NR2B blocker (ifenprodil). (B) The ratio of amplitudes of EPSCNMDAR to EPSCAMPA (INMDA/AMPA) in 0.8-[Mg2+]o (n = 8), 0.8-[Mg2+]o + Aβ42 (n = 7) and 0.8-[Mg2+]o + Aβ42 + FK506 (n = 8) slices. ANOVA revealed significant difference among the groups (p < 0.0001). ANOVA was followed by Bonferroni’s post hoc test. ** p < 0.01, ***p < 0.001. (C) The ratio of amplitudes of EPSCNMDAR to EPSCAMPA (INMDA/AMPA) in 0.8-[Mg2+]o (n = 8), 1.2-[Mg2+]o (green, n = 6), 0.8-[Mg2+]o + FK506 (n = 7) and 1.2-[Mg2+]o + FK506 slices (n = 7). (D) The ratio of amplitudes of EPSCNMDAR to EPSCAMPA (INMDA/AMPA) in 0.8-[Mg2+]o (n = 8), 1.2-[Mg2+]o + Aβ42 (n = 6), 0.8-[Mg2+]o + FK506 (n = 7) and 1.2-[Mg2+]o + FK506 slices (n = 7), 0.8-[Mg2+]o + Aβ42 + FK506 (n = 8) and 1.2-[Mg2+]o + Aβ42 + FK506 (n = 8). (E) The ratio of amplitudes of EPSCNMDAR to EPSCAMPA (INMDA/AMPA) after the addition of ifenprodil; 0.8-[Mg2+]o (n = 6), 0.8-[Mg2+]o + Aβ42 (n = 10), 1.2-[Mg2+]o (n = 8) and 1.2-[Mg2+]o + Aβ42 (n = 12). Recordings were conducted, in vitro, using acute hippocampal slices from 4 weeks old WT mice. Unpaired t-tests, ** p < 0.01. Error bars show SEM. (F) Schematic illustration of how high Aβ impairs NMDARs and how elevation of [Mg2+]o might prevent this impairment.
Figure 5
Figure 5
Reductions by MgT treatment in amyloid plaques and BACE1 overexpression in APPswe/PS1dE9 transgenic mice (Tg mice). (A) Upper panel left: Immunostaining of hippocampal amyloid plaque of Tg (n = 6) and Tg + MgT (n = 5). Right: Hippocampal amyloid plaque areas were significantly lower in Tg + MgT mice. Lower panel: same as above but in the frontal cortex. Two tailed unpaired t-test, * p < 0.05. (B) Concentrations of Aβ42 (upper panel) and Aβ40 (lower panel) monomers in CSF of Tg (n = 13) and Tg + MgT (n = 15) measured by ELISA. (C) Left: Representative Western blots of BACE1 (β-secretase) expression in the hippocampus of mice sacrificed under home-cage conditions (basal) or following 24 h of environmental enrichment-based stimulation (Stim). Middle: Quantitative analysis of BACE1 expression in the hippocampus of WT, Tg and Tg + MgT mice (n = 5/group) obtained by Western blot (arbitrarily units, a.u.). Mice were sacrificed under basal conditions without behavioral stimulation. Right: Quantitative analysis of BACE1 expression in the hippocampus of WT (n = 6), Tg (n = 6) and Tg + MgT mice (n = 5) obtained by Western blots following behavioral stimulation. ANOVAs (Table 2) were followed by Bonferroni’s post hoc test. (D) Left: Representative Western blots of hsAPPβ expression in the hippocampus of mice sacrificed under home-cage conditions (basal) or following 24 h of environmental enrichment-based stimulation (Stim). Middle: Quantitative analysis of hsAPPβ expression in the hippocampus of Tg and Tg + MgT mice (n = 5/group) obtained by Western blot (arbitrarily units, a.u.). Mice were sacrificed under basal conditions without behavioral stimulation. Right: Quantitative analysis of hsAPPβ expression in the hippocampus of Tg (n = 6) and Tg + MgT mice (n = 5) obtained by Western blots following behavioral stimulation. (E) Same as (D) but for β-CTF, Tg (n = 3) obtained by Western blots following behavioral stimulation. Two tailed unpaired t-tests. Data from WT mice was displayed but not included in the analysis. Error bars show SEM. * p < 0.05, ** p < 0.01, *** p < 0.001.
Figure 6
Figure 6
Effects of MgT treatment on expression of NR2B and BACE1 in wild type mice. (A) Left: Representative Western blots of NR2B expression in the hippocampus of WT mice sacrificed under home-cage conditions (basal) or following 24 h of environmental enrichment-based stimulation (Stim.). Middle: Quantitative analysis of NR2B expression in the hippocampus of WT and WT + MgT mice (n = 5/group) obtained by Western blot (arbitrarily units, a.u.). Mice were sacrificed under basal conditions without behavioral stimulation. Right: Quantitative analysis of NR2B expression in the hippocampus of WT and WT + MgT mice (n = 6/group) obtained by Western blots following behavioral stimulation. (B) Left: Representative Western blots of BACE1 (β-secretase) expression in the hippocampus of WT mice sacrificed under home-cage conditions (basal) or following 24 h of environmental enrichment-based stimulation (Stim.). Middle: Quantitative analysis of BACE1 expression in the hippocampus of WT and WT + MgT mice (n = 5/group) obtained by Western blot (arbitrarily units, a.u.). Mice were sacrificed under basal conditions without behavioral stimulation. Right: Quantitative analysis of BACE1 expression in the hippocampus of WT and WT + MgT mice (n = 6/group) obtained by Western blots following behavioral stimulation. Two tailed unpaired t-test. Error bars show SEM. * p < 0.05.
Figure 7
Figure 7
Reversal by MgT treatment of behavioral and structural deficits in aged APPswe/PS1dE9 mice (Tg mice) and prevention of their premature death. (A) Experimental design to test whether MgT treatment can reverse behavioral deficits in aged Tg mice. (B) Recognition index of the novel object (Nov) and other familiar objects (Obj 1–3) during STM (left) and LTM (right) tests in the NORT task. WT (n = 10, ANOVA, STM: p < 0.0001; LTM: p < 0.0001) and untreated Tg (n = 8). (C) Same as (B) and on the same mice but NORT tests were re-conducted after MgT treatment was given to Tg mice for 1 month. ANOVA revealed significant differences in WT (n = 8, STM: p < 0.001; LTM: p < 0.05) as well as in MgT-treated aged Tg mice (n = 7, STM: p < 0.0001; LTM: p < 0.0001). Dashed lines represent chance levels of performance (25%). ANOVA was followed by Bonferroni’s post hoc test. (D) Nest construction social behavior in WT (n = 10) and untreated Tg mice (n = 10). (E) Same as (D) and on the same WT (n = 7) and Tg (n = 6) mice, but after MgT treatment was given to Tg for 1 month. (F) Density of synaptophysin positive terminals (Syn Puncta). Data from untreated aged Tg mice (from Figure 2B) were inserted (black bars) to show the effects of the 1 month treatment. ANOVAs (Table 2) were followed by Bonferroni’s post hoc test. Error bars show SEM. * p < 0.05, ** p < 0.01, *** p < 0.001. (G) Survival curves of WT (n = 65), Tg (n = 68) and Tg + MgT (n = 76) over 678 days of lifespan (MgT treatment started at 6 months of age). Log-rank Mantel-Cox test revealed significant difference between Tg mice and WT (p < 0.05) as well as Tg + MgT (p < 0.01).

Similar articles

Cited by

References

    1. Holtzman DM, Morris JC, Goate AM. Alzheimer’s disease: the challenge of the second century. Sci Transl Med. 2011;3:77sr71. - PMC - PubMed
    1. Selkoe DJ. Alzheimer’s disease. Cold Spring Harb Perspect Biol. 2011;3(7):a004457. doi: 10.1101/cshperspect.a004457. - DOI - PMC - PubMed
    1. Tamayev R, Matsuda S, Arancio O, D’Adamio L. beta- but not gamma-secretase proteolysis of APP causes synaptic and memory deficits in a mouse model of dementia. EMBO Mol Med. 2012;4:171–179. doi: 10.1002/emmm.201100195. - DOI - PMC - PubMed
    1. Nikolaev A, McLaughlin T, O’Leary DD, Tessier-Lavigne M. APP binds DR6 to trigger axon pruning and neuron death via distinct caspases. Nature. 2009;457:981–989. doi: 10.1038/nature07767. - DOI - PMC - PubMed
    1. Jack CR, Jr, Knopman DS, Jagust WJ, Shaw LM, Aisen PS, Weiner MW, Petersen RC, Trojanowski JQ. Hypothetical model of dynamic biomarkers of the Alzheimer’s pathological cascade. Lancet Neurol. 2010;9:119–128. doi: 10.1016/S1474-4422(09)70299-6. - DOI - PMC - PubMed

Publication types

MeSH terms