

Inhibiting monoacylglycerol acyltransferase 1 ameliorates hepatic metabolic abnormalities but not inflammation and injury in mice
- PMID: 25213859
- PMCID: PMC4208022
- DOI: 10.1074/jbc.M114.595850
Inhibiting monoacylglycerol acyltransferase 1 ameliorates hepatic metabolic abnormalities but not inflammation and injury in mice
Abstract
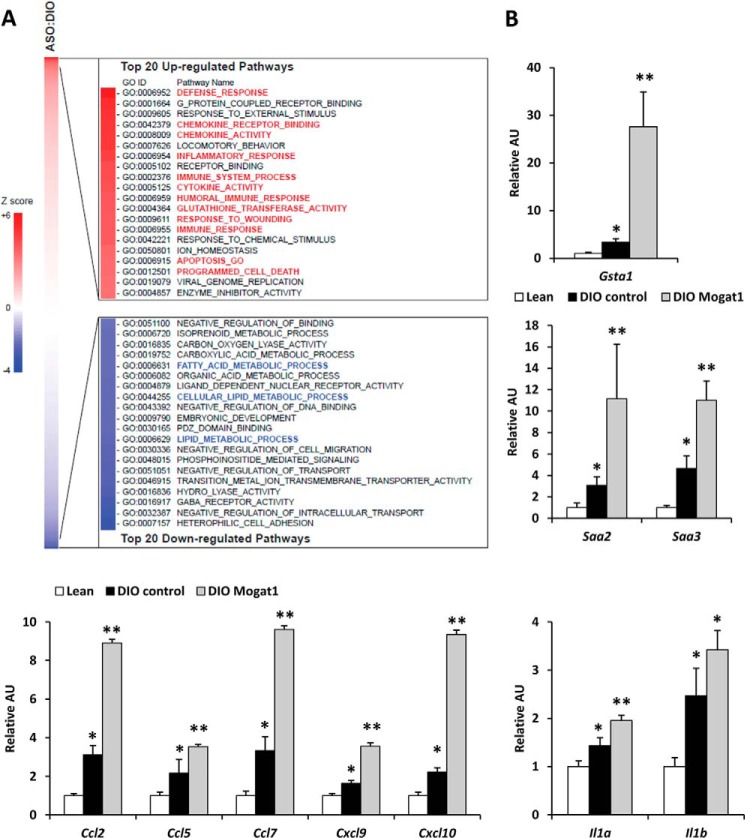
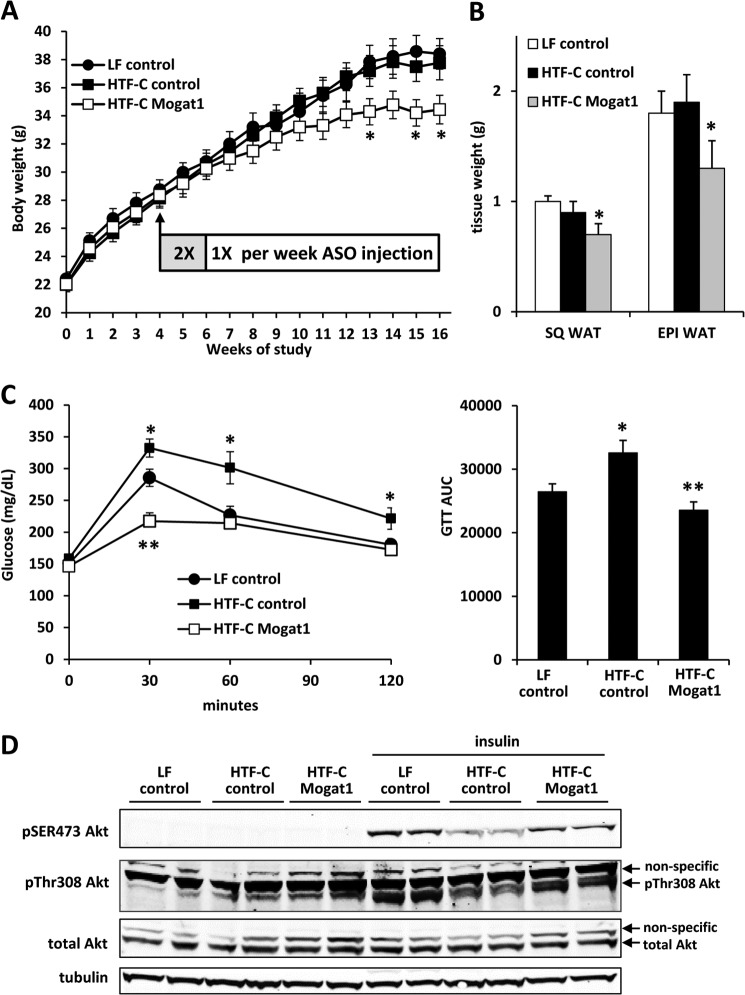
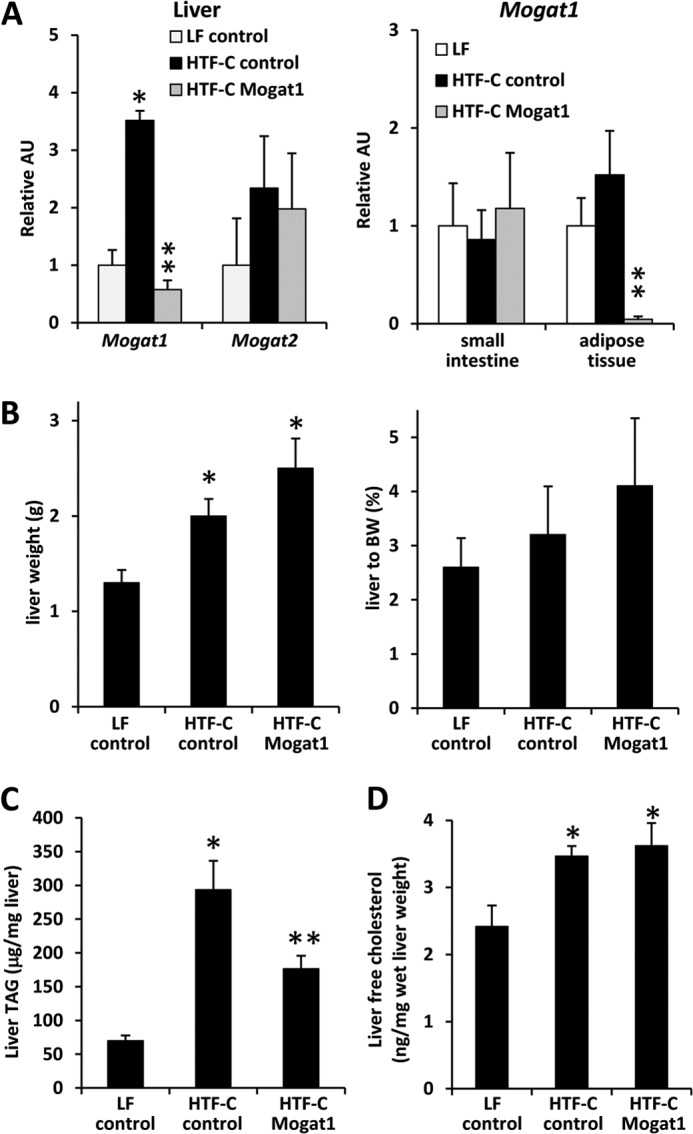
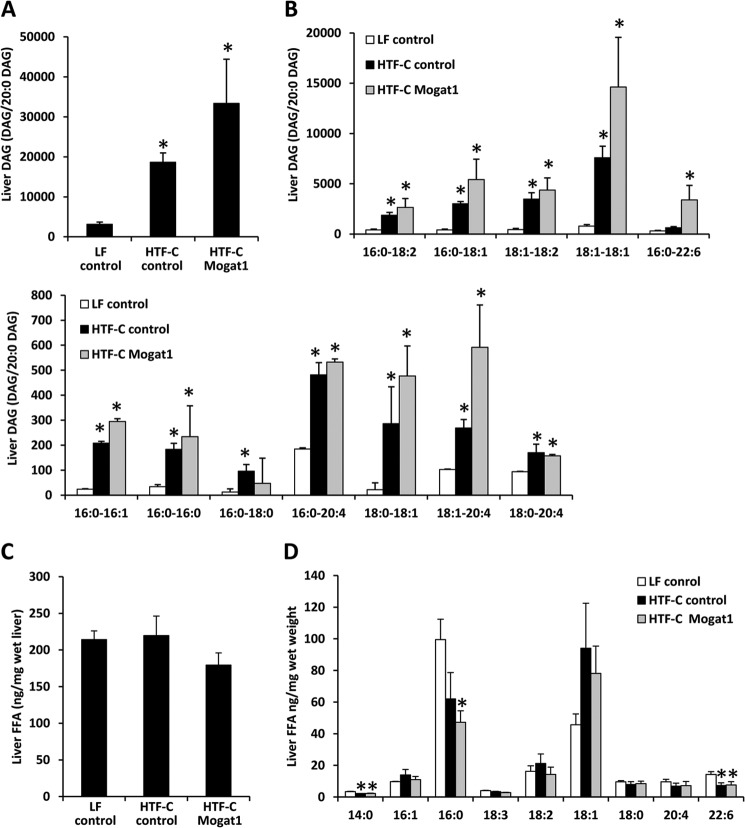
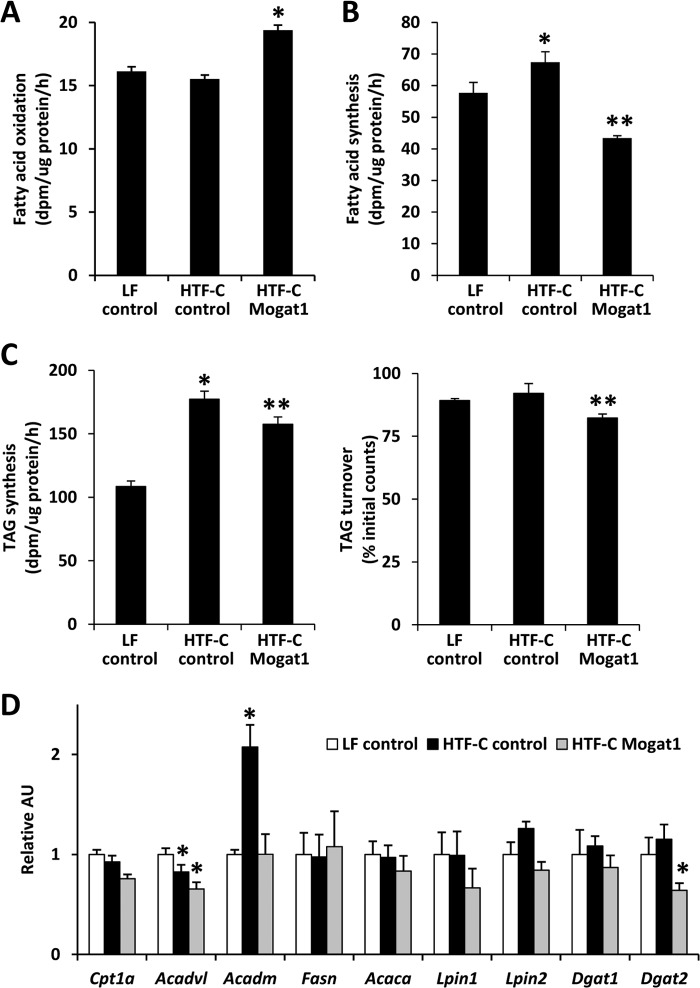
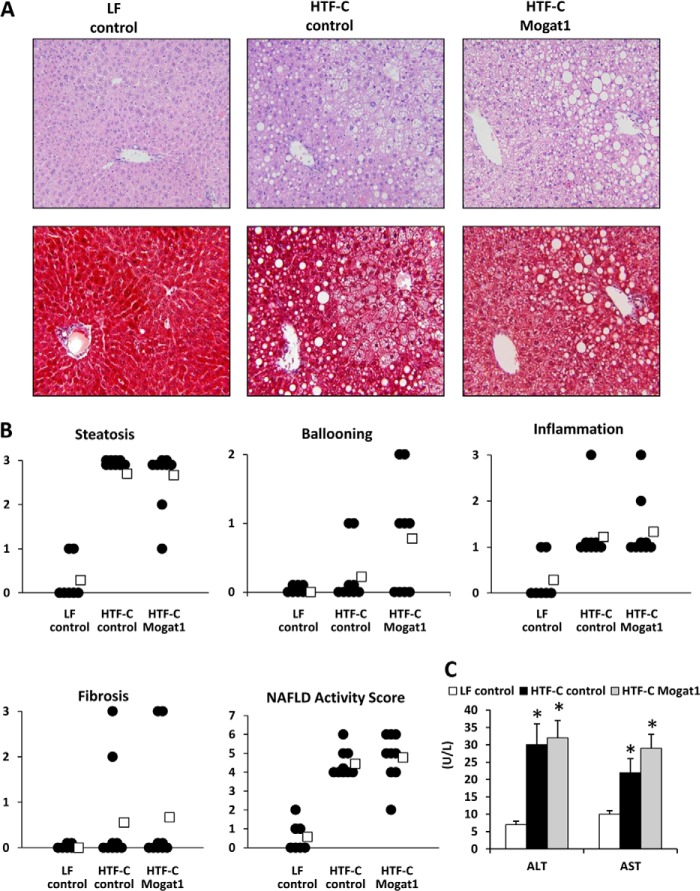
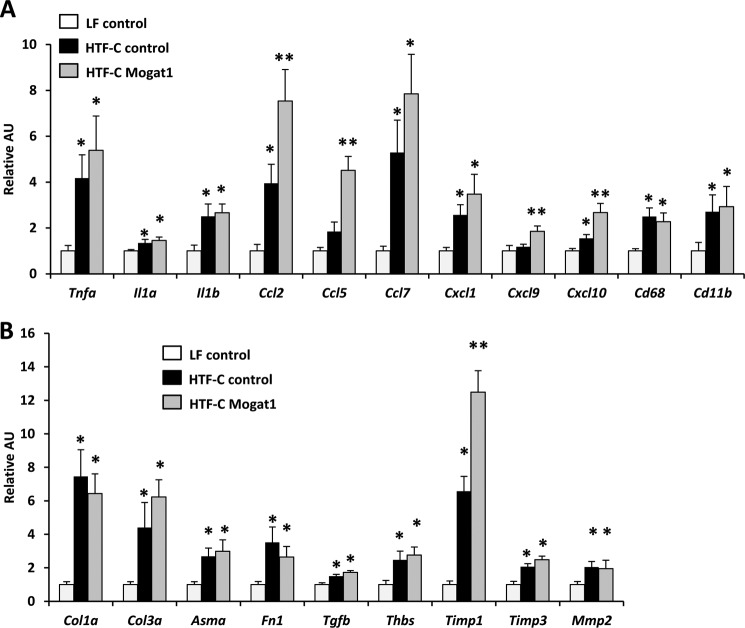
Abnormalities in hepatic lipid metabolism and insulin action are believed to play a critical role in the etiology of nonalcoholic steatohepatitis. Monoacylglycerol acyltransferase (MGAT) enzymes convert monoacylglycerol to diacylglycerol, which is the penultimate step in one pathway for triacylglycerol synthesis. Hepatic expression of Mogat1, which encodes an MGAT enzyme, is increased in the livers of mice with hepatic steatosis, and knocking down Mogat1 improves glucose metabolism and hepatic insulin signaling, but whether increased MGAT activity plays a role in the etiology of nonalcoholic steatohepatitis is unclear. To examine this issue, mice were placed on a diet containing high levels of trans fatty acids, fructose, and cholesterol (HTF-C diet) or a low fat control diet for 4 weeks. Mice were injected with antisense oligonucleotides (ASOs) to knockdown Mogat1 or a scrambled ASO control for 12 weeks while remaining on diet. The HTF-C diet caused glucose intolerance, hepatic steatosis, and induced hepatic gene expression markers of inflammation, macrophage infiltration, and stellate cell activation. Mogat1 ASO treatment, which suppressed Mogat1 expression in liver and adipose tissue, attenuated weight gain, improved glucose tolerance, improved hepatic insulin signaling, and decreased hepatic triacylglycerol content compared with control ASO-treated mice on HTF-C chow. However, Mogat1 ASO treatment did not reduce hepatic diacylglycerol, cholesterol, or free fatty acid content; improve histologic measures of liver injury; or reduce expression of markers of stellate cell activation, liver inflammation, and injury. In conclusion, inhibition of hepatic Mogat1 in HTF-C diet-fed mice improves hepatic metabolic abnormalities without attenuating liver inflammation and injury.
Keywords: Diacylglycerol; Fatty Acid Metabolism; Inflammation; Insulin Resistance; Liver; Nonalcoholic Steatohepatitis.
© 2014 by The American Society for Biochemistry and Molecular Biology, Inc.
Figures
References
-
- Vernon G., Baranova A., Younossi Z. M. (2011) Systematic review: the epidemiology and natural history of non-alcoholic fatty liver disease and non-alcoholic steatohepatitis in adults. Aliment. Pharmacol. Ther. 34, 274–285 - PubMed
-
- Fan J. G., Cao H. X. (2013) Role of diet and nutritional management in non-alcoholic fatty liver disease. J. Gastroenterol. Hepatol. 28, 81–87 - PubMed
-
- Sookoian S., Pirola C. J. (2011) Meta-analysis of the influence of I148M variant of patatin-like phospholipase domain containing 3 gene (PNPLA3) on the susceptibility and histological severity of nonalcoholic fatty liver disease. Hepatology 53, 1883–1894 - PubMed
-
- Zhu L., Baker S. S., Gill C., Liu W., Alkhouri R., Baker R. D., Gill S. R. (2013) Characterization of gut microbiomes in nonalcoholic steatohepatitis (NASH) patients: a connection between endogenous alcohol and NASH. Hepatology 57, 601–609 - PubMed
-
- Yue Y. G., Chen Y. Q., Zhang Y., Wang H., Qian Y. W., Arnold J. S., Calley J. N., Li S. D., Perry W. L., 3rd, Zhang H. Y., Konrad R. J., Cao G. (2011) The acyl coenzyme A:monoacylglycerol acyltransferase 3 (MGAT3) gene is a pseudogene in mice but encodes a functional enzyme in rats. Lipids 46, 513–520 - PubMed
Publication types
MeSH terms
Substances
Grants and funding
- R21 HL111906/HL/NHLBI NIH HHS/United States
- HL074214/HL/NHLBI NIH HHS/United States
- UL1 TR000450/TR/NCATS NIH HHS/United States
- R01 DK078187/DK/NIDDK NIH HHS/United States
- P30 DK56341/DK/NIDDK NIH HHS/United States
- UL1 TR000448/TR/NCATS NIH HHS/United States
- KL2 TR000450/TR/NCATS NIH HHS/United States
- P30 DK056341/DK/NIDDK NIH HHS/United States
- R01 HL074214/HL/NHLBI NIH HHS/United States
- P30 DK52574/DK/NIDDK NIH HHS/United States
- K01 DK087821/DK/NIDDK NIH HHS/United States
- P30 DK020579/DK/NIDDK NIH HHS/United States
- HL111906/HL/NHLBI NIH HHS/United States
- P30 DK052574/DK/NIDDK NIH HHS/United States
LinkOut - more resources
Full Text Sources
Other Literature Sources
Molecular Biology Databases
