. 2014 Dec 5;289(49):34161-74.
doi: 10.1074/jbc.M114.590471. Epub 2014 Sep 11.

A conformational sampling model for radical catalysis in pyridoxal phosphate- and cobalamin-dependent enzymes

Affiliations

A conformational sampling model for radical catalysis in pyridoxal phosphate- and cobalamin-dependent enzymes

Binuraj R K Menon et al. J Biol Chem. .

Abstract

Cobalamin-dependent enzymes enhance the rate of C-Co bond cleavage by up to ∼10(12)-fold to generate cob(II)alamin and a transient adenosyl radical. In the case of the pyridoxal 5'-phosphate (PLP) and cobalamin-dependent enzymes lysine 5,6-aminomutase and ornithine 4,5 aminomutase (OAM), it has been proposed that a large scale domain reorientation of the cobalamin-binding domain is linked to radical catalysis. Here, OAM variants were designed to perturb the interface between the cobalamin-binding domain and the PLP-binding TIM barrel domain. Steady-state and single turnover kinetic studies of these variants, combined with pulsed electron-electron double resonance measurements of spin-labeled OAM were used to provide direct evidence for a dynamic interface between the cobalamin and PLP-binding domains. Our data suggest that following ligand binding-induced cleavage of the Lys(629)-PLP covalent bond, dynamic motion of the cobalamin-binding domain leads to conformational sampling of the available space. This supports radical catalysis through transient formation of a catalytically competent active state. Crucially, it appears that the formation of the state containing both a substrate/product radical and Co(II) does not restrict cobalamin domain motion. A similar conformational sampling mechanism has been proposed to support rapid electron transfer in a number of dynamic redox systems.

Keywords: Adenosylcobalamin (AdoCbl); Conformational Sampling; Domain Dynamics; Electron Paramagnetic Resonance (EPR); Ornithine Aminomutase; Protein Dynamic; Pyridoxal Phosphate; Radical.


Figures

FIGURE 1.
FIGURE 1.
Proposed conformations of OAM based on crystal structures and molecular simulations. Open resting state and closed active state model for wild-type OAM. Wild-type cysteine residues are shown in yellow spheres, PLP cofactor is in red spheres, and adenosyl cobalamin is in magenta spheres. The red balls are used to indicate position of group A residues (Asp627 and Ile424), and green balls show group B residues (Glu338, Gly339, Pro343, and Gly128) in the enlarged figure section. The Rossmann domain is shown as blue ribbon. The open model is based on the published OAM crystal structure (Protein Data Bank code 3KP1), and the closed model is based on the model of Pang et al. (12).
FIGURE 2.
FIGURE 2.
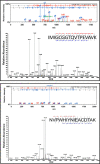
Mass spectral analysis of MTSL nitroxide spin-labeled wild-type OAM at Cys700 and Cys352. The tryptic peptide fragments IMIGCGGTQVTPEVAVK containing Cys700 and NVPWHYNIEACDTAK containing Cys352 were the precursors selected for the analysis. Peptide fragments are indicated by b if the charge is retained on the N terminus and by y if the charge is retained on the C terminus. In the standard spectrum format, scaffold shows the y ions in blue and the b ions in red. Peaks in black have not been associated with standard ions. Scaffold adds the blue and red horizontal ladders to easily show the identified portion of the amino acid sequence, reading from left to right for the red ladder (b ions) and from right to left for the blue (y ions). Additionally the MTSL-modified Cys residue has been identified in both b and y ion series; its mass corresponds to the mass of cysteine plus 184.08 Da.
FIGURE 3.
FIGURE 3.
PELDOR traces obtained for MTSL labeled wild-type OAM and C700S. Traces A–C represent the continuous wave EPR spectra, whereas the PELDOR Fourier transformed data are shown in traces D–K. CW EPR spectra of OAM spin-labeled at Cys352 and Cys700 prepared in the dark (A) and OAM spin-labeled at Cys352 and Cys700 plus DAB (B); OAM spin-labeled at Cys352 (C700S variant) plus DAB (C) are shown. In B and C, the Co(II) radical coupled signal g at g = 2.11 is marked. The experimental conditions were as follows: microwave power, 10 μW; modulation amplitude, 5 G; modulation frequency, 100 KHz; and temperature, 80 K. D is the time domain PELDOR modulation data, and H is its Fourier transform obtained from the sample shown in A by observing at ▾ and pumping at ▿ at 80 K; E is the time domain PELDOR modulation data, and I is its Fourier transform obtained from the sample shown in B by observing and pumping as in A at 80 K; F is the time domain PELDOR modulation data, and J is its Fourier transform obtained from the sample shown in B by observing and pumping as in A at 15 K; G is the time domain PELDOR modulation data, and K is its Fourier transform obtained from the sample shown in C by observing at ▾ and pumping at ▿ at 10 K. The experimental conditions for D and E were as follows: τ = 200 ns; T = 1100 ns; shot repetition time, 3 ms; t incremented in 148 8-ns steps; and temperature, 80 K. The experimental conditions for F were as follows: τ = 200 ns; T = 1100 ns; shot repetition time, 2 ms; t incremented in 148 8-ns steps; and temperature, 15 K. The experimental conditions for G were as follows: τ = 190 ns; T = 732 ns; shot repetition time, 10 ms; t incremented in 100 8-ns steps; and temperature, 10 K.
FIGURE 4.
FIGURE 4.
Catalytic properties of variant enzymes. Relative activity of the OAM variant enzymes is plotted as the percentage of catalytic turnover number (kcat) of wild-type OAM. A coupled spectrophotometric assay with DAPDH was used to determine the kinetic parameters for wild-type OAM and variant enzymes.
FIGURE 5.
FIGURE 5.
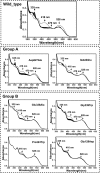
Change in UV-visible spectra of holo-OAM and variant enzymes induced by binding of the substrate d-ornithine under anaerobic condition. The holoenzyme solution contained 100 mm NH4-EPPS, pH 8.5, 15 μm OAM, 15 μm PLP, and 15 μm AdoCbl in a total volume of 1 ml. Spectral changes for holo-OAM were recorded at 25 °C at 0 and 10 s and then at every 60 s up to 25 min following the addition of 2.5 mm d-ornithine. The arrows indicate the direction of absorbance change over time. The absorbance decrease at 528 nm reflects the homolysis of the AdoCbl C–Co bond, the absorbance increase at 470 reflects cob(II)alamin formation, and the decrease in absorbance shoulder at 416 nm corresponds to transimination induced by the d-ornithine binding with PLP.
FIGURE 6.
FIGURE 6.
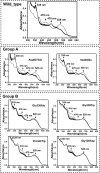
Change in UV-visible spectra of holo-OAM and variant enzymes induced by binding of the inhibitor DAB under anaerobic condition. The holoenzyme solution contained 100 mm NH4-EPPS, pH 8.5, 15 μm OAM, 15 μm PLP, and 15 μm AdoCbl in a total volume of 1 ml. Spectral changes for holo-OAM were recorded at 25 °C at 0 and 10 s and then at every 60 s up to 25 min following the addition of 2.5 mm dl-2,4-diaminobutryic acid. The arrows indicate the direction of absorbance change over time. The absorbance decrease at 528 nm reflects the homolysis of the AdoCbl C–Co bond, the absorbance increase at 470 reflects cob(II)alamin formation, and the decrease in absorbance shoulder at 416 nm corresponds to transimination induced by the DAB binding with PLP.
FIGURE 7.
FIGURE 7.
Continuous wave EPR spectra of wild-type OAM and variant enzymes. The EPR spectra show the relative amount of paramagnetic species formed for wild-type OAM and variant enzymes in the presence of inhibitor DAB. The holoenzyme solution contained 100 mm NH4-EPPS, pH 8.5, 250 μm OAM, 250 μm PLP, and 250 μm AdoCbl. 10 mm dl-2,4-diaminobutryic acid was added to the holoenzyme, and samples were loaded into EPR tubes and after 5 min of incubation time samples were frozen in liquid nitrogen.
FIGURE 8.
FIGURE 8.
Change in UV-visible spectra of holo-OAM and variant enzymes bound to inhibitor 3-DAP after induced with a continuous illumination of light under aerobic conditions. The holoenzyme solution contained 100 mm NH4-EPPS, pH 8.5, 30 μm OAM, 30 μm PLP, and 30 μm AdoCbl in a total volume of 1 ml. The UV-visible spectra before and after adding 5 mm 3-DAP are shown as thick lines. The dark arrows indicate the direction of the absorbance change during inhibitor binding over 25 min. The inhibitor bound holo-OAM was then subjected to continuous illumination from a Schott KL1500 electronic light source after passing the light through a red insert filter (<530-nm cutoff filter), which provides illumination at an intensity of 1000 μmol m−2 s−1, and spectral changes were recorded at 25 °C at 0 and 10 s and then at every 60 s up to 25 min. The dark dashed arrows indicate the direction of the absorbance change during continuous illumination over 25 min.
FIGURE 9.
FIGURE 9.
Anaerobic stopped flow measurement of C–Co bond homolysis in wild-type OAM and OAM variants. Stopped flow absorbance changes following mixing of holo-OAM and variant enzymes (50 μm; before mixing) with d-ornithine (5 mm; before mixing) and dl-2,4-diaminobutryic acid (5 mm before mixing) under anaerobic conditions at 25 °C. Absorbance change at 528 nm monitors AdoCbl Co-C bond homolysis. An average of 15–20 traces were averaged at each wavelength and used to fit to a single exponential equation to extract the observed rate constants.
FIGURE 10.
FIGURE 10.
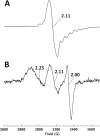
Continuous wave EPR spectrum of freeze-quenched holo-OAM with d-ornithine. Continuous wave EPR spectrum of OAM in presence of inhibitor DAB (A) and that of holo-OAM d-ornithine rapidly combined with substrate d-ornithine (B) using a freeze-quench apparatus is shown. The experimental conditions were as follows: microwave power, 0.5 milliwatt; modulation amplitude, 5 G; modulation frequency, 100 KHz; and temperature, 20 K.
FIGURE 11.
FIGURE 11.
A dynamic model for OAM catalysis. Schematic representation of our proposed model for the role of domain dynamics in OAM catalysis. The B12 binding domain is represented by a blue square, whereas the PLP binding domain is represented as a green shape. The latter has two surfaces indicated by green and red lines, representing the group A and group B mutations, respectively. Upon substrate binding, the B12 binding domain samples the available space. Our data suggest there is no direct link between radical formation and the B12 domain motion.

Similar articles

Cited by

References

    1. Brown K. L. (2005) Chemistry and enzymology of vitamin B12. Chem. Rev. 105, 2075–2149 - PubMed
    1. Marsh E. N. (1995) A radical approach to enzyme catalysis. Bioessays 17, 431–441 - PubMed
    1. Roth J. R., Lawrence J. G., Bobik T. A. (1996) Cobalamin (coenzyme B12): synthesis and biological significance. Annu. Rev. Microbiol. 50, 137–181 - PubMed
    1. Stubbe J. A. (1989) Protein radical involvement in biological catalysis? Annu. Rev. Biochem. 58, 257–285 - PubMed
    1. Marsh E. N., Ballou D. P. (1998) Coupling of cobalt-carbon bond homolysis and hydrogen atom abstraction in adenosylcobalamin-dependent glutamate mutase. Biochemistry 37, 11864–11872 - PubMed

Publication types

MeSH terms

LinkOut - more resources