. 2015 Jan;101(1):37-43.
doi: 10.1136/heartjnl-2014-306142. Epub 2014 Sep 11.

RV-pulmonary arterial coupling predicts outcome in patients referred for pulmonary hypertension

Affiliations

RV-pulmonary arterial coupling predicts outcome in patients referred for pulmonary hypertension

Rebecca R Vanderpool et al. Heart. 2015 Jan.

Abstract

Objective: Prognosis in pulmonary hypertension (PH) is largely determined by RV function. However, uncertainty remains about what metrics of RV function might be most clinically relevant. The purpose of this study was to assess the clinical relevance of metrics of RV functional adaptation to increased afterload.

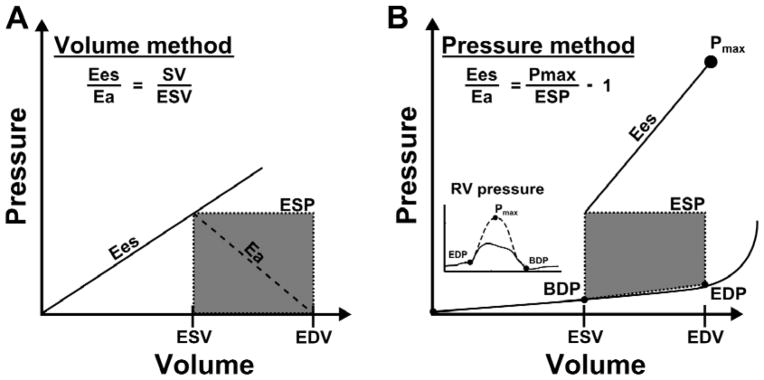
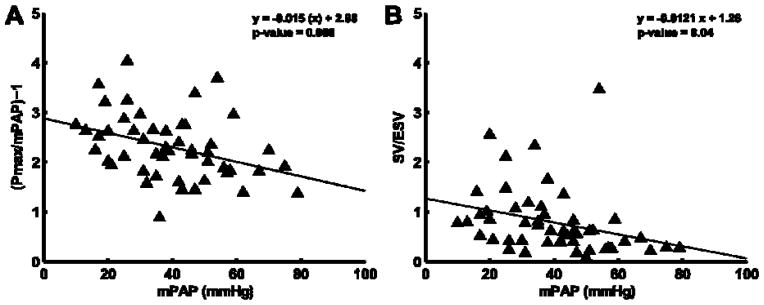
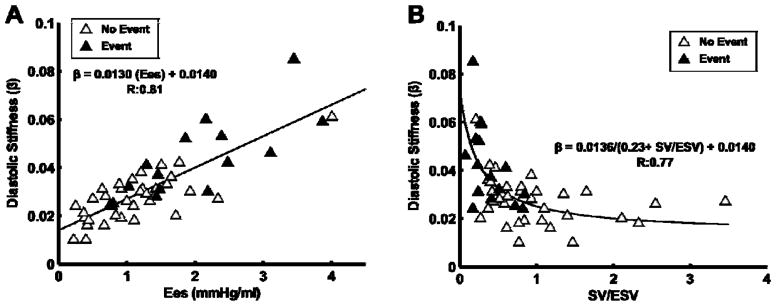
Methods: Patients referred for PH underwent right heart catheterisation and RV volumetric assessment within 48 h. A RV maximum pressure (Pmax) was calculated from the RV pressure curve. The adequacy of RV systolic functional adaptation to increased afterload was estimated either by a stroke volume (SV)/end-systolic volume (ESV) ratio, a Pmax/mean pulmonary artery pressure (mPAP) ratio, or by EF (RVEF). Diastolic function of the RV was estimated by a diastolic elastance coefficient β. Survival analysis was via Cox proportional HR, and Kaplan-Meier with the primary outcome of time to death or lung transplant.

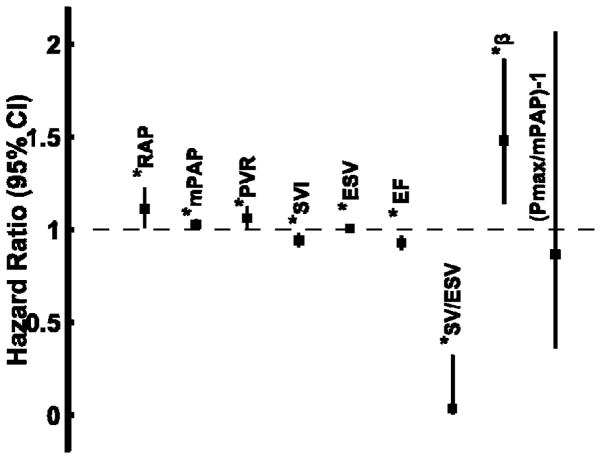
Results: Patients (n=50; age 58±13 yrs) covered a range of mPAP (13-79 mm Hg) with an average RVEF of 39±17% and ESV of 143±89 mL. Average estimates of the ratio of end-systolic ventricular to arterial elastance were 0.79±0.67 (SV/ESV) and 2.3±0.65 (Pmax/mPAP-1). Transplantation-free survival was predicted by right atrial pressure, mPAP, pulmonary vascular resistance, β, SV, ESV, SV/ESV and RVEF, but after controlling for right atrial pressure, mPAP, and SV, SV/ESV was the only independent predictor.

Conclusions: The adequacy of RV functional adaptation to afterload predicts survival in patients referred for PH. Whether this can simply be evaluated using RV volumetric imaging will require additional confirmation.


Conflict of interest statement

COMPETING INTERESTS

Dr. Simon reports receiving research funding from Pfizer. Dr. Vanderpool reports receiving consulting fees from United Therapeutics. Dr. Mathier reports receiving research funding from Actelion, consulting fees or serving on paid advisory boards for Gilead and Actelion and receiving lecture fees from Actelion, Encysive, and GlaxoSmithKline. Drs. Lacomis and Deible report receiving research funding from MEDRAD Inc. Dr. Champion reports receiving consulting fees or serving on paid advisory boards for Gilead, United Therapeutics, Bayer, Merck and Pfizer. Dr. Pinsky, Mr. Kosaraju, and Ms. Bunner have no competing interests.

Figures

Figure 1
Figure 1
Methods used to estimate right ventriculo (RV)-arterial coupling (Ees/Ea) and diastolic stiffness (β). In both the volume method (Panel A) and the pressure method (Panel B), arterial elastance (Ea) was calculated from the ratio of end-systolic pressure (ESP) to stroke volume (SV). End-systolic elastance (Ees) in the volume method was estimated by the ratio of ESP to end systolic volume (ESV), which results in a simplified Ees/Ea of SV/ESV. In the pressure method, Pmax was estimated from the non-linear extrapolation of the early systolic and diastolic portions of the RV pressure curve. End-systolic elastance was then ratio of (Pmax-mPAP) divided by SV, which results in a simplified Ees/Ea of (Pmax/ESP − 1). Diastolic stiffness, β, was calculated by fitting the non-linear exponential, P = α(e − 1), to pressure and volume measured at the beginning of diastole (BDP: beginning diastolic pressure, ESV) and the end of diastole (EDP: end-diastolic pressure, EDV).
Figure 2
Figure 2
Ratio of Ees/Ea calculated by pressure method (Panel A) or volume method (Panel B) plotted versus mean pulmonary arterial pressure (mPAP). Ees/Ea is greater when calculated by the pressure method than when calculated by the volume measurement, however inverse relationship to mPAP is consistent between methods.
Figure 3
Figure 3
Diastolic stiffness increased linearly with right ventricular (RV) contractility (Panel A). However, there is an inverse relationship between diastolic stiffness and the RV-arterial coupling ratio, stroke volume (SV)/end-systolic volume (ESV).
Figure 4
Figure 4
Forrest plot showing the independent hazard ratio and 95% confidence interval of each parameter to predict a primary outcome of death or lung transplant. A hazard ratio > 1.0 is associated with greater risk of death or lung transplant; a ratio < 1.0 was protective. * P < 0.05 – significant.
Figure 5
Figure 5
Kaplan-Meier survival curve stratifying patients by stroke volume (SV)/end-systolic volume (ESV) of 0.515 in the whole cohort (Panel A) and when the cohort was limited to those with PH (mPAP ≥ 25 mmHg; Panel B).
Figure 6
Figure 6
Pressure-volume loops from instantaneous right ventricular (RV) pressure and pulmonary artery Doppler flow (Panel A) compared to the simplified pressure-volume loops with peak systolic RV pressure (sRVP) to estimate ESP (Panel B) for three subjects. The corresponding RV pressure curves are also displayed (left, inset). Slopes of Ees in panel A were 0.91 mmHg/ml (subject A), 1.02 mmHg/ml (subject B), and 1.21 mmHg/ml (subject C). Slopes of Ees in panel B were respectively of 0.83 mmHg/ml, 1.19 mmHg/ml, and C: 1.53 mmHg/ml. Slopes of Ees with mPAP instead of sRVP (not shown) were respectively of 1.03 mmHg/ml, 1.46 mmHg/ml and 1.93 mmHg/ml

Similar articles

Cited by

References

    1. Champion HC, Michelakis ED, Hassoun PM. Comprehensive invasive and noninvasive approach to the right ventricle-pulmonary circulation unit: state of the art and clinical and research implications. Circulation. 2009;120:992–1007. doi: 10.1161/CIRCULATIONAHA.106.674028. - DOI - PubMed
    1. Vonk-Noordegraaf A, Haddad F, Chin KM, et al. Right heart adaptation to pulmonary arterial hypertension: physiology and pathobiology. J Am Coll Cardiol. 2013;62:D22–33. doi: 10.1016/j.jacc.2013.10.027. - DOI - PubMed
    1. Sagawa K, Maughan L, Suga H, et al. Cardiac contraction and the pressure-volume relationship. New York: Oxford University Press; 1988.
    1. Tedford RJ, Mudd JO, Girgis RE, et al. Right Ventricular Dysfunction in Systemic Sclerosis Associated Pulmonary Arterial Hypertension. Circ Heart Fail. 2013;11 doi: 10.1161/CIRCHEARTFAILURE.112.000008. - DOI - PMC - PubMed
    1. Kuehne T, Yilmaz S, Steendijk P, et al. Magnetic resonance imaging analysis of right ventricular pressure-volume loops: in vivo validation and clinical application in patients with pulmonary hypertension. Circulation. 2004;110:2010–6. doi: 10.1161/01.CIR.0000143138.02493.DD. - DOI - PubMed

Publication types

MeSH terms