. 2014 Sep 12;345(6202):1254009.
doi: 10.1126/science.1254009. Epub 2014 Aug 21.

Innate lymphoid cells regulate intestinal epithelial cell glycosylation

Affiliations

Innate lymphoid cells regulate intestinal epithelial cell glycosylation

Yoshiyuki Goto et al. Science. .

Abstract

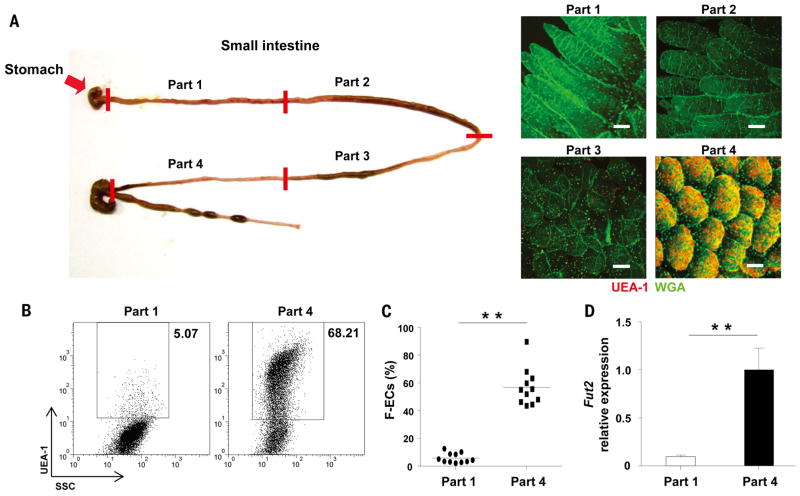
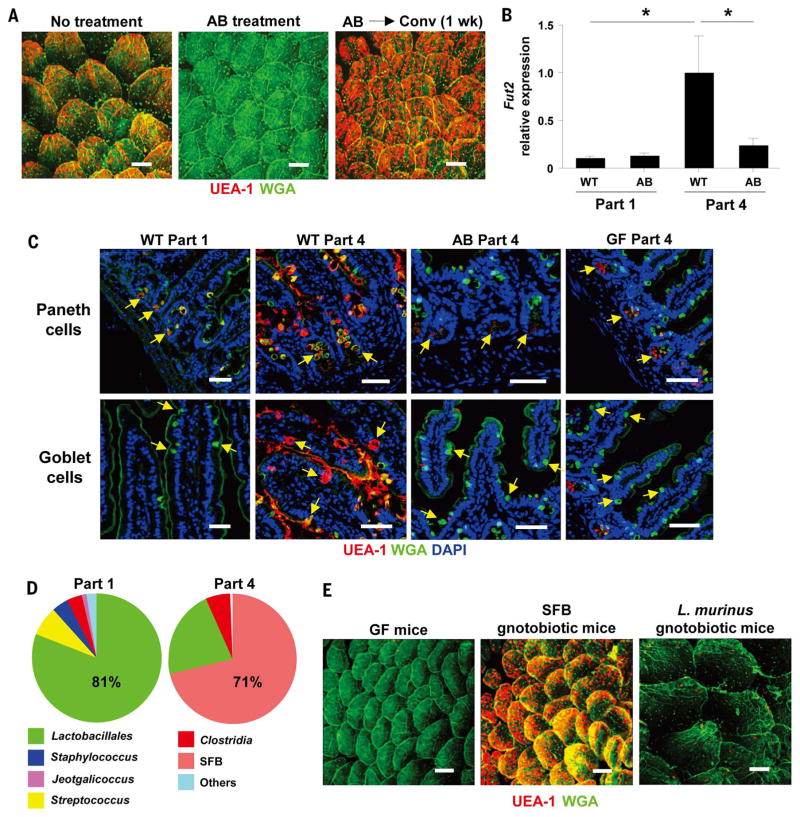
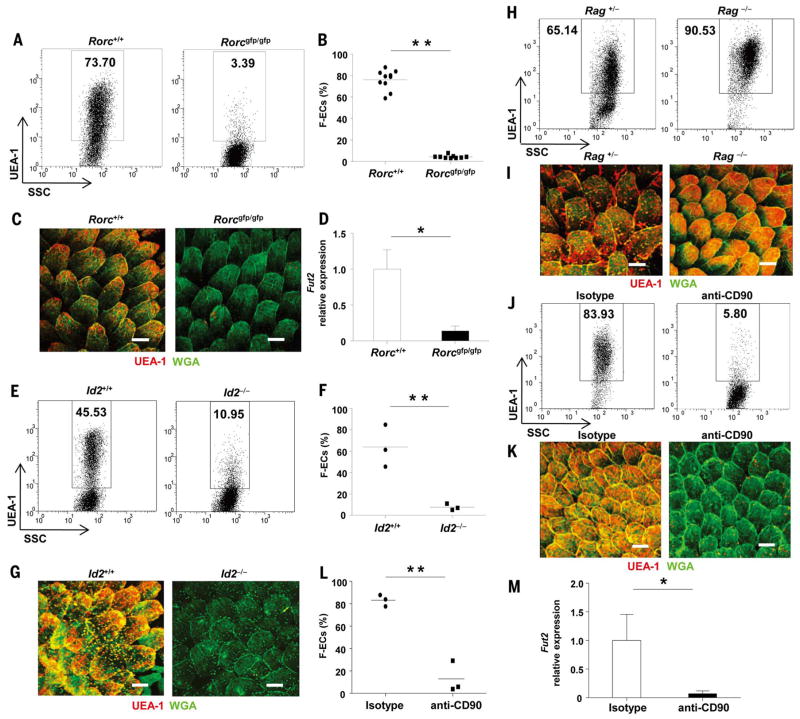
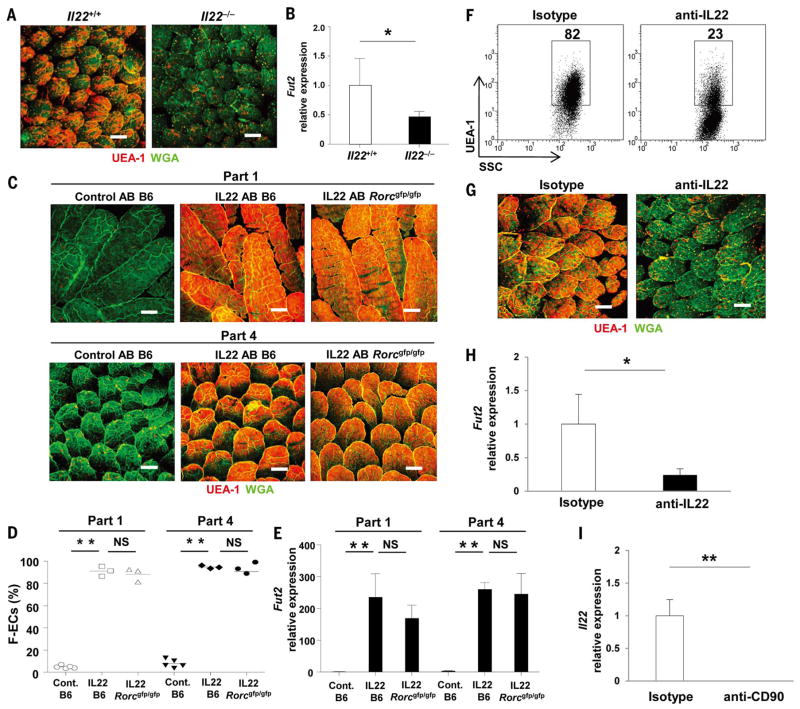
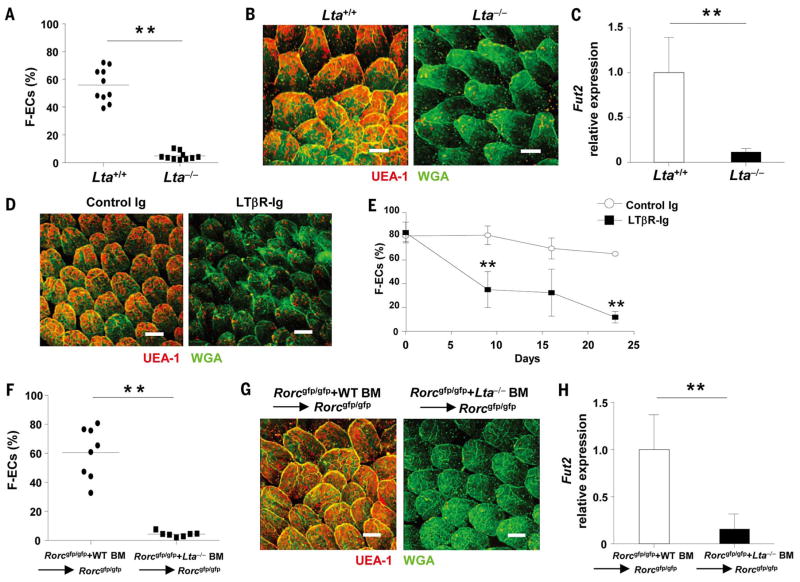
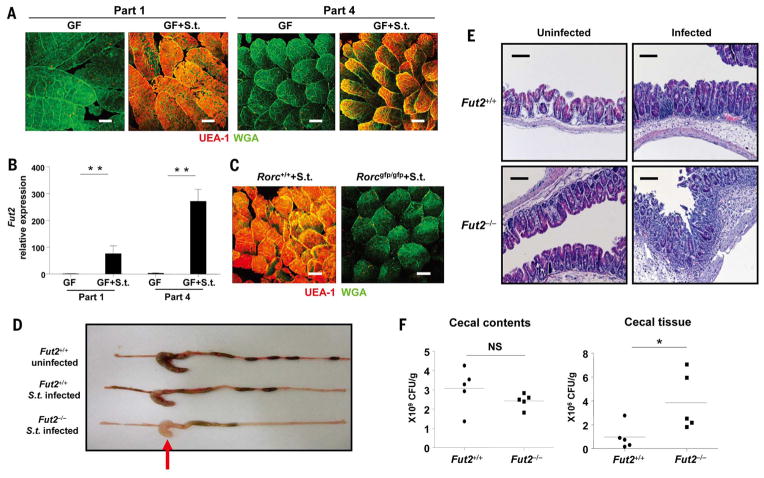
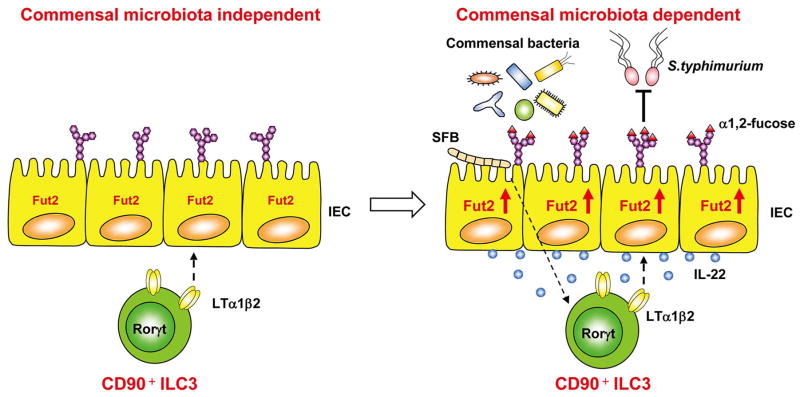
Fucosylation of intestinal epithelial cells, catalyzed by fucosyltransferase 2 (Fut2), is a major glycosylation mechanism of host-microbiota symbiosis. Commensal bacteria induce epithelial fucosylation, and epithelial fucose is used as a dietary carbohydrate by many of these bacteria. However, the molecular and cellular mechanisms that regulate the induction of epithelial fucosylation are unknown. Here, we show that type 3 innate lymphoid cells (ILC3) induced intestinal epithelial Fut2 expression and fucosylation in mice. This induction required the cytokines interleukin-22 and lymphotoxin in a commensal bacteria-dependent and -independent manner, respectively. Disruption of intestinal fucosylation led to increased susceptibility to infection by Salmonella typhimurium. Our data reveal a role for ILC3 in shaping the gut microenvironment through the regulation of epithelial glycosylation.


Conflict of interest statement

The authors declare no conflicts of interest.

Figures

Fig. 1
Fig. 1. F-ECs are dominant in the ileum
(A) Mouse small intestines were divided equally into 4 parts (parts 1, 2, 3, and 4), from the proximal (duodenum) to the distal (ileum) ends (left), and whole-mount tissues were stained with UEA-1 (red) and WGA (green) to detect F-ECs (UEA-1+ WGA+ cells) (right). Scale bars, 100 μm. Data are representative of three independent experiments. (B and C) Flow cytometric analysis of intestinal ECs isolated from part 1 and part 4 of the small intestines of C57BL/6 (B6) mice. Representative dot-plots are shown in (B). Percentages and mean numbers (horizontal bars) of fucosylated epithelial cells (n = 11 mice per group) are shown (C). SSC, side scatter. Data of two independent experiments are combined. (D) Expression of Fut2 in ECs isolated from part 1 and part 4 of the small intestine isolated from five to six mice per group. Error bars indicate SD. **P < 0.01 by using Student’s t test. Data are representative of two independent experiments.
Fig. 2
Fig. 2. Commensal bacteria induce epithelial fucosylation under homeostatic conditions
(A) Whole-mount ileal tissues of AB-treated mice and conventionalized AB-treated mice were stained with UEA-1 (red) and WGA (green) (n = 3 mice per group). Scale bars, 100 μm. Data are representative of two independent experiments. (B) Fut2 expression in ECs isolated from part 1 (duodenum) and part 4 (ileum) of the small intestines of wild-type (WT) and AB-treated mice (n = 3 mice per group). Error bars indicate SD. *P < 0.05 by using Student’s t test. Data are representative of two independent experiments. (C) Tissues from part 1 and part 4 of the small intestines of WT, AB-treated, and GF mice were stained with UEA-1 (red), WGA (green), and 4′,6-diamidino-2-phenylindole (DAPI) (blue). Arrows show Paneth cells (top) and goblet cells (bottom). Scale bars, 50 μm. Data are representative of two independent experiments. (D) Bacterial populations isolated from the mucus fraction of part 1 and part 4 of mouse small intestine were analyzed by means of 16S rRNA gene clone library. Representative graphs were constructed from samples (part 1, n = 480 clones; Part 4, n = 477 clones) isolated from five different mice (95 or 96 samples were obtained from each mouse). (E) Ileal tissues of GF, SFB, or L. murinus mono-associated mice (n = 3 mice per group) were stained with UEA-1 (red) and WGA (green). Scale bars, 100 μm. Data are representative of two independent experiments.
Fig. 3
Fig. 3. CD90+ RORγt+ ILC3 induce F-ECs
(A and B) Representative dot-plots (A) and percentages and means (B) (horizontal bars) of ileal F-ECs isolated from Rorc+/+ and Rorcgfp/gfp mice (n = 10 mice per group). SSC, side scatter. **P < 0.01 by using Student’s t test. Data of two independent experiments are combined. (C) Whole-mount ileal tissues from Rorc+/+ and Rorcgfp/gfp mice were stained with UEA-1 (red) and WGA (green) (n = 10 mice per group). Scale bars, 100 μm. Data are representative of two independent experiments. (D) Expression of Fut2 in ileal ECs isolated from Rorc+/+ and Rorcgfp/gfp mice (n = 5 mice per group). Data are representative of two independent experiments. Error bars indicate SD. *P < 0.05. (E and F) Representative dot-plots (E) and percentages and means (F) (horizontal bars) of ileal ECs isolated from Id2+/+ and Id2−/− mice (n = 3 mice per group). Data of three independent experiments are combined. (G) Whole-mount staining of ileal villi isolated from Id2+/+ and Id2−/− mice. Scale bars, 100 μm. Data are representative of three independent experiments. (H and J) Representative dot-plots of ileal ECs isolated from Rag+/− and Rag−/− mice (H) and Rag−/− mice treated with mAb to CD90 (anti-CD90 mAb) or isotype control Ab to CD90 (J) (n = 3 mice per group). (I and K) Whole-mount staining of ileal villi isolated from Rag+/− or Rag−/− mice (I) and anti-CD90 mAb– or anti-CD90 isotype control Ab–treated Rag−/− mice (K) (n = 3 mice per group). Scale bars, 100 μm. Data are representative of two independent experiments. (L and M) Percentages and means (horizontal bars) of ileal F-ECs (L) and Fut2 expression (M) isolated from anti-CD90 mAb– or isotype control Ab–treated Rag−/− mice (n = 3 mice per group). Data are representative of two independent experiments. Error bars indicate SD. *P < 0.05, **P < 0.01 by using Student’s t test.
Fig. 4
Fig. 4. IL-22 produced by ILCs is involved in the induction of F-ECs
(A and B) Whole-mount tissues stained with UEA-1 (red) and WGA (green) (A) and gene expression of Fut2 (B) in ileal villi isolated from Il22+/+ or Il22−/−mice (n = 6 mice per group). Error bars indicate SD. *P < 0.05 by using Student’s t test. Scale bars, 100 μm. Data are representative of two independent experiments. (C to E) AB-treated C57BL/6 (B6) or Rorcgfp/gfp mice were intravenously injected with IL-22–encoding plasmid or control vector. Whole-mount staining (C), frequency of F-ECs (D) (mean, horizontal bars), and Fut2 mRNA expression was analyzed by means of rRT-PCR (n ≥ 3 mice per group) (E). Scale bars, 100 μm. Error bars indicate SD. **P < 0.01 by using Student’s t test. NS, not significant. Data are representative of two independent experiments. (F to H) Representative dot-plots (F), whole-mount histological images (G), and expression of Fut2 (H) of ileal ECs isolated from Rag−/− mice treated with antibody to IL-22 or control Ab. Scale bars, 100 μm. Error bars indicate SD. *P < 0.05 by using Student’s t test. (I) Expression of Il22 in ileal LP cells from Rag−/− mice treated with antibody to CD90 or control Ab. Error bars inidicate SD. **P < 0.01 by using Student’s t test. Data are representative of two independent experiments.
Fig. 5
Fig. 5. LTs in innate lymphoid cells induce F-ECs
(A) Representative values and means (horizontal bars) of frequency of ileal F-ECs isolated from Lta+/+ or Lta−/− mice (n = 10 mice per group). Data of two independent experiments are combined. **P < 0.01 by using Student’s t test. (B) Representative whole-mount staining of ileal villi isolated from Lta+/+ or Lta−/− mice (n = 10 mice per group). Scale bars, 100 μm. (C) Expression of Fut2 in ileal ECs isolated from Lta+/+ or Lta−/− mice (n = 5 mice per group). Error bars inidicate SD. **P < 0.01 by using Student’s t test. Data are representative of two independent experiments. (D) Representative whole-mount staining of ileal villi from C57BL/6 mice injected with control IgG or LTβR-Ig. Tissues were stained with UEA-1 (red) and WGA (green). (n = 3 mice per group) (E) Frequencies of F-ECs in the ileum of C57BL/6 mice injected with control IgG (control Ab) or LTβR-Ig twice (day 9), 3 times (day 16), or 4 times (day 23) (n = 3 mice per group). Error bars indicate SD. **P < 0.01 by using Student’s t test. (F to H) Values and means (F), representative whole-mount staining (G), and expression of Fut2 (H) in ileal ECs isolated from Rorcgfp/gfp mice injected with a mixture of BM cells from Rorcgfp/gfp and WT mice or Rorcgfp/gfp and Lta−/− mice (n = 7 to 8 mice per group). Data of two independent experiments are combined. Error bars indicate SD. **P < 0.01 by using Student’s t test. Scale bars, 100 μm.
Fig. 6
Fig. 6. Epithelial fucosylation protects against infection by S. typhimurium
(A) Whole-mount tissues from part 1 (duodenum) and part 4 (ileum) of the small intestines of germ-free (GF) or S. typhimurium–infected GF mice were stained with UEA-1 (red) and WGA (green) (n = 3 to 4 mice per group). Scale bars, 100 μm. (B) Epithelial Fut2 expression in part 1 and part 4 of the small intestines of GF and S. typhimurium–infected GF mice was analyzed by using quantitative PCR (n = 3 to 4 mice per group). Error bars indicate SD. **P < 0.01 by using Student’s t test. (C) Whole-mount tissues from ileum of S. typhimurium–infected Rorc+/+ or Rorcgfp/gfp mice were isolated and stained with UEA-1 (red) and WGA (green) (n = 3 to 4 mice per group). Scale bars, 100 μm. (D and E) Fut2+/+ or Fut2−/− mice were infected with S. typhimurium. Red arrow shows inflammation of the cecum. Representative macroscopic images (D) and hematoxylin and eosin–stained cecal sections (E) of infected or uninfected mice (n = 5 mice per group). Scale bars, 100 μm. (F) Numbers of bacteria in the luminal contents, and within the tissues, of the ceca of Fut2+/+ or Fut2−/− mice were counted 24 hours after infection (n = 5 mice per group). *P < 0.05 by using Student’s t test. NS, not significant. Three independent experiments were performed with similar results.
Fig. 7
Fig. 7. Scheme for the induction and regulation of epithelial fucosylation by ILC3
IL-22– and LTα-producing ILC3 are critical cells for the induction and regulation of F-ECs. ILC3-mediated fucosylation of ECs is operated by commensal microbiota–dependent and –independent manners. Commensal bacteria, including SFB, stimulate CD90+ ILC3 to produce IL-22 for the induction of Fut2 in ECs. On the other hand, LTα production by ILC3 are operated by a commensal bacteria–independent manner. ILC3-derived IL-22 and LTα induce Fut2 and subsequent epithelial fucosylation, which inhibits infection by S. typhimurium. IEC, intestinal epithelial cell.

Comment in

Similar articles

Cited by

References

    1. Goto Y, Ivanov II. Intestinal epithelial cells as mediators of the commensal-host immune crosstalk. Immunol Cell Biol. 2013;91:204–214. doi: 10.1038/icb.2012.80. - DOI - PMC - PubMed
    1. Qiu J, et al. Group 3 innate lymphoid cells inhibit T-cell-mediated intestinal inflammation through aryl hydrocarbon receptor signaling and regulation of microflora. Immunity. 2013;39:386–399. doi: 10.1016/j.immuni.2013.08.002. - DOI - PMC - PubMed
    1. Sanos SL, et al. RORgammat and commensal microflora are required for the differentiation of mucosal interleukin 22-producing NKp46+ cells. Nat Immunol. 2009;10:83–91. doi: 10.1038/ni.1684. - DOI - PMC - PubMed
    1. Satoh-Takayama N, et al. Microbial flora drives interleukin 22 production in intestinal NKp46+ cells that provide innate mucosal immune defense. Immunity. 2008;29:958–970. doi: 10.1016/j.immuni.2008.11.001. - DOI - PubMed
    1. Vaishnava S, et al. The antibacterial lectin RegIIIγ promotes the spatial segregation of microbiota and host in the intestine. Science. 2011;334:255–258. doi: 10.1126/science.1209791. - DOI - PMC - PubMed

Publication types

MeSH terms

Associated data