

Sustained release of prostaglandin E₂ in fibroblasts expressing ectopically cyclooxygenase 2 impairs P2Y-dependent Ca²⁺-mobilization
- PMID: 25214717
- PMCID: PMC4151624
- DOI: 10.1155/2014/832103
Sustained release of prostaglandin E₂ in fibroblasts expressing ectopically cyclooxygenase 2 impairs P2Y-dependent Ca²⁺-mobilization
Abstract
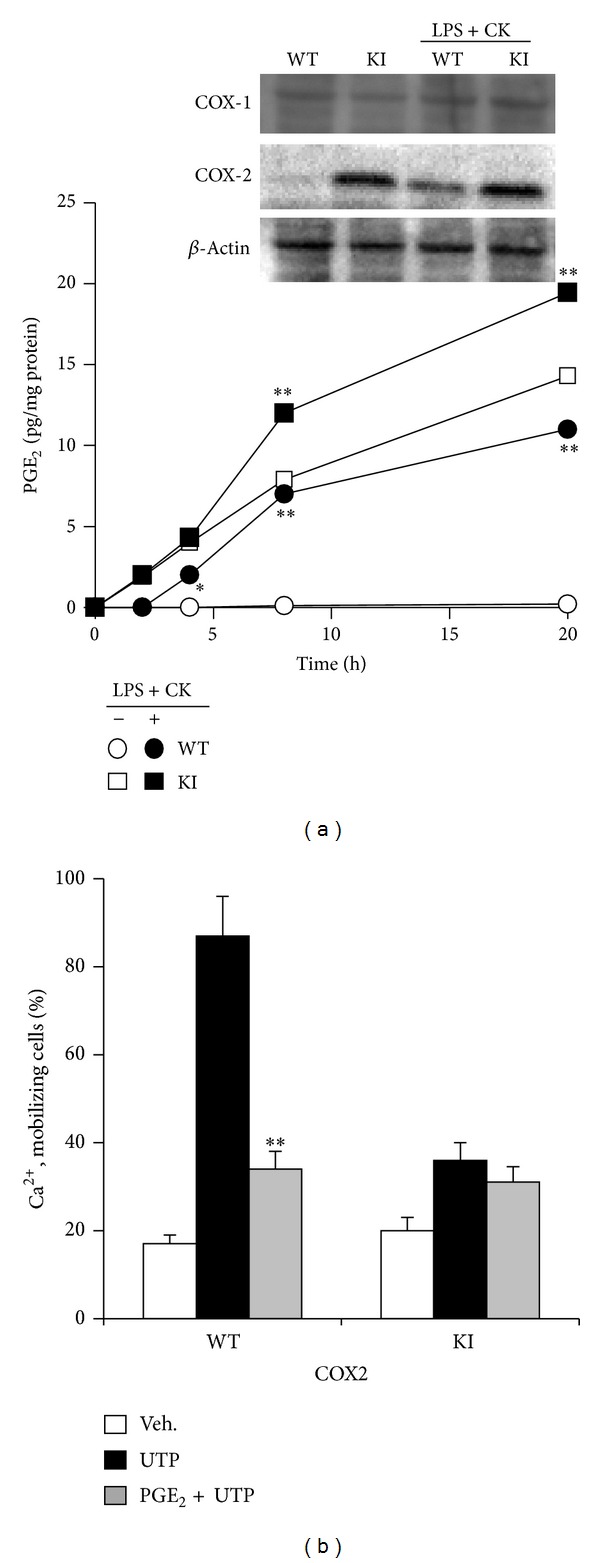
The nucleotide uridine trisphosphate (UTP) released to the extracellular milieu acts as a signaling molecule via activation of specific pyrimidine receptors (P2Y). P2Y receptors are G protein-coupled receptors expressed in many cell types. These receptors mediate several cell responses and they are involved in intracellular calcium mobilization. We investigated the role of the prostanoid PGE2 in P2Y signaling in mouse embryonic fibroblasts (MEFs), since these cells are involved in different ontogenic and physiopathological processes, among them is tissue repair following proinflammatory activation. Interestingly, Ca(2+)-mobilization induced by UTP-dependent P2Y activation was reduced by PGE2 when this prostanoid was produced by MEFs transfected with COX-2 or when PGE2 was added exogenously to the culture medium. This Ca(2+)-mobilization was important for the activation of different metabolic pathways in fibroblasts. Moreover, inhibition of COX-2 with selective coxibs prevented UTP-dependent P2Y activation in these cells. The inhibition of P2Y responses by PGE2 involves the activation of PKCs and PKD, a response that can be suppressed after pharmacological inhibition of these protein kinases. In addition to this, PGE2 reduces the fibroblast migration induced by P2Y-agonists such as UTP. Taken together, these data demonstrate that PGE2 is involved in the regulation of P2Y signaling in these cells.
Figures


Similar articles
-
Crosstalk between P2Y receptors and cyclooxygenase activity in inflammation and tissue repair.Purinergic Signal. 2024 Apr;20(2):145-155. doi: 10.1007/s11302-023-09938-x. Epub 2023 Apr 13. Purinergic Signal. 2024. PMID: 37052777 Free PMC article. Review.
-
Prostaglandin E2 Impairs P2Y2/P2Y4 Receptor Signaling in Cerebellar Astrocytes via EP3 Receptors.Front Pharmacol. 2017 Dec 22;8:937. doi: 10.3389/fphar.2017.00937. eCollection 2017. Front Pharmacol. 2017. PMID: 29311938 Free PMC article.
-
Selective impairment of P2Y signaling by prostaglandin E2 in macrophages: implications for Ca2+-dependent responses.J Immunol. 2013 Apr 15;190(8):4226-35. doi: 10.4049/jimmunol.1203029. Epub 2013 Mar 11. J Immunol. 2013. PMID: 23479225
-
ATP induces contraction of cultured brain capillary pericytes via activation of P2Y-type purinergic receptors.Am J Physiol Heart Circ Physiol. 2021 Feb 1;320(2):H699-H712. doi: 10.1152/ajpheart.00560.2020. Epub 2020 Dec 11. Am J Physiol Heart Circ Physiol. 2021. PMID: 33306443
-
Important roles of P2Y receptors in the inflammation and cancer of digestive system.Oncotarget. 2016 May 10;7(19):28736-47. doi: 10.18632/oncotarget.7518. Oncotarget. 2016. PMID: 26908460 Free PMC article. Review.
Cited by
-
Crosstalk between P2Y receptors and cyclooxygenase activity in inflammation and tissue repair.Purinergic Signal. 2024 Apr;20(2):145-155. doi: 10.1007/s11302-023-09938-x. Epub 2023 Apr 13. Purinergic Signal. 2024. PMID: 37052777 Free PMC article. Review.
-
Prostaglandin E2 Impairs P2Y2/P2Y4 Receptor Signaling in Cerebellar Astrocytes via EP3 Receptors.Front Pharmacol. 2017 Dec 22;8:937. doi: 10.3389/fphar.2017.00937. eCollection 2017. Front Pharmacol. 2017. PMID: 29311938 Free PMC article.
-
The role of ATP signalling in response to mechanical stimulation studied in T24 cells using new microphysiological tools.J Cell Mol Med. 2018 Apr;22(4):2319-2328. doi: 10.1111/jcmm.13520. Epub 2018 Feb 1. J Cell Mol Med. 2018. PMID: 29392898 Free PMC article.
-
Nucleotides-Induced Changes in the Mechanical Properties of Living Endothelial Cells and Astrocytes, Analyzed by Atomic Force Microscopy.Int J Mol Sci. 2021 Jan 10;22(2):624. doi: 10.3390/ijms22020624. Int J Mol Sci. 2021. PMID: 33435130 Free PMC article.
References
-
- Burnstock G. A basis for distinguishing two types of purinergic receptor. In: Straub RW, Bolis L, editors. Cell Membrane Receptors for Drugs and Hormones: A Multidisciplinary Approach. New York, NY, USA: Raven Press; 1978. pp. 107–118.
-
- North RA, Barnard EA. Nucleotide receptors. Current Opinion in Neurobiology. 1997;7(3):346–357. - PubMed
-
- Abbracchio MP, Burnstock G. Purinoceptors: are there families of P2X and P2Y purinoceptors? Pharmacology and Therapeutics. 1994;64(3):445–475. - PubMed
-
- Burnstock G, Kennedy C. Is there a basis for distinguishing two types of P2-purinoceptor? General Pharmacology. 1985;16(5):433–440. - PubMed
-
- Ferrero ME. Purinoceptors in inflammation: fotential as anti-inflammatory therapeutic targets. Frontiers in Bioscience. 2011;16(6):2172–2186. - PubMed
Publication types
MeSH terms
Substances
LinkOut - more resources
Full Text Sources
Other Literature Sources
Research Materials
Miscellaneous
