. 2014:2014:973986.
doi: 10.1155/2014/973986. Epub 2014 Aug 20.

Metformin attenuates experimental autoimmune arthritis through reciprocal regulation of Th17/Treg balance and osteoclastogenesis

Affiliations

Metformin attenuates experimental autoimmune arthritis through reciprocal regulation of Th17/Treg balance and osteoclastogenesis

Hye-Jin Son et al. Mediators Inflamm. 2014.

Abstract

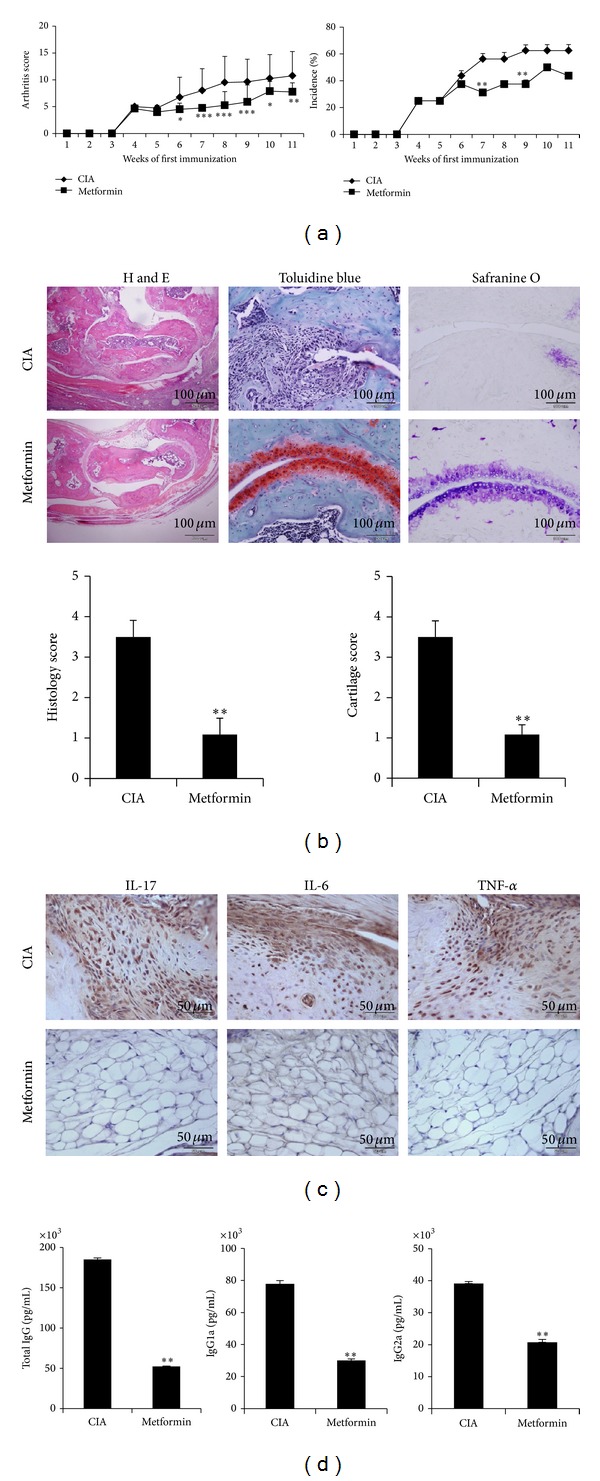
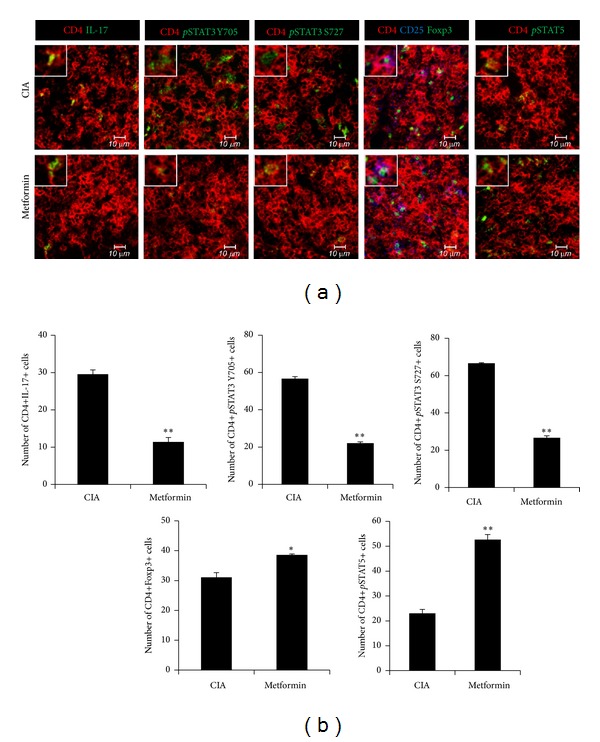
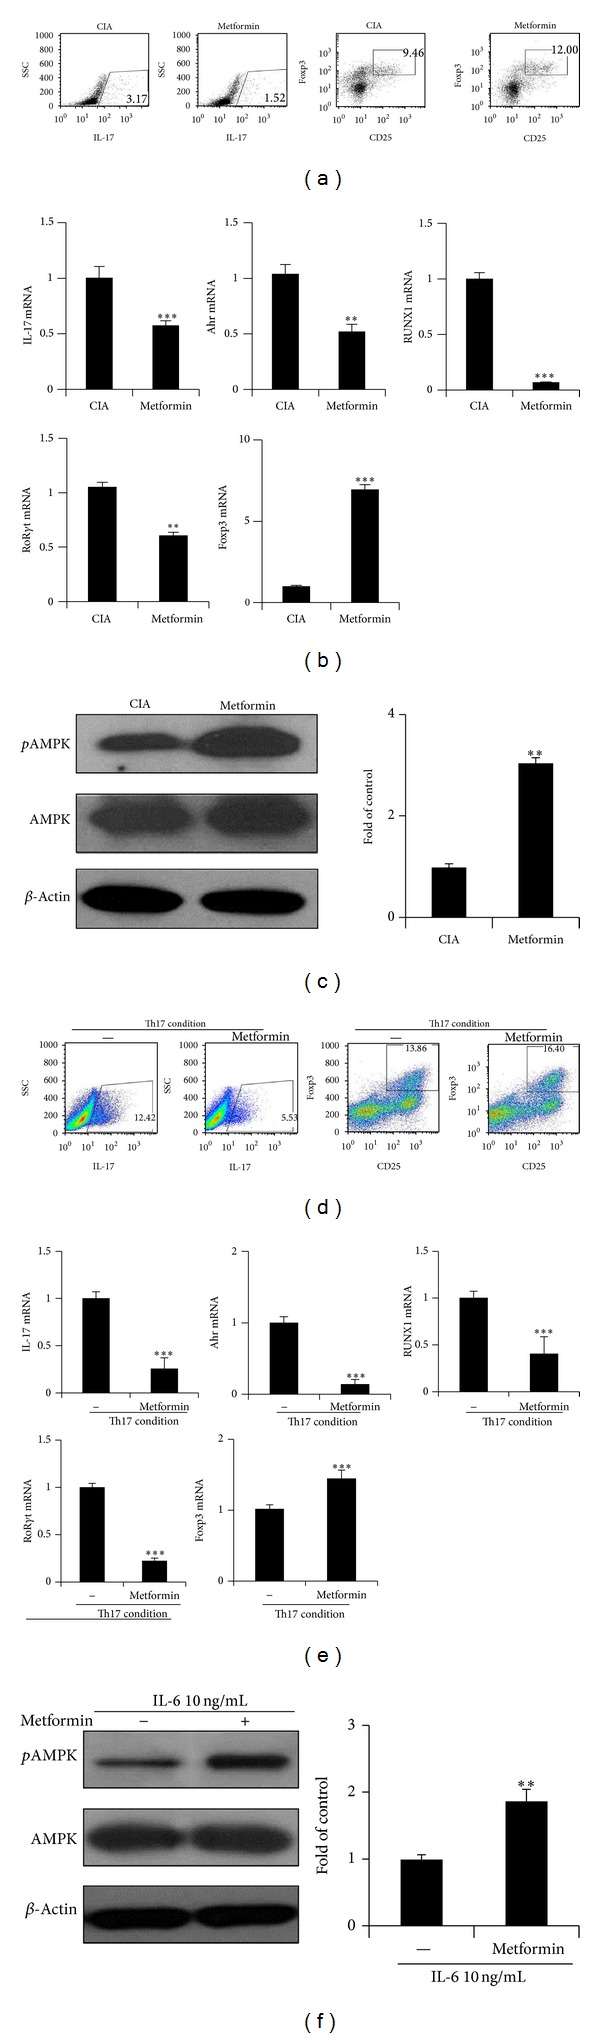
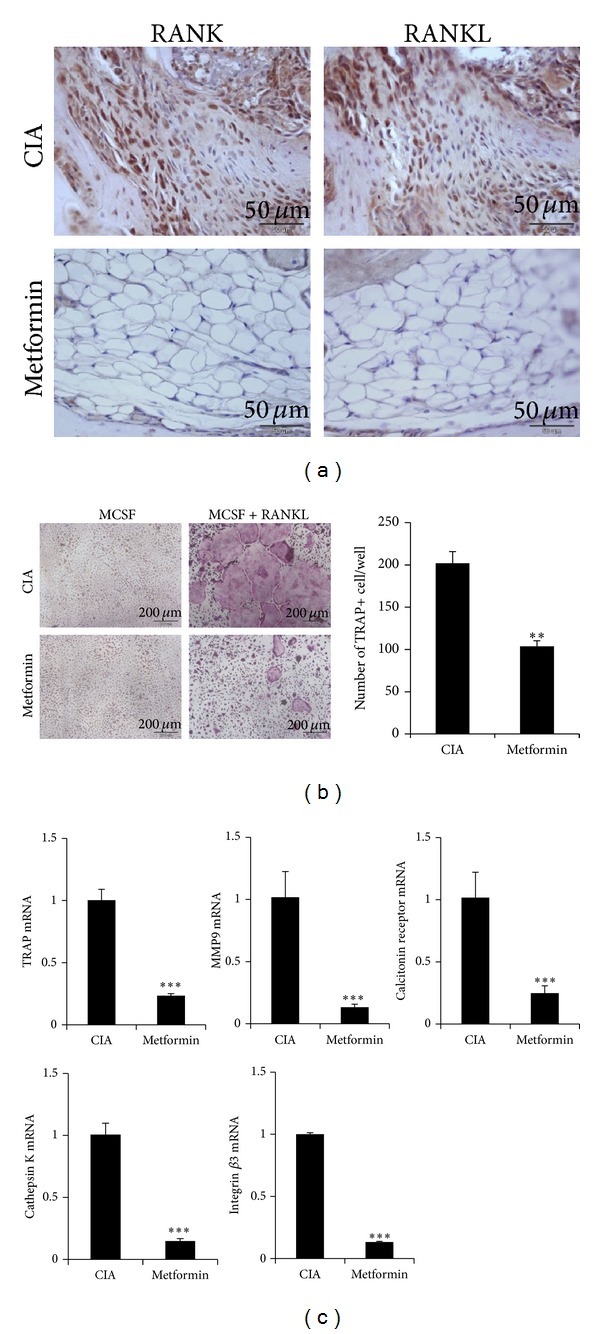
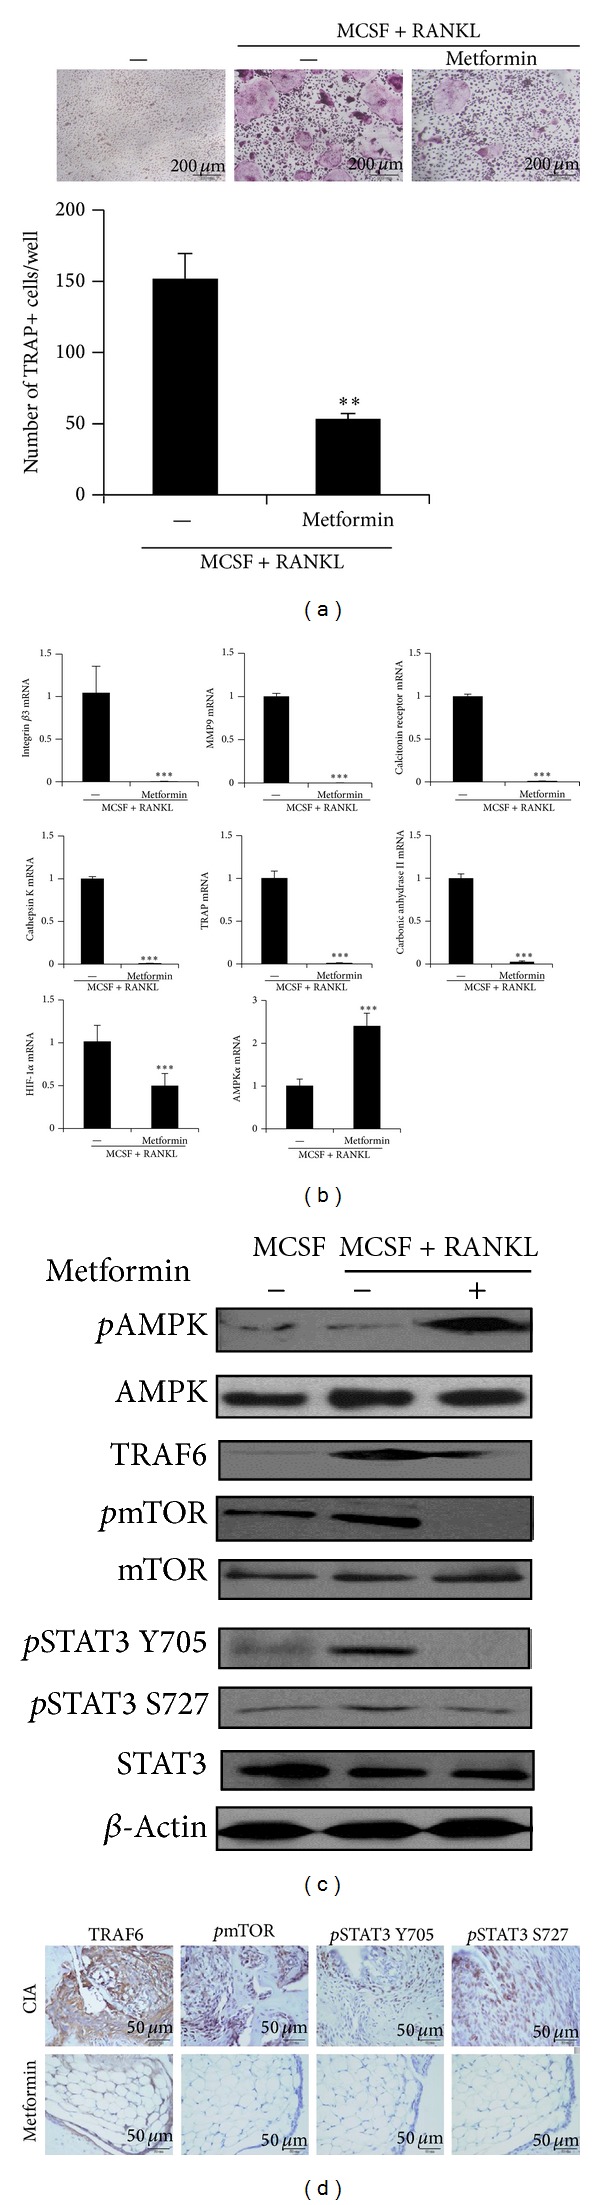
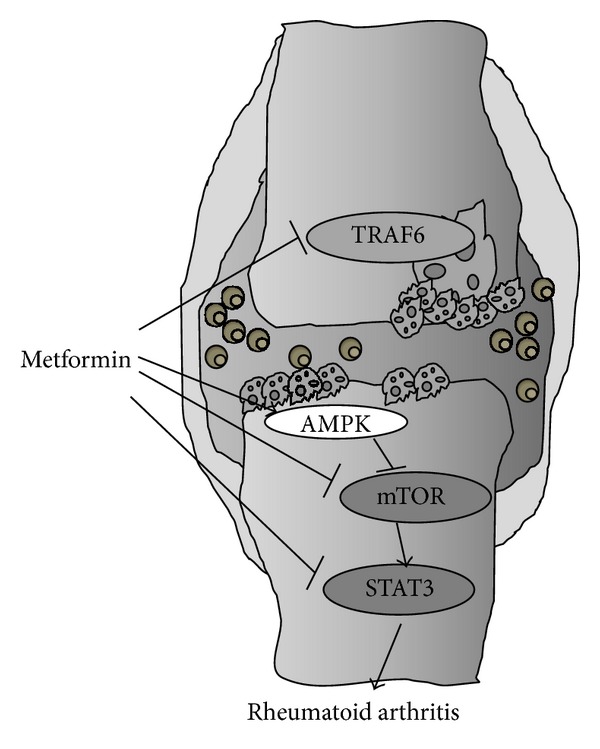
Metformin is widely used to suppress certain functions of the cells found in diseases including diabetes and obesity. In this study, the effects of metformin on downregulating IL-17-producing T (Th17) cells, activating and upregulating regulatory T (Treg) cells, suppressing osteoclastogenesis, and clinically scoring collagen-induced arthritis (CIA) were investigated. To evaluate the effect of metformin on CIA, mice were orally fed with either metformin or saline as control three times a week for nine weeks. Histological analysis of the joints was performed using immunohistochemistry and Th17 cells and Treg cells of the spleen tissue were examined by confocal microscopy staining. Metformin mitigated the severity of CIA, reduced serum immunoglobulin concentrations, and reciprocally regulated Th17/Treg axis. Also, metformin treatment of normal cells cultured in Th17 conditions decreased the number of Th17 cells and increased the number of Treg cells. Metformin decreased gene expression and osteoclastogenic activity in CIA and normal mice. These results indicate that metformin had immunomodulatory actions influencing anti-inflammatory action on CIA through the inhibition of Th17 cell differentiation and the upregulation of Treg cell differentiation along with the suppression of osteoclast differentiation. Our results suggest that metformin may be a potential therapeutic for rheumatoid arthritis.


Figures

Figure 1
Figure 1
Therapeutic effects of metformin in CIA model. CIA was induced in C57BL/6 mice. Metformin 5 mg/mice (n = 10) or saline (n = 10) was oral feed three times into CIA in a week. Mice were sacrificed on day 70 after first immunization. (a) Clinical arthritis scores were determined. (b) The joint tissues from CIA: metformin-treated CIA mice were stained with H&E, safranin O, and toluidine blue (original magnification, ×200). The average histopathological score is shown in bar graphs (below) (scale bar = 100 μm). (c) Immunohistochemical detection of IL-17, IL-6, and TNF-α was stained in the synovium of CIA and metformin-treated CIA. All tissues were counterstained with hematoxylin (original magnification, ×400). All images were obtained for each mouse (n = 10), showing representative images (scale bar = 50 μm). (d) Mice serum was obtained on day 30 after CII immunization. The serum obtained after first immunization. The levels of IgG, IgG1, and IgG2a antibodies were measured from each group. Mean ± SD of three independent experiments (*P < 0.05; **P < 0.01).
Figure 2
Figure 2
Regulation of Th17 cells and Foxp3+ regulatory T cells in CIA spleen. Spleen tissue was obtained from metformin-treated CIA and control CIA on day 35 after first immunization. (a) Confocal staining examined by antibodies: Th17 cell was stained with CD4 (red) and IL-17 (green). CD4+ CD25+ Foxp3+ regulatory T cells were stained with CD4 (red), CD25 (blue), and Foxp3 (green). For activated STATs analysis, the tissues were stained with CD4 and pSTAT3 S727, pSTAT3 Y705, or pSTAT5. All images were performed for each mouse (n = 5), showing representative images (scale bar = 10 μm). (b) The mean values are presented in the form of a histogram by four individuals. Results are shown as mean ± SD (n = 5 mice per group). Mean ± SD of three independent experiments (*P < 0.05; **P < 0.01).
Figure 3
Figure 3
Treatment with metformin Treg cells and decreases Th17 cells in CIA mice and in vitro Th17 polarizing condition. (a–c) Splenocytes were also obtained from metformin-treated CIA (n = 5) and control CIA (n = 5) on day 35 after first immunization. (a) Both isolated CD4+ T cells were stained with anti-CD25, anti-Foxp3, and anti-IL-17 antibody. The proportions of CD4+IL-17+ T cells and CD4+CD25+ Foxp3+ regulatory T cells were analyzed using flow cytometry. (b) The gene levels of IL-17, Ahr, RUNX1, RORγT, and Foxp3 in splenocytes were determined by real-time PCR. (c) The expressions of phosphorylated AMPK were measured by western blot. The fold of control measured pAMPK/AMPK/β-actin ratio (right). (d–f) Isolated CD4+ T cells of C57BL/6 mice were cultured with under Th17 polarizing conditions in the presence or absence of 1 mM metformin for 3 days. (d) The cells were stained with anti-CD4, anti-CD25, anti-IL-17, and anti-Foxp3. (e) The mRNA expression levels of IL-17, Ahr, RUNX1, RORγT, and Foxp3 were determined by real-time PCR. (f) CD4+ T cells were stimulated with IL-6 10 ng/mL in the presence or absence of metformin 1 mM for 1 hour. The activation of pAMPK was measured by western blot. The representative results are shown in the right panel. Data are presented as the mean ± SD of four independent experiments (*P < 0.05; **P < 0.01; ***P < 0.005).
Figure 4
Figure 4
Metformin inhibits osteoclast formation in CIA mice. (a) Joint tissues of CIA control mice (n = 5) and metformin-treated CIA (n = 5) were stained with anti-RANKL and anti-RANK antibodies 70 days after the first immunization. All images were obtained for each mouse (n = 5), showing representative images (scale bar = 50 μm). (b) Isolated preosteoclasts from each group were cultured with 10 ng/mL M-CSF and/or 50 ng/mL RANK. Differentiated osteoclasts were stained with TRAP. The TRAP+ cells were indicated in graph (right) (scale bar = 200 μm). (c) The mRNA expressions of TRAP, MMP-9, calcitonin receptor, cathepsin K, and integrin β3 as osteoclast markers were quantified by real-time PCR. Data are presented as the mean ± SD of four independent experiments (*P < 0.05; **P < 0.01; ***P < 0.005).
Figure 5
Figure 5
Metformin suppresses osteoclastogenesis in vitro. C57BL/6 mice preosteoclasts were cultured in the presence of 10 ng/mL M-CSF and/or 50 ng/mL RANKL in the presence or absence of metformin 1 mM. (a) Differentiated osteoclasts were stained for TRAP (scale bar = 200 μm) and The TRAP+ cells were indicated in graph (under). (b) The mRNA levels of TRAP, MMP-9, calcitonin receptor, carbonic anhydrase II, cathepsin K, integrin β3, HIF1-α, and AMPK were quantified by real-time PCR. (c) Protein levels of pAMPK, TRAF6, pmTOR, mTOR, pSTAT3 Y705, pSTAT3 S727, STAT3, and β-actin were analyzed using Western blot in osteoclasts. (d) Immunohistochemical detection of TRAF6, pmTOR pSTAT3 Y705, and pSTAT3 S727 were stained in the synovium of CIA and metformin-treated CIA. All tissues were counterstained with hematoxylin (original magnification, ×400) (scale bar = 50 μm). Data are presented as the mean ± SD of four independent experiments (*P < 0.05; **P < 0.01; ***P < 0.005).
Figure 6
Figure 6
The signaling pathway that metformin uses to regulate T cell and osteoclasts in autoimmune arthritis.

Similar articles

Cited by

References

    1. Feldmann M, Brennan FM, Maini RN. Rheumatoid arthritis. Cell. 1996;85(3):307–310. - PubMed
    1. McInnes IB, Schett G. The pathogenesis of rheumatoid arthritis. The New England Journal of Medicine. 2011;365(23):2205–2219. - PubMed
    1. Lee YK, Mukasa R, Hatton RD, Weaver CT. Developmental plasticity of Th17 and Treg cells. Current Opinion in Immunology. 2009;21(3):274–280. - PubMed
    1. Zhou G, Myers R, Li Y, et al. Role of AMP-activated protein kinase in mechanism of metformin action. The Journal of Clinical Investigation. 2001;108(8):1167–1174. - PMC - PubMed
    1. Rena G, Pearson ER, Sakamoto K. Molecular mechanism of action of metformin: old or new insights? Diabetologia. 2013;56(9):1898–1906. - PMC - PubMed

Publication types

MeSH terms