. 2014 Sep 11;158(6):1309-1323.
doi: 10.1016/j.cell.2014.07.048.

Cell-state-specific metabolic dependency in hematopoiesis and leukemogenesis

Affiliations

Cell-state-specific metabolic dependency in hematopoiesis and leukemogenesis

Ying-Hua Wang et al. Cell. .

Abstract

The balance between oxidative and nonoxidative glucose metabolism is essential for a number of pathophysiological processes. By deleting enzymes that affect aerobic glycolysis with different potencies, we examine how modulating glucose metabolism specifically affects hematopoietic and leukemic cell populations. We find that a deficiency in the M2 pyruvate kinase isoform (PKM2) reduces the levels of metabolic intermediates important for biosynthesis and impairs progenitor function without perturbing hematopoietic stem cells (HSCs), whereas lactate dehydrogenase A (LDHA) deletion significantly inhibits the function of both HSCs and progenitors during hematopoiesis. In contrast, leukemia initiation by transforming alleles putatively affecting either HSCs or progenitors is inhibited in the absence of either PKM2 or LDHA, indicating that the cell-state-specific responses to metabolic manipulation in hematopoiesis do not apply to the setting of leukemia. This finding suggests that fine-tuning the level of glycolysis may be explored therapeutically for treating leukemia while preserving HSC function.


Figures

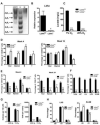
Figure 1
Figure 1. Conditional deletion of PKM2 in mouse BM
(A) PKM2 is the predominant PK isoform expressed by BM hematopoietic cells. RNA was prepared from muscle (M), spleen (Spl), whole BM (WBM), BM subsets (LKS, SLAM, GMP), (A) and leukemic cell lines (K562, THP1). PKM transcript was amplified by RT-PCR, followed by digestion with PstI for exon 10 (PKM2) and/or NcoI for exon 9 (PKM1). Un, uncut WBM. (B) qPCR assay of PKM2 expression in BM subsets. WBM (whole BM), LK (LincKit+Sca1), LS (LincKitSca1+), LKS (LincKit+Sca1+). (C) PKM2fl/fl:Mx1-cre+ (M2−/−) or PKM2fl/fl:Mx1-cre (M2fl/fl) mice were injected with poly(I:C) to delete the exon 10 of PKM2. Genomic DNA isolated from BM MNCs was analyzed by PCR (upper panel). cDNA was amplified and digested by restriction enzyme as described in A (lower panel). Arrow indicates the misspliced PKM transcript. (D) qPCR of PKM2 and PKM1 transcripts from PKM2fl/fl and PKM2−/− BM cells. (E) Western blotting of PKM proteins in BM MNCs. (F) Flow cytometry analysis of PKM2 (left) and PKM1 (right) expressing cells in the BM. (n=4-5). Representative FACS plots were shown in Figure S1.
Figure 2
Figure 2. Deletion of PKM2 affects long-term reconstitution potential of HSCs
(A) BM MNCs from PKM2fl/fl and PKM2−/− mice (CD45.1+) were mixed with competitor BM cells (CD45.2+) at 1:1 ratio and transplanted into lethally irradiated hosts (CD45.2+). Chimerism of multiple-lineage mature cells including myeloid (Gr1+CD11b+), B (CD19+) and T (CD3? +) cells, was analyzed at indicated time points (*p<0.05, n=9). (B) BM chimerism of recipient mice from A was analyzed at 24–week point post transplantation (*p<0.05, n=9). (C) HSPCs were sorted from the primary recipient mice and transplanted with competitor BM cells into lethally irradiated hosts. PB was analyzed for mature cell chimerism (*p<0.05, **p<0.01, n=9-10). (D) HSPCs were sorted from secondary recipient mice and transplanted with competitor BM cells into lethally irradiated hosts and blood chimerism was analyzed at week four (*p<0.05, n=6). (E) BM NMCs from PKM2 fl/fl:Mx1-cre+ or PKM2fl/fl:Mx1-cre- mice (no poly(I:C) treatment) were transplanted with competitor BM at 1:1 ratio into lethally irradiated hosts. After 10 weeks, the recipient mice received three doses of poly(I:C) and peripheral blood chimerism was analyzed after 20 weeks. The left panel shows the total white blood cell chimerism on the day prior to poly(I:C) treatment and the right panel shows chimerism at 20-week time point post poly(I:C) injection (*p<0.05, **p<0.01, ***p<0.001, n=6-9). (F) Cell cycle status of HSPCs from the primary BM transplantation recipient mice (*p<0.05, **p<0.01, n=4-5). (G) Proliferation assay of HSPCs. Equal number of LKS cells from PKM2fl/fl and PKM2−/− mice were cultured in methylcellulose medium for 7 days under hypoxic condition and cell number was counted (*p<0.05, n=3). For all bar graphs, data represented as the mean ± SEM.
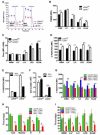
Figure 3
Figure 3. Metabolic characterization of PKM2 deleted HSPCs
(A) Pimo staining to assess the redox state in HSPCs. Pimo was injected into PKM2fl/fl and PKM2−/− mice. Ninety minutes later BM cells were harvested and stained with surface markers, followed by intracellular staining with anti-Pimo antibody. Samples were then analyzed by FACS. (*p<0.05, **p<0.01, ***p<0.001, n=5). (B) Mitochondrial membrane potential measurement with TMRE staining followed by flow cytometry analysis (*p<0.05, ***p<0.001, n=5-6). (C) Measurement of lactate production. LKS and LK cells were incubated in serum free medium under normoxia (20% O2) or hypoxia (1% O2) conditions. The concentration of lactate in the supernatant was measured 12 hours later (**p<0.01, ***p<0.001, n=3). (D) Oxygen consumption assay. Lin cells were isolated and oxygen consumption rate (OCR) was measured by a Seahorse XF24 Analyzer. (E and F) HSPCs were incubated in serum free medium for 12 hours. Cellular metabolites were extracted with 80% ice-cold methanol and analyzed by LC-MS. The relative abundance of central metabolites (E) and amino acids (F) were shown. For all bar graphs, data represented as the mean ± SEM.
Figure 4
Figure 4. LDHA plays important roles in long-term hematopoiesis
(A) In-gel zymography of LDHA and LDHB in HSPC, heart (H) and muscle (M). (B) qPCR analysis of LDHA transcripts in BM MNCs from LDHAfl/fl:Mx1-cre+ (LDHA−/−) and LDHAfl/fl:Mx1-cre+ (LDHAfl/fl) following poly(I:C) injection (***p<0.05, n=3). (C) Lactate production by HSPCs. HSPCs were incubated in serum free medium under normoxia (20% O2) or hypoxia (1% O2) conditions for 12 hours. The concentration of lactate in the supernatant was measured (***p<0.001, n=3). (D) PB chimerism in primary BM transplantation (**p<0.01, ***p<0.001, n=10). (E) PB chimerism in secondary BM transplantation (**p<0.01, ***p<0.001, n=7-10). (F) BM chimerism in secondary recipients 24 weeks post transplantation (***p<0.001, n=5-9). (G) HSPCs were plated in methylcellulose medium and incubated under nomoxic (20% O2) or hypoxic (1% O2) conditions for seven days. The numbers of colonies (left panel) and cells per colony (right panel) were counted (***p<0.001, n=3-4). (H) Cell cycle analysis shows LDHA deletion reduces the frequency of cycling cells (S/G2/M) in both LKS and SLAM populations (*p<0.05, **p<0.01, ***p<0.001, n=5-6). For all bar graphs, data represented as the mean ± SEM. Please also see Figure S3.
Figure 5
Figure 5. Antioxidant Treatment Partially Rescues the Functional Defects of LDHA−/− BM cells in vitro and in vivo
(A) Lin cells were isolated from LDHAfl/fl and LDHA−/− mice and oxygen consumption rate (OCR) was measured by a Seahorse XF24 Analyzer. (B) Mitochondrial membrane potential measurement with TMRE staining followed by flow cytometry analysis (*p<0.05, ***p<0.001, n=6-7). (C) Pimo staining shows higher oxidative state in LDHA−/− HSPCs and HSCs. (*p<0.05, **p<0.01, ***p<0.001, n=5). (D) ntracellular ROS levels were increased upon LDHA deletion,. (*p<0.05, **p<0.01, n=5). (E) n vitro NAC treatment reverses increased ROS in LDHA−/− HSPCs. Freshly isolated HSPCs were incubated in medium supplemented with (+NAC) or without NAC (-NAC) for 48 hours. Cells were then stained with carboxy-H2DCFDA followed by flow cytometry analysis (***p<0.001, n=3). (F) In vitro NAC treatment reverses the defects in daughter production of LDHA−/− HSPCs. 2000 HSPCs were cultured in methylcellulose medium with or without NAC for one week and cell number were counted (***p<0.001, n=3). (G) In vivo NAC treatment reverses increased ROS levels in LDHA−/− HSPCs. Immediately following poly(I:C) injection, LDHA-deficient and control mice were divided into two groups. One group was fed with regular water and the other group with water containing 40mM NAC for eight weeks. Intracellular ROS was accessed by staining with carboxy-H2DCFDA followed by flow cytometry analysis (***p<0.001, n=4-6). (H and I) In vivo NAC treatment partially rescues the long-term repopulation defects of LDHA−/− BM in serial transplantation assay. Serial transplantation was performed as described in Figure 4. In both primary and secondary transplantation, recipient mice were fed with either regular water (- NAC) or water containing 40mM NAC (+NAC) immediately following BMT. The duration of primary BMT is 16 weeks. The chimerism of hematopoietic cells in the blood (H) and BM (I) of the secondary recipients was analyzed 20 weeks post transplantation (*p<0.05, n=5). For all bar graphs, data represented as the mean ± SEM.
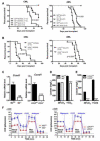
Figure 6
Figure 6. Loss of either PKM2 or LDHA extends disease latency of m yeloid leukemia in mice
(A) PKM2fl/fl:Mx1-cre+ and PKM2fl/fl:Mx1-cre mice were treated with poly(I:C). After 4 weeks these animals were given 5-FU (150mg/kg). Six days later BM mononuclear cells were harvested, infected with retrovirus expressing BCR-ABL (CML) or MLL-AF9 (AML) and transplanted into sublethally irradiated recipient mice for disease development. Kaplan-Meier survival curve of animals that developed leukemia was shown. (B) Kaplan-Meier survival analysis of animals transplanted with retrovirually transduced BM cells prepared from LDHAfl/fl and LDHA−/− mice. (C) qPCR analysis of Cyclin D1 (Ccnd1) mRNA expression in leukemic cells (**p<0.01,***p<0.001, n=3). Data represented as the mean ± SEM. (D) Lactate production by PKM2fl/fl and PKM2−/− CML cells (***P<0.001, n=5). Data represented as the mean ± SEM. (E) Lactate production by LDHAfl/fl and LDHA−/− AML cells (***P<0.001, n=3). Data represented as the mean ± SEM. (F) Measurement of oxygen consumption rate of AML leukemic cells. Please also see Figures S5-S7.
Figure 7
Figure 7. Deletion of PKM2 or LDHA retards progression of established leukemia without compromising normal hematopoietic cells
(A) Experimental scheme. BM MNCs from 5-FU treated PKM2fl/fl:Mx1-cre+ or LDHAfl/fl:Mx1-cre+ mice were infected with MLL-AF9 virus to generate primary leukemia. 50,000 primary leukemic cells (GFP+) were co-transplanted with 500,000 normal BM cells (GFP-) that contain the same floxed gene and Mx1-cre into lethally irradiated hosts. Seven to ten days later, the recipient mice were administered with or saline (PKM2fl/fl, LDHAfl/fl) or poly(I:C) to delete PKM2 or LDHA gene (PKM2−/−, LDHA−/−). At the first presentation of leukamia, all mice were euthanized to access leukemia burden. (B) Size and mean weight of spleens (n=6). Data represented as the mean ± SEM. (C) The numbers of leukemic cell (GFP+) and normal hematopoietic cells (GFP) in peripheral (D) The numbers of leukemic cell (GFP+) and normal hematopoietic cells (GFP) in the BM. For all the figures, *p<0.05, ***p<0.001, n=6. Data represented as the mean ± SEM.

Comment in

  • Leukaemia: fine-tuning metabolism.
    Seton-Rogers S. Seton-Rogers S. Nat Rev Cancer. 2014 Nov;14(11):705. doi: 10.1038/nrc3839. Epub 2014 Oct 6. Nat Rev Cancer. 2014. PMID: 25291292 No abstract available.

References

    1. Anastasiou D, Poulogiannis G, Asara JM, Boxer MB, Jiang JK, Shen M, Bellinger G, Sasaki AT, Locasale JW, Auld DS, et al. Inhibition of pyruvate kinase M2 by reactive oxygen species contributes to cellular antioxidant responses. Science. 2011;334:1278–1283. - PMC - PubMed
    1. Anastasiou D, Yu Y, Israelsen WJ, Jiang JK, Boxer MB, Hong BS, Tempel W, Dimov S, Shen M, Jha A, et al. Pyruvate kinase M2 activators promote tetramer formation and suppress tumorigenesis. Nat Chem Biol. 2012;8:839–847. - PMC - PubMed
    1. Baldin V, Lukas J, Marcote MJ, Pagano M, Draetta G. Cyclin D1 is a nuclear protein required for cell cycle progression in G1. Genes Dev. 1993;7:812–821. - PubMed
    1. Behringer B, Pitako JA, Kunzmann R, Schmoor C, Behringer D, Mertelsmann R, Lubbert M. Prognosis of older patients with acute myeloid leukemia receiving either induction or noncurative treatment: a single-center retrospective study. Ann Hematol. 2003;82:381–389. - PubMed
    1. Cairns RA, Harris IS, Mak TW. Regulation of cancer cell metabolism. Nat Rev Cancer. 2011;11:85–95. - PubMed

Publication types