. 2014 Sep 11;158(6):1415-1430.
doi: 10.1016/j.cell.2014.07.039.

Multilayered genetic and omics dissection of mitochondrial activity in a mouse reference population

Affiliations

Multilayered genetic and omics dissection of mitochondrial activity in a mouse reference population

Yibo Wu et al. Cell. .

Abstract

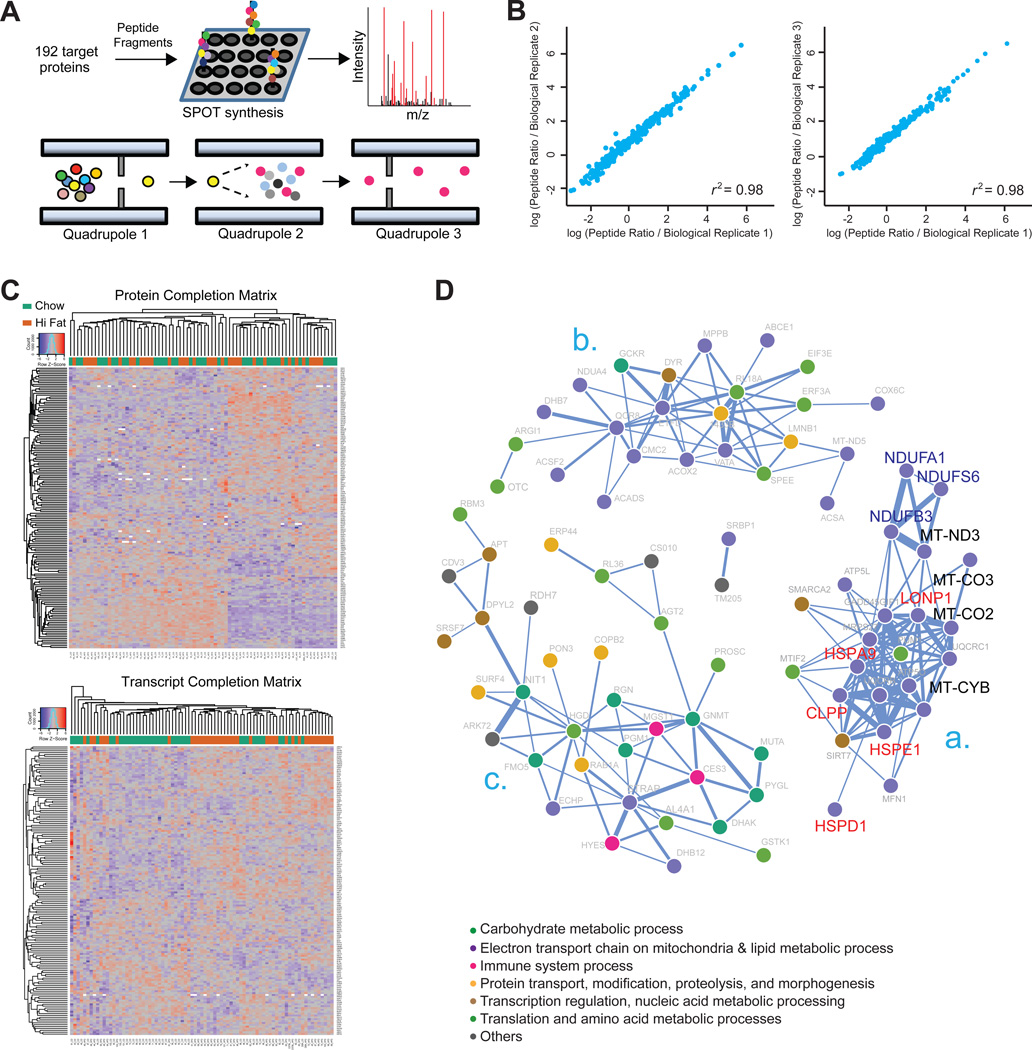
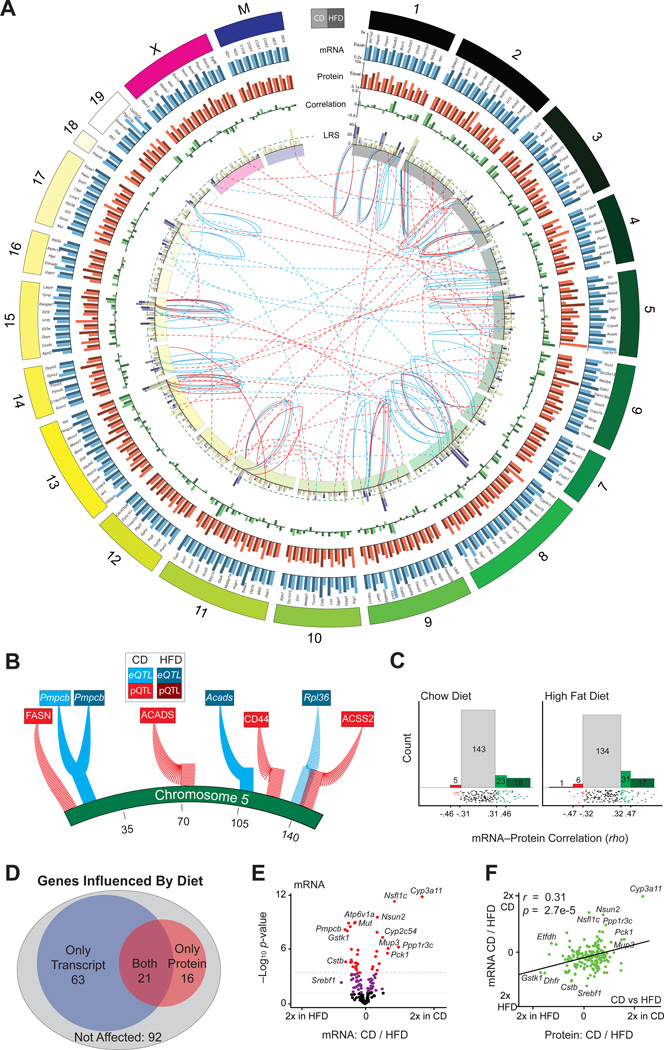
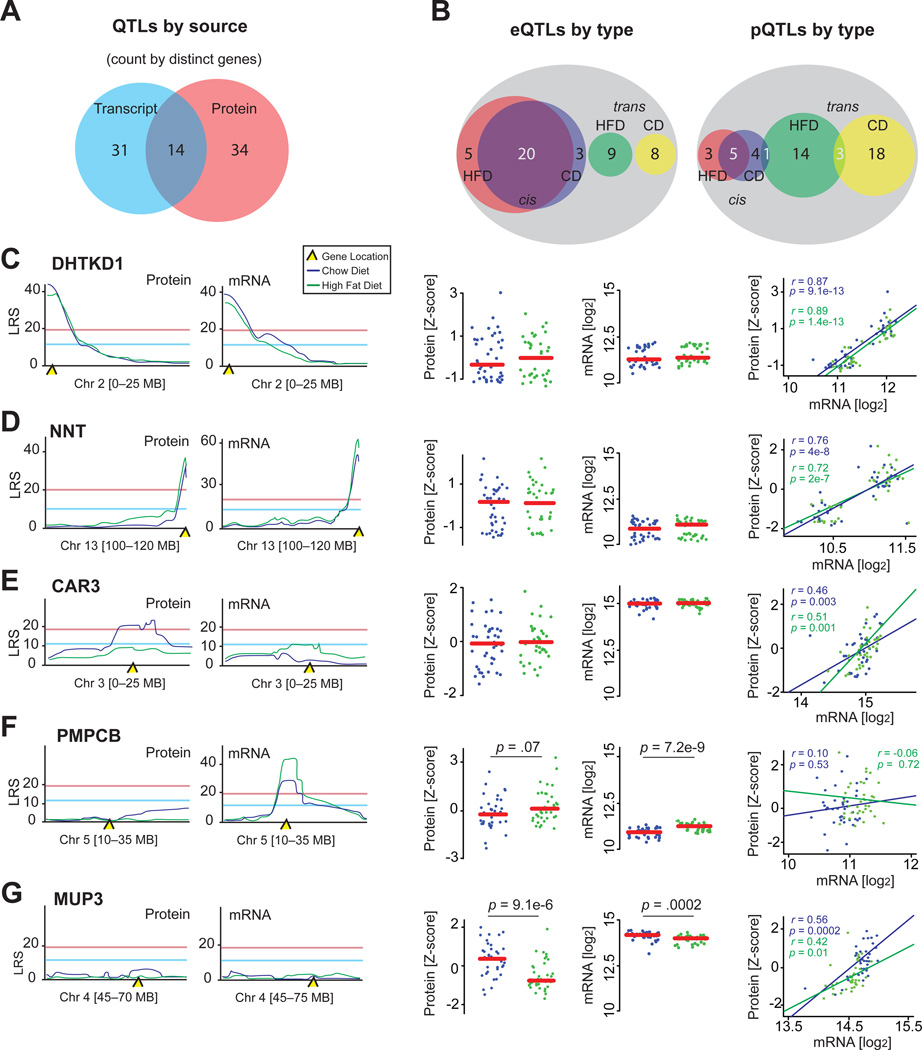
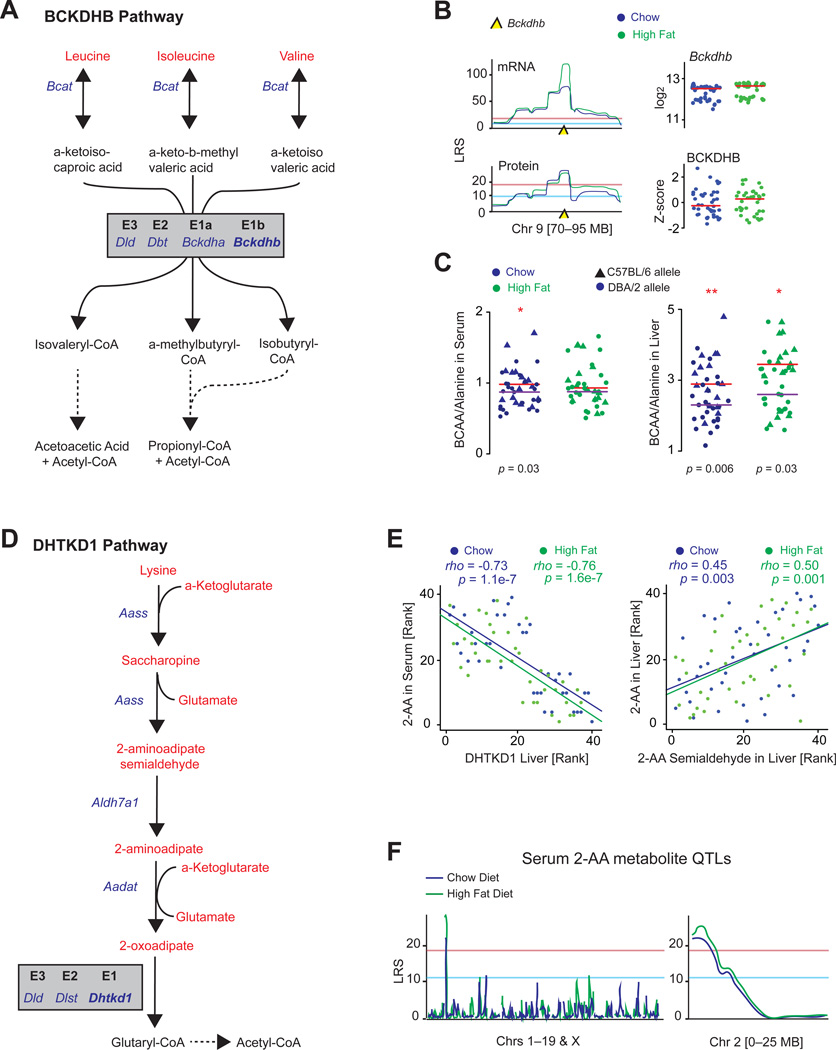
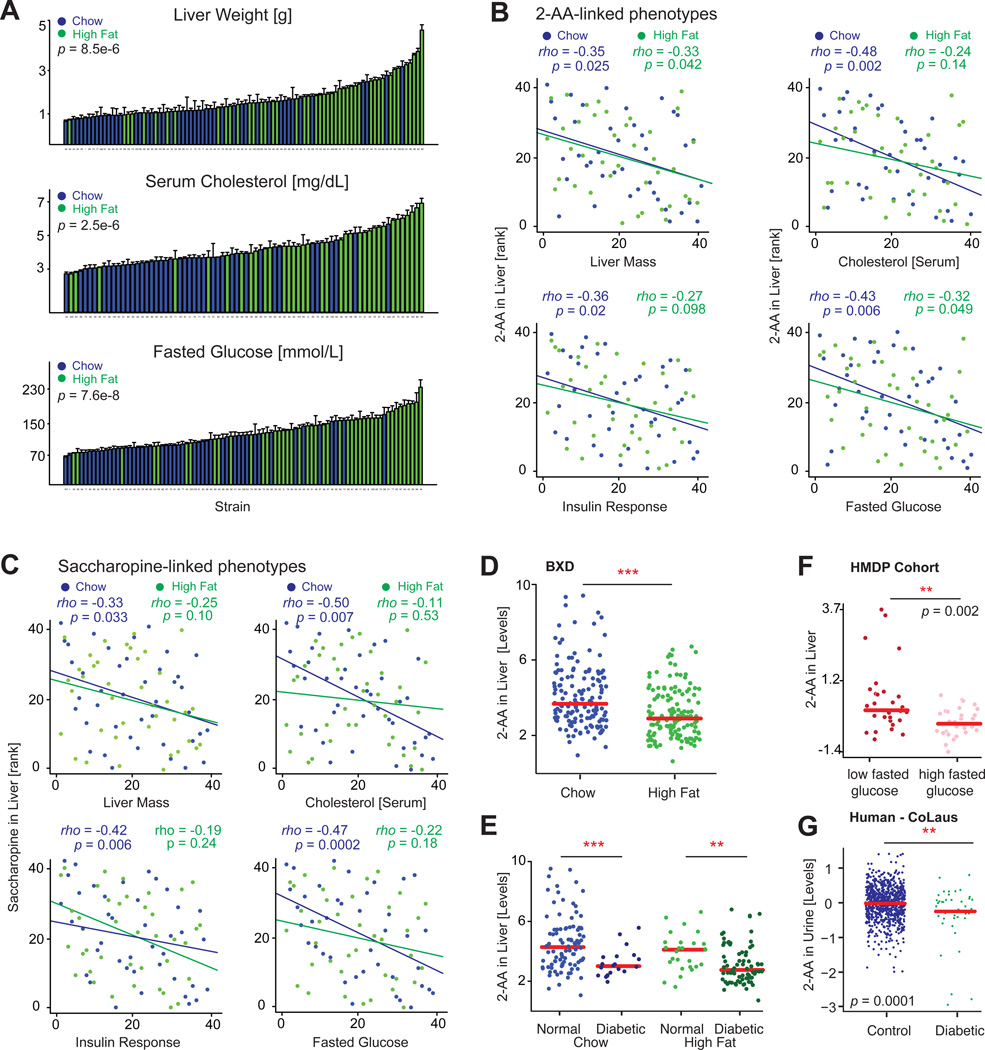
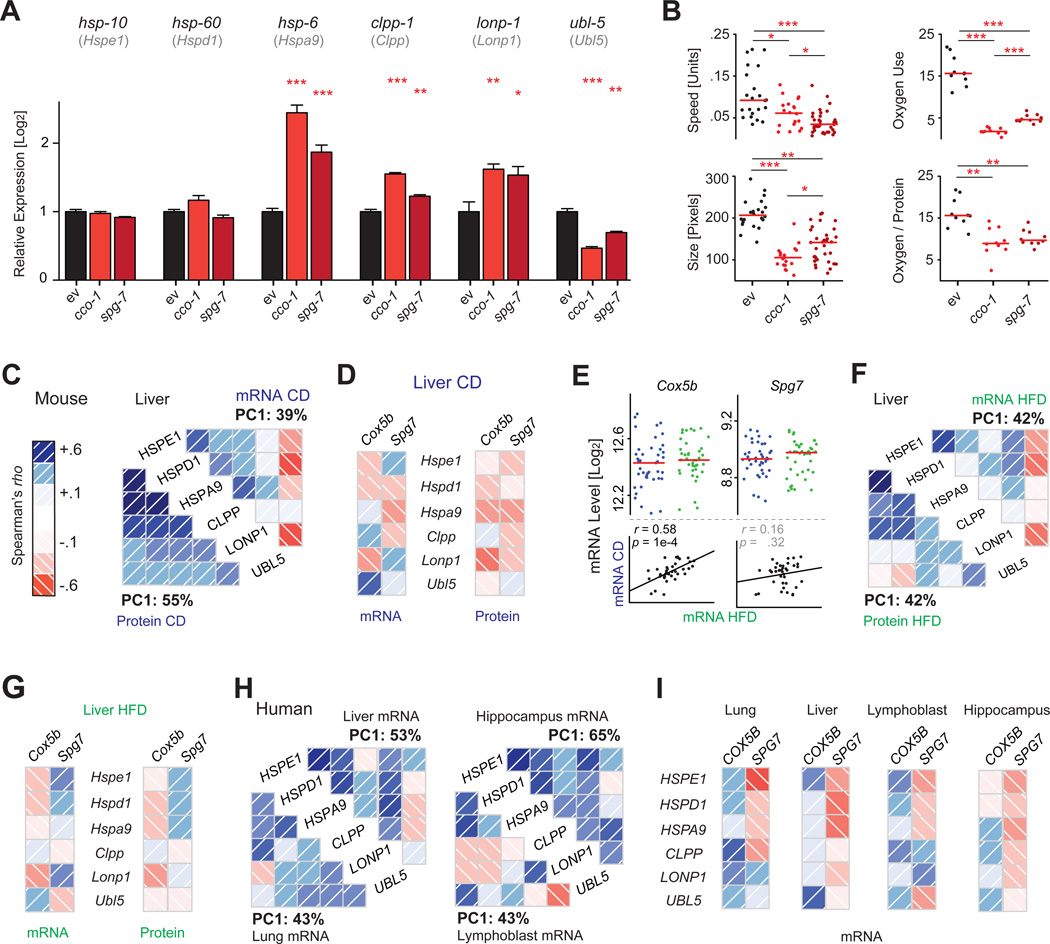
The manner by which genotype and environment affect complex phenotypes is one of the fundamental questions in biology. In this study, we quantified the transcriptome--a subset of the metabolome--and, using targeted proteomics, quantified a subset of the liver proteome from 40 strains of the BXD mouse genetic reference population on two diverse diets. We discovered dozens of transcript, protein, and metabolite QTLs, several of which linked to metabolic phenotypes. Most prominently, Dhtkd1 was identified as a primary regulator of 2-aminoadipate, explaining variance in fasted glucose and diabetes status in both mice and humans. These integrated molecular profiles also allowed further characterization of complex pathways, particularly the mitochondrial unfolded protein response (UPR(mt)). UPR(mt) shows strikingly variant responses at the transcript and protein level that are remarkably conserved among C. elegans, mice, and humans. Overall, these examples demonstrate the value of an integrated multilayered omics approach to characterize complex metabolic phenotypes.


Figures

Figure 1
Figure 1. SRM-Based Protein Quantification and Covariation Network
(A) SRM assay development for targeted proteomic measurements; 309 peptides corresponding to 192 genes were designed and synthesized via SPOT synthesis. Fragment ion spectra were generated on a triple-quadrupole MS with the SRM-triggered MS2 mode, and then ions were selected based on their relative intensities. Dot colors indicate different amino acids. The following abbreviation was used: m/z, mass-to-charge ratio. Mouse liver homogenate combined with the heavy reference proteome was analyzed with SRM on a triple-quadrupole MS. Different dot colors represent different peptides (Quadrupole 1) or product ions (Quadrupole 3). (B) Biological replicates had near-perfect reproducibility (r2 ~ 0.98), shown here for all three biological replicates of the BXD60 CD cohort. (C) Two-way cluster analysis of protein (top) and transcript (bottom) abundances in all 77 cohorts (40 CD, 37 HFD). Columns are clustered based on samples, and rows are clustered based on gene-product abundances. Protein and transcript abundances are colored in a red-blue scale. Red, high abundance; blue, low abundance; white, missing data. (D) Protein association network based on robust Spearman correlation measures for all protein pairs. Statistically significant and strong positive associations (p < 0.01 and r > 0.6) are edges. The largest correlation clusters are labeled “a,” “b,” and “c.” Nodes are labeled with protein names and colored according to their biological process, as reported by DAVID (Huang et al., 2009).
Figure 2
Figure 2. mRNA and Protein Overview
(A) Circos plot of mRNA and protein data for all 192 genes, labeled on outer edge. Genes are represented by two bars: light for CD and dark for HFD. Genes are arranged by relative chromosome position; the chromosome length is according to number of genes measured. Blue bars indicate the transcript relative expression CD versus HFD; orange bars indicate the protein relative expression CD versus HFD. Bars with more unequal heights indicate diet has a larger impact. Green bars indicate the correlation between the transcript and protein for each gene within each diet. Fuchsia bars represent the strength of the peak eQTL. Yellow bars represent the strength of the peak pQTL. The two bars are overlaid with transparency. The dashed green line represents the simplified significance cutoff (LRS ≥ 18). The inner ring indicates the chromosome location. The blue central lines represent significant eQTLs, and the red central lines represent significant pQTLs. The central solid lines represent cis-QTLs, and the central dashed lines represent trans-QTLs. QTL lines stem from the LRS bar graph and terminate on the inner side of the chromosome ring at the approximate QTL location. (B) Magnified view of eQTLs and pQTLs mapping to chromosome 5. (C) In CD ~25% (left), and in HFD ~30% (right), of transcripts correlate nominally significantly with their protein. The lower strip charts show correlation distribution. Spearman correlation values corresponding to nominal significance (p < 0.05) and corrected significance (p < 0.0002) are displayed on the axis. (D) Venn diagram of genes that are differentially regulated between CD and HFD as transcripts (blue), proteins (red), both (purple), or neither (gray). (E) Volcano plot for mRNA showing the magnitude of dietary effect versus significance. ~45% vary with nominal significance (p < 0.05) between the dietary conditions. Approximately 19% vary with corrected significance (raw p < 0.0003). Some extreme genes are labeled. (F) Plot of the effect of diet on transcripts versus the effect of diet on proteins. In general, transcripts and proteins are similarly affected by diet. Related to Tables S1 and S2.
Figure 3
Figure 3. QTL Overview
(A) Venn diagram separating all genes with distinct QTLs based on provenance. (B) Venn diagrams separating eQTLs or pQTLs by dietary source and regulatory mechanism. Overlapping regions indicates genes giving an eQTL or pQTL in both diets; white numbers are counted twice for QTL count, but once for distinct gene count (e.g., there are 48 significant cis-eQTLs, which stem from 28 distinct genes). (C) In both diets, DHTKD1 and Dhtkd1 share a common cis-QTL, are unaffected by diet, and strongly correlate. (D) NNT and Nnt display a similar pattern. (E) Car3 has only one significant pQTL despite an absence of dietary effect and a strong transcript-protein correlation. (F) PMPCB does not map to a significant pQTL; however, Pmpcb maps to a significant cis-eQTL in both diets, despite a strong transcriptional upregulation by HFD. The transcript and protein levels do not correlate. (G) Mup3 and MUP3 do not map to significant QTLs, despite having high levels of variation and a strong transcript-protein correlation. Related to Figure S1.
Figure 4
Figure 4. Metabolic Consequences of BCKDHB and DHTKD1
(A) BCKDHB is the E1b subunit of the BCKD complex, which irreversibly converts several BCKAs. (B) Bckdhb mRNA has the strongest eQTLs of the 192 target genes examined in the liver and has among the strongest pQTLs. Neither transcript nor protein is affected by diet. (C) The BCAA/alanine ratio is significantly increased in animals with the dysfunctional C57BL/6 allele in CD serum and liver measurements and HFD liver measurements, in line with it acting as a risk for MSUD. Red line represents median of strains with the C57BL/6 allele, and purple lines represent the median of strains with the DBA/2 allele. (D) DHTKD1 is the E1 subunit of the dehydrogenase complex that catalyzes the irreversible conversion of 2-oxoadipate to glutaryl-CoA. (E) Left: serum 2-AA levels are strongly related to DHTKD1, as are liver levels (not shown). Right: other upstream metabolites in the DHTKD1 pathway correlate strongly with one another, e.g., 2-AA and 2-AA semialdehyde, shown here in liver. (F) Serum 2-AA maps as an mQTL in both diets to proximal chromosome 2, the location of DHTKD1.
Figure 5
Figure 5. Physiological Consequences of DHTKD1 Variants
(A) Liver size, serum cholesterol, and fasted glucose levels increase after HFD across the BXDs. Error bars represent mean + SEM. (B) In CD livers, 2-AA is associated negatively with liver mass, serum cholesterol, insulin, and glucose. In HFD livers, 2-AA is associated negatively with liver mass and fasting glucose. (C) Liver levels of saccharopine, a metabolite upstream of 2-AA, are also associated negatively with the same phenotypes, although only in CD. (D) 2-AA levels in the liver are significantly decreased in HFD-fed BXD cohorts. (E) However, when correcting for diabetes status (HOMA-IR > 10 as diabetic, or HOMA-IR < 5 as healthy), there was no difference between CD and HFD—instead, only between diabetic and nondiabetic cohorts. (F) Using publicly available data from a recent metabolomic profiling of livers from the HMDP (Ghazalpour et al., 2014), we can observe that the inverse relationship between 2-AA and fasted glucose is highly consistent in mouse populations. p = 0.01 if the four high nonoutliers in the low group are suppressed. (G) Also in a human population study with urine metabolomics, diabetic patients had markedly lower levels of 2-AA. Related to Figure S2.
Figure 6
Figure 6. The Mitochondrial Unfolded Protein Response
(A) UPRmt induction in C. elegans triggered by interference with ETC (RNAi of cco-1) or mitochondrial proteostasis (RNAi for spg-7). These triggers result in upregulation of UPRmt effectors hsp-6, clpp-1, and lonp-1 and a reduction in ubl-5. The orthologous mouse genes are indicated below the respective C. elegans gene symbol. Error bars represent mean + SEM. (B) UPRmt induction in C. elegans decreases movement, size, and oxygen consumption. (C) UPRmt genes and proteins form a network of coordinately expressed mRNAs and proteins in vivo in mice, which is stronger at the protein than at the mRNA level. (D) Cox5b and Spg7 (orthologs of C. elegans cco-1 and spg-7) are generally negatively associated with the levels of all UPRmt genes in CD cohorts, particularly at the protein level, in line with observations in the worm. (E) While the levels of Cox5b and Spg7 are not affected by diet, expression is consistent by strain across the two diets only for Cox5b. (F) The UPRmt network in HFD livers is similar to that observed in CD, but somewhat weaker. Ubl5 remains a striking negative correlate at the mRNA level. (G) In HFD, Cox5b remains a negative correlate of UPRmt transcripts and proteins, while Spg7 does not. (H) The features of the UPRmt network are also conserved in 427 human liver biopsies (Schadt et al., 2008), 405 lung biopsies (Ding et al., 2004), 180 lymphoblast lines (Monks et al., 2004), and 43 hippocampi (Berchtold et al., 2008). (I) In humans, SPG7 is a consistent negative correlate of the UPRmt transcripts.

References

    1. Albert FW, Treusch S, Shockley AH, Bloom JS, Kruglyak L. Genetics of single-cell protein abundance variation in large yeast populations. Nature. 2014;506:494–497. - PMC - PubMed
    1. Andreux PA, Williams EG, Koutnikova H, Houtkooper RH, Champy MF, Henry H, Schoonjans K, Williams RW, Auwerx J. Systems genetics of metabolism: the use of the BXD murine reference panel for multiscalar integration of traits. Cell. 2012;150:1287–1299. - PMC - PubMed
    1. Benedetti C, Haynes CM, Yang Y, Harding HP, Ron D. Ubiquitin-like protein 5 positively regulates chaperone gene expression in the mitochondrial unfolded protein response. Genetics. 2006;174:229–239. - PMC - PubMed
    1. Berchtold NC, Cribbs DH, Coleman PD, Rogers J, Head E, Kim R, Beach T, Miller C, Troncoso J, Trojanowski JQ, et al. Gene expression changes in the course of normal brain aging are sexually dimorphic. Proc. Natl. Acad. Sci. USA. 2008;105:15605–15610. - PMC - PubMed
    1. Callister SJ, Barry RC, Adkins JN, Johnson ET, Qian WJ, Webb-Robertson BJ, Smith RD, Lipton MS. Normalization approaches for removing systematic biases associated with mass spectrometry and label-free proteomics. J. Proteome Res. 2006;5:277–286. - PMC - PubMed

Publication types