. 2014 Sep 11;158(6):1431-1443.
doi: 10.1016/j.cell.2014.08.009.

Determination and inference of eukaryotic transcription factor sequence specificity

Affiliations

Determination and inference of eukaryotic transcription factor sequence specificity

Matthew T Weirauch et al. Cell. .

Abstract

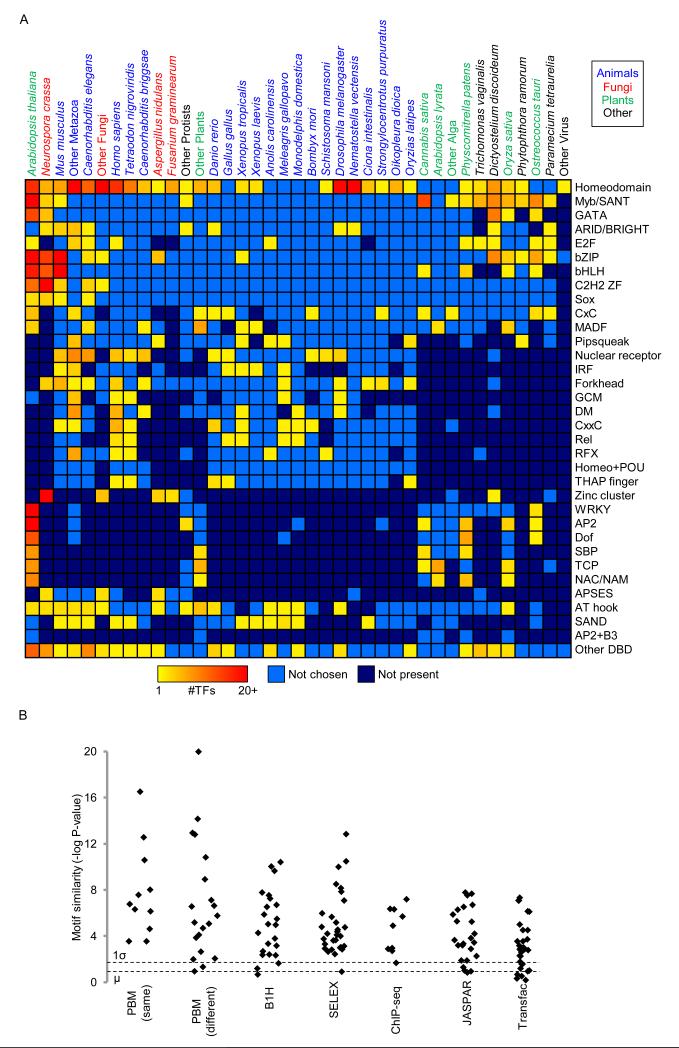
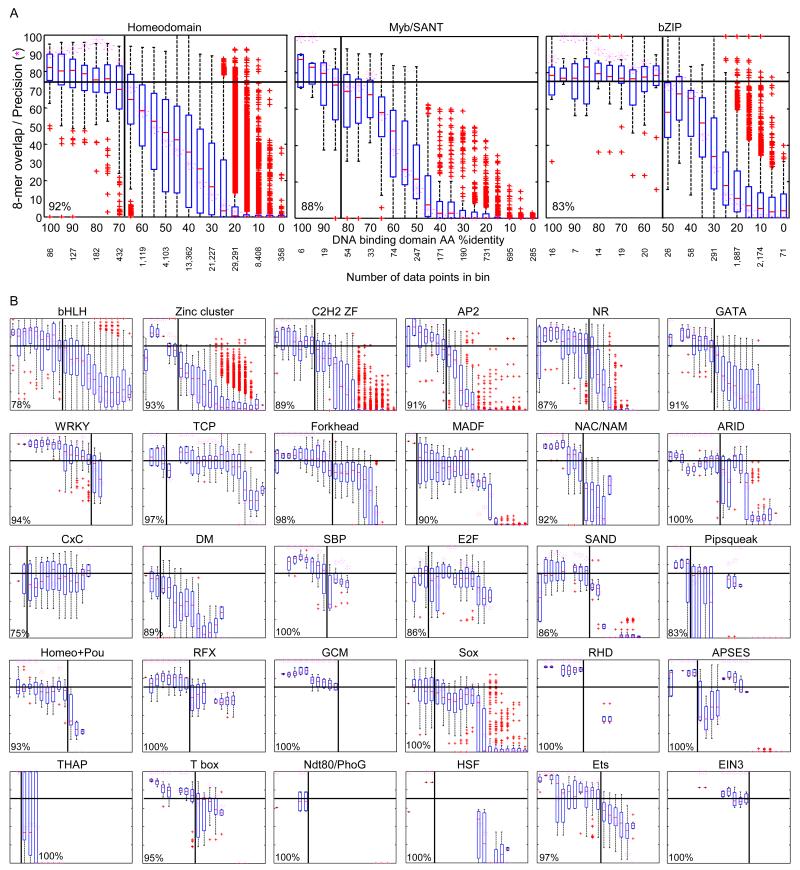
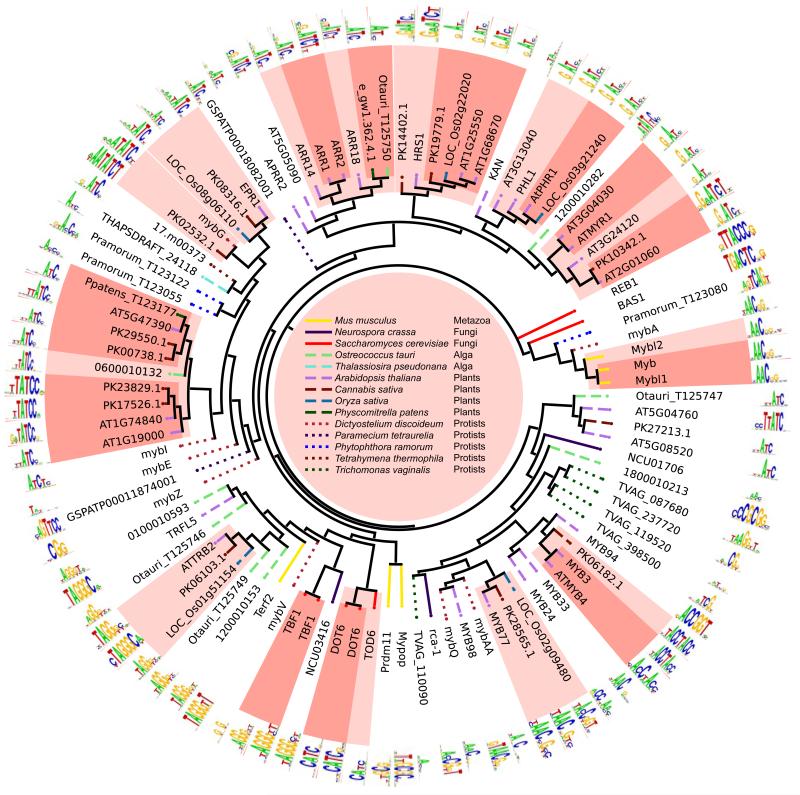
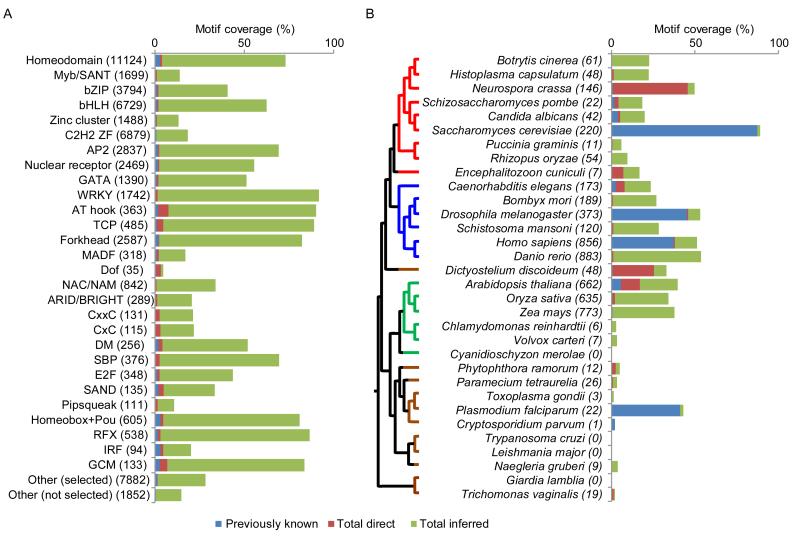
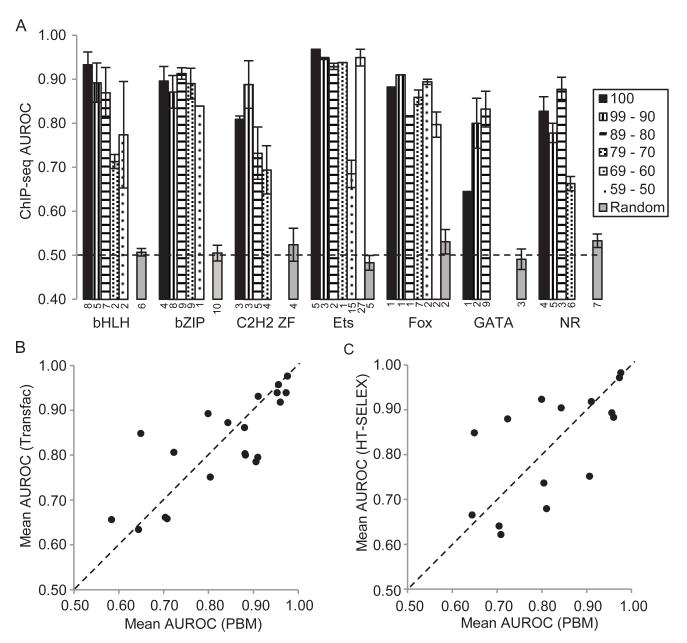
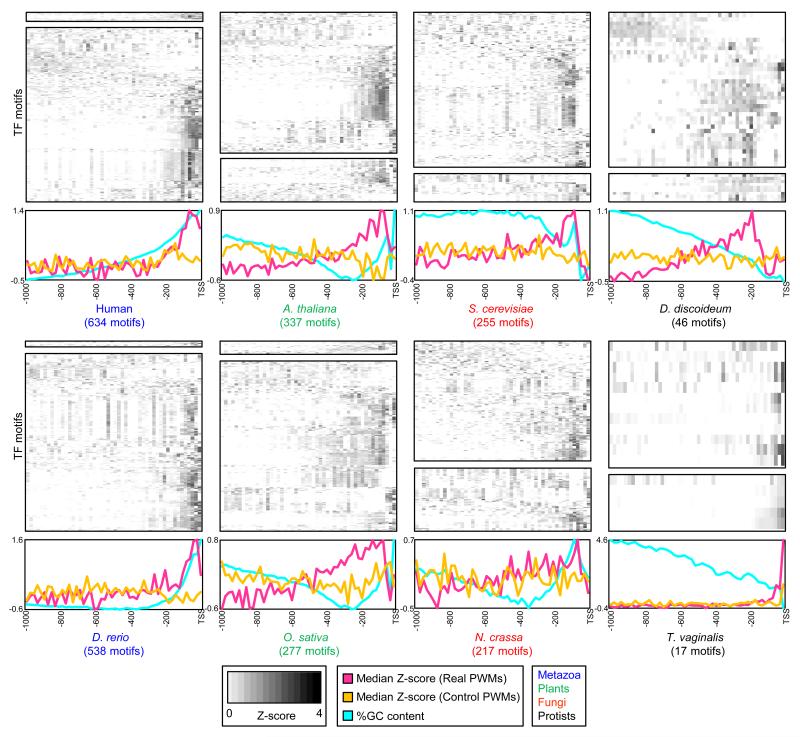
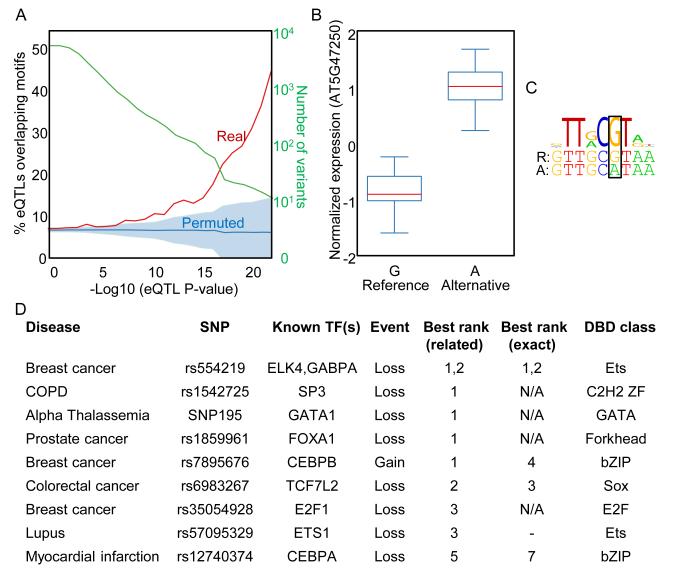
Transcription factor (TF) DNA sequence preferences direct their regulatory activity, but are currently known for only ∼1% of eukaryotic TFs. Broadly sampling DNA-binding domain (DBD) types from multiple eukaryotic clades, we determined DNA sequence preferences for >1,000 TFs encompassing 54 different DBD classes from 131 diverse eukaryotes. We find that closely related DBDs almost always have very similar DNA sequence preferences, enabling inference of motifs for ∼34% of the ∼170,000 known or predicted eukaryotic TFs. Sequences matching both measured and inferred motifs are enriched in chromatin immunoprecipitation sequencing (ChIP-seq) peaks and upstream of transcription start sites in diverse eukaryotic lineages. SNPs defining expression quantitative trait loci in Arabidopsis promoters are also enriched for predicted TF binding sites. Importantly, our motif "library" can be used to identify specific TFs whose binding may be altered by human disease risk alleles. These data present a powerful resource for mapping transcriptional networks across eukaryotes.


Figures

Figure 1
Figure 1. Overview of the motif dataset
(A) TFs characterized in this study, by species and DBD class. TFs with multiple DBD classes are indicated with a “+” (e.g., AP2+B3). DBD classes and species containing fewer than five members are grouped into “Other”. Species are ordered by the total number of TFs with characterized motifs. (B) PBM-derived motifs are similar to previously characterized motifs. We compared new PBM-derived motifs to previously determined motifs for the same TF. P-values were calculated using the TomTom PWM similarity tool (Tanaka et al., 2011), with Euclidean distance and default parameter settings. Dashed lines indicate mean (bottom), and mean plus one standard deviation (top) of P-values obtained from 10,000 randomly selected PWM pairs. ‘PBM (same)’ and ‘PBM (dif)’ indicate PBMs from other studies performed using the same, or different array designs as this study, respectively. See also Figure S1 and Tables S1, S2, and S6.
Figure 2
Figure 2. Motif inference thresholds by DBD class
(A) Relationship between similarity in DBD AA sequence and DNA sequence preferences. Boxplots depict the relationship between the %ID of aligned AAs and % of shared 8-mer DNA sequences with E-scores exceeding 0.45, for the three DBD classes with the most PBMs in this study. %ID bins range from 0 to 100, of size 10, in increments of five. Below, number of DBD pairs in each bin. Pink asterisks indicate the precision of the corresponding bin (i.e., the fraction of protein pairs with 8-mer similarity at least as high as the 25th percentile of replicates). Horizontal line indicates the 75% precision line used to choose the inference threshold. Vertical lines indicate AA %ID threshold (i.e., the point before the pink asterisks drop below the horizontal line). Percentage in lower left corner indicates cross validation success rate. (B) Relationship for all DBD classes. Boxplots for all DBD classes for which we could establish an inference threshold, depicted as in (A). DBD classes are ordered by the number of TFs characterized in this study. See also Figures S2 and S6.
Figure 3
Figure 3. Overview of Myb/SANT family motifs
PBM-derived motifs from the Myb/SANT family (84 from this study, 13 from other studies) are shown. Tree reflects the percent of identical AAs after alignment. Dark shading, 87.5% AA identity (standard inference threshold); light shading, > 70% AA identity (relaxed inference threshold). TBF1 and DOT6 each have two motifs because they were examined in two different studies.
Figure 4
Figure 4. TF motif coverage
TFs with multiple protein isoforms are counted as a single gene. (A) Motif coverage by DBD class. DBD classes sorted top to bottom by number of TFs characterized in this study. Those with fewer than eight proteins characterized in this study are grouped into “Other”. “Other (selected)” indicates DBD classes selected for characterization in this study. “Other (not selected)” indicates DBD classes not characterized here. “Direct” includes those experimentally characterized in this study, but not previously known. “Total inferred” excludes those experimentally characterized in this or previous studies. (B) Motif coverage by species. Tree at left, phylogenetic relationships between organisms (Baldauf et al., 2000). See also Table S3.
Figure 5
Figure 5. PBM-derived motifs identify in vivo TF binding locations
(A) AUROC analysis, showing ability of directly determined and inferred motifs to distinguish ChIP-seq peak sequences from scrambled sequences. We identified TFs with available ENCODE ChIP-seq data that also have PBM data available either for that TF, or for related TFs (based on the inference threshold for the DBD class). We then gauged the ability of the PBM-derived motifs to distinguish real ChIP peaks from scrambled sequences (maintaining all dinucleotide frequencies) using the AUROC (see Experimental Procedures). For each DBD class, results are binned by DBD %AA ID (key indicated at upper right). Numbers below each bar indicate the count in each bin. Error bars indicate standard error. ‘Random’ indicates results obtained with a randomly assigned, unrelated TF motif. Abbreviation: Fox, Forkhead box. Figure S7 shows results obtained using an alternative null model. (B) Comparison of AUROC for PBM-derived motifs and literature-derived motifs. We identified TFs with ENCODE ChIP-seq experimental data that also have both Transfac and PBM-derived motifs available. For each TF, we calculated the best AUROC obtained by any PBM or any Transfac motif on any of the ENCODE cell line ChIP experiments for that TF. For TFs with multiple motifs from the same source, the plot shows the mean AUROC across the motifs. (C) PBM-derived motifs vs. HT-SELEX-derived motifs. Same as for (B), but including only TFs with motifs available both from PBMs and a recent HT-SELEX study (Jolma et al., 2013). See also Table S4.
Figure 6
Figure 6. Positional bias of motif matches in eukaryotic promoters
PBM-derived PWMs (direct, top; inferred, bottom) scored in 20-bp bins, normalized to dinucleotide-permuted controls, averaged across all promoters, and displayed as Z-scores (see Experimental Procedures). Each row in the heatmap corresponds to one PWM. Rows were clustered using hierarchical clustering (Pearson correlation, average linkage). Summary plots at the bottom indicate the median Z-score, taken across all PWMs from the indicated species (‘Real PWMs’), or across a set of PWMs from unrelated lineages (‘Control PWMs’) (see Experimental Procedures). See also Table S5 and Figures S3 and S4.
Figure 7
Figure 7. Overlap of predicted TF binding sites with cis-eQTLs
(A) Number and percentage of Arabidopsis cis-eQTLs overlapping motifs, as a function of eQTL significance. Shaded region indicates one standard deviation in the expected distribution (see Experimental Procedures). (B) A cis-eQTL affecting the expression of the AT5G47250 gene. Boxplots indicate the median normalized gene expression level for each allele of the cis-eQTL. ‘Reference’ indicates the allele present in the Arabidopsis reference genome assembly. (C) The same cis-eQTL “breaks” a putative binding site for the VNI2 transcriptional repressor. Sequence logo depicts the DNA-binding motif we obtained for VNI2. Sequences below indicate the reference (top) and alternative (bottom) alleles of the cis-eQTL SNP (boxed), and its flanking bases. (D) Prediction of human TF binding events altered by disease risk alleles. We created a method for using PBM data to predict TFs whose binding is affected by disease associated genetic variants, and applied it to 16 known examples. Shown here are the ten cases in which we ranked the correct TF (column labeled ‘exact’) or a highly related TF from the same DBD class (column labeled ‘related’) within the top five TFs. The ‘Event’ column indicates whether the risk allele results in a ‘Loss’ or ‘Gain’ of binding of the TF. ‘N/A’ indicates that PBM data is not available for the corresponding TF. ‘-’ indicates that the TF did not receive a rank because both alleles had E-score > 0.45. See also Figure S5.

Similar articles

Cited by

References

    1. Aggarwal P, Das Gupta M, Joseph AP, Chatterjee N, Srinivasan N, Nath U. Identification of specific DNA binding residues in the TCP family of transcription factors in Arabidopsis. The Plant cell. 2010;22:1174–1189. - PMC - PubMed
    1. Alleyne TM, Pena-Castillo L, Badis G, Talukder S, Berger MF, Gehrke AR, Philippakis AA, Bulyk ML, Morris QD, Hughes TR. Predicting the binding preference of transcription factors to individual DNA k-mers. Bioinformatics. 2009;25:1012–1018. - PMC - PubMed
    1. Atwell S, Huang YS, Vilhjalmsson BJ, Willems G, Horton M, Li Y, Meng D, Platt A, Tarone AM, Hu TT, et al. Genome-wide association study of 107 phenotypes in Arabidopsis thaliana inbred lines. Nature. 2010;465:627–631. - PMC - PubMed
    1. Badis G, Berger MF, Philippakis AA, Talukder S, Gehrke AR, Jaeger SA, Chan ET, Metzler G, Vedenko A, Chen X, et al. Diversity and complexity in DNA recognition by transcription factors. Science. 2009;324:1720–1723. - PMC - PubMed
    1. Baldauf SL, Roger AJ, Wenk-Siefert I, Doolittle WF. A kingdom-level phylogeny of eukaryotes based on combined protein data. Science. 2000;290:972–977. - PubMed

Publication types

Substances

Associated data