

Distinct patterns of IgG and IgA against food and microbial antigens in serum and feces of patients with inflammatory bowel diseases
- PMID: 25215528
- PMCID: PMC4162554
- DOI: 10.1371/journal.pone.0106750
Distinct patterns of IgG and IgA against food and microbial antigens in serum and feces of patients with inflammatory bowel diseases
Abstract
Background: Inflammatory bowel disease (IBD) is associated with a defective intestinal barrier and enhanced adaptive immune responses against commensal microbiota. Immune responses against food antigens in IBD patients remain poorly defined.
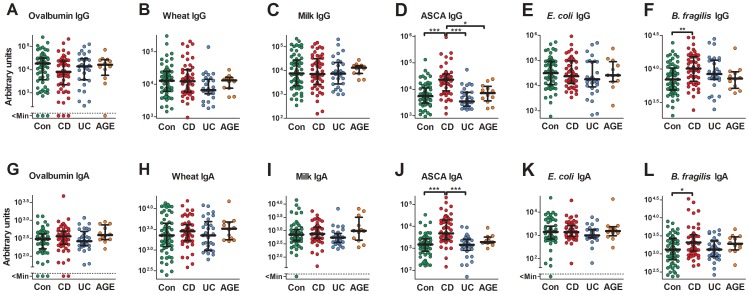
Methods: IgG and IgA specific for food and microfloral antigens (wheat and milk extracts; purified ovalbumin; Escherichia coli and Bacteroides fragilis lysates; mannan from Saccharomyces cerevisiae) were analyzed by ELISA in the serum and feces of patients with Crohn's disease (CD; n = 52 for serum and n = 20 for feces), ulcerative colitis (UC; n = 29; n = 17), acute gastroenteritis/colitis (AGE; n = 12; n = 9) as well as non-inflammatory controls (n = 61; n = 39).
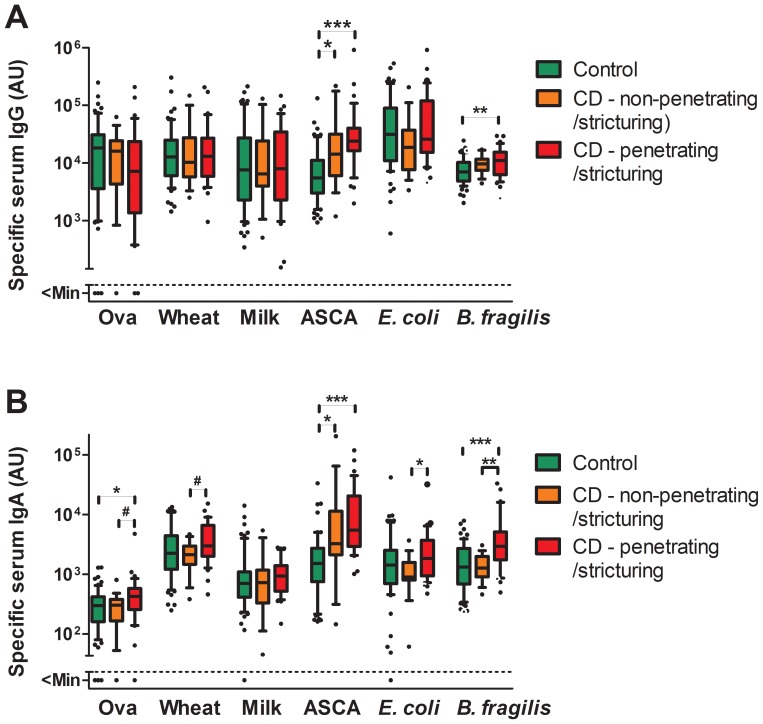
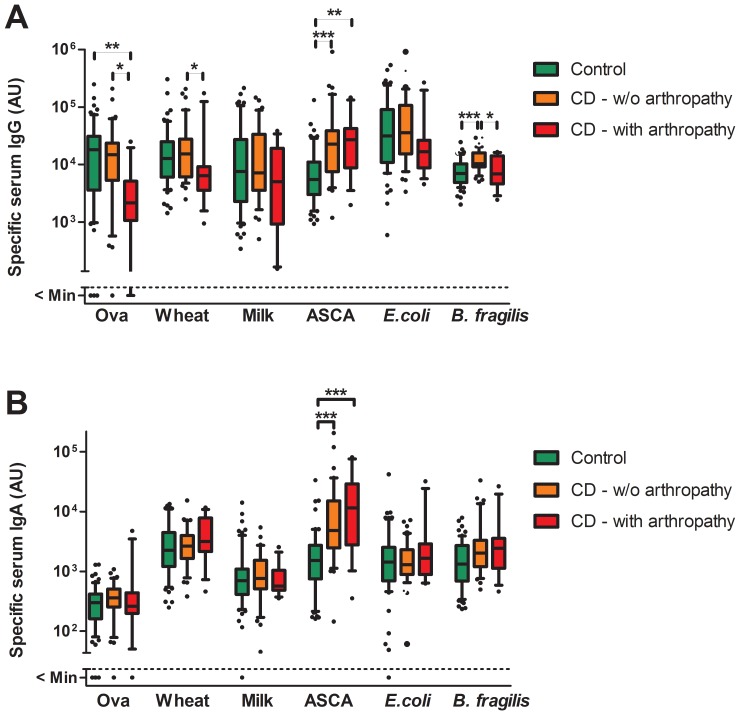
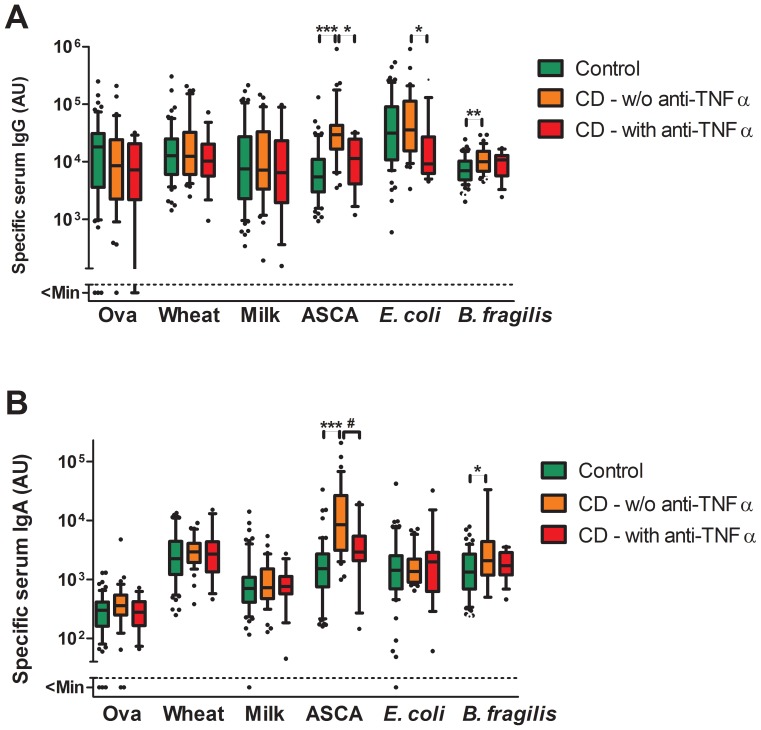
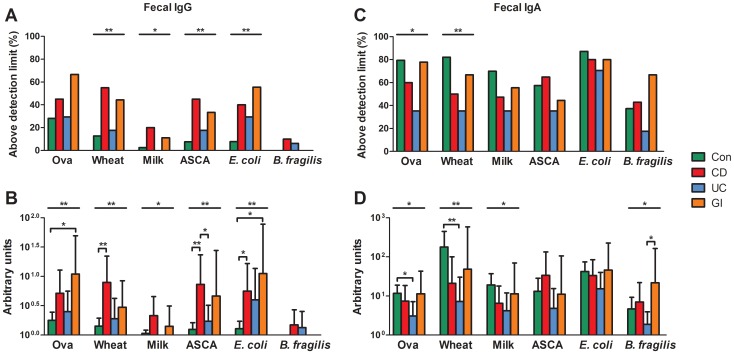
Results: Serum anti-Saccharomyces cerevisiae antibodies (ASCA) and anti-B. fragilis IgG and IgA levels were increased in CD patients whereas antibody (Ab) levels against E. coli and food antigens were not significantly different within the patient groups and controls. Subgroup analysis revealed that CD patients with severe diseases defined by stricturing and penetrating lesions have slightly higher anti-food and anti-microbial IgA levels whereas CD and UC patients with arthropathy have decreased anti-food IgG levels. Treatment with anti-TNF-α Abs in CD patients was associated with significantly decreased ASCA IgG and IgA and anti-E. coli IgG. In the feces specific IgG levels against all antigens were higher in CD and AGE patients while specific IgA levels were higher in non-IBD patients. Anti-food IgG and IgA levels did not correlate with food intolerance.
Summary: In contrast to anti-microbial Abs, we found only minor changes in serum anti-food Ab levels in specific subgroups of IBD patients. Fecal Ab levels towards microbial and food antigens show distinct patterns in controls, CD and UC patients.
Conflict of interest statement
Figures
Similar articles
-
Anti-food and anti-microbial IgG subclass antibodies in inflammatory bowel disease.Scand J Gastroenterol. 2016 Dec;51(12):1453-1461. doi: 10.1080/00365521.2016.1205130. Epub 2016 Jul 25. Scand J Gastroenterol. 2016. PMID: 27455092
-
Clinical significance of soluble immunoglobulins A and G and their coated bacteria in feces of patients with inflammatory bowel disease.J Transl Med. 2018 Dec 17;16(1):359. doi: 10.1186/s12967-018-1723-0. J Transl Med. 2018. PMID: 30558634 Free PMC article.
-
Reappraisal of antibodies against Saccharomyces cerevisiae (ASCA) as persistent biomarkers in quiescent Crohn's disease.Autoimmunity. 2019 Feb;52(1):37-47. doi: 10.1080/08916934.2019.1588889. Epub 2019 Mar 19. Autoimmunity. 2019. PMID: 30884988 Clinical Trial.
-
ASCA, ANCA, ALCA and Many More: Are They Useful in the Diagnosis of Inflammatory Bowel Disease?Dig Dis. 2016;34(1-2):90-7. doi: 10.1159/000442934. Epub 2016 Mar 16. Dig Dis. 2016. PMID: 26982193 Review.
-
Antibody signatures in inflammatory bowel disease: current developments and future applications.Trends Mol Med. 2022 Aug;28(8):693-705. doi: 10.1016/j.molmed.2022.05.004. Epub 2022 May 31. Trends Mol Med. 2022. PMID: 35654641 Review.
Cited by
-
Preclinical stage abundance and nuclear antigen reactivity of faecal Immunoglobulin A vary among males and females of lupus-prone mouse models.Immunology. 2022 Apr;165(4):497-507. doi: 10.1111/imm.13459. Epub 2022 Mar 1. Immunology. 2022. PMID: 35138645 Free PMC article.
-
Prevalence of Anti-Anisakis simplex Antibodies in a Cohort of Patients with Inflammatory Bowel Disease in Norway.Pathogens. 2025 Aug 4;14(8):769. doi: 10.3390/pathogens14080769. Pathogens. 2025. PMID: 40872279 Free PMC article.
-
Fcα Receptor-1-Activated Monocytes Promote B Lymphocyte Migration and IgA Isotype Switching.Int J Mol Sci. 2022 Sep 22;23(19):11132. doi: 10.3390/ijms231911132. Int J Mol Sci. 2022. PMID: 36232432 Free PMC article.
-
Food allergy: begin at the skin, end at the mast cell?Nat Rev Immunol. 2025 Jun 26. doi: 10.1038/s41577-025-01185-y. Online ahead of print. Nat Rev Immunol. 2025. PMID: 40571771 Review.
-
Salivary IgA and IgG Antibody Responses against Periodontitis-Associated Bacteria in Crohn's Disease.Int J Mol Sci. 2023 Jan 25;24(3):2385. doi: 10.3390/ijms24032385. Int J Mol Sci. 2023. PMID: 36768711 Free PMC article.
References
-
- Ruel J, Ruane D, Mehandru S, Gower-Rousseau C, Colombel JF (2014) IBD across the age spectrum-is it the same disease? Nat Rev Gastroenterol Hepatol 11: 88–98. - PubMed
Publication types
MeSH terms
Substances
LinkOut - more resources
Full Text Sources
Other Literature Sources
Medical
Molecular Biology Databases
Miscellaneous
