. 2014 Sep 12;9(9):e106779.
doi: 10.1371/journal.pone.0106779. eCollection 2014.

Profiling the mitochondrial proteome of Leber's Hereditary Optic Neuropathy (LHON) in Thailand: down-regulation of bioenergetics and mitochondrial protein quality control pathways in fibroblasts with the 11778G>A mutation

Affiliations

Profiling the mitochondrial proteome of Leber's Hereditary Optic Neuropathy (LHON) in Thailand: down-regulation of bioenergetics and mitochondrial protein quality control pathways in fibroblasts with the 11778G>A mutation

Aung Win Tun et al. PLoS One. .

Abstract

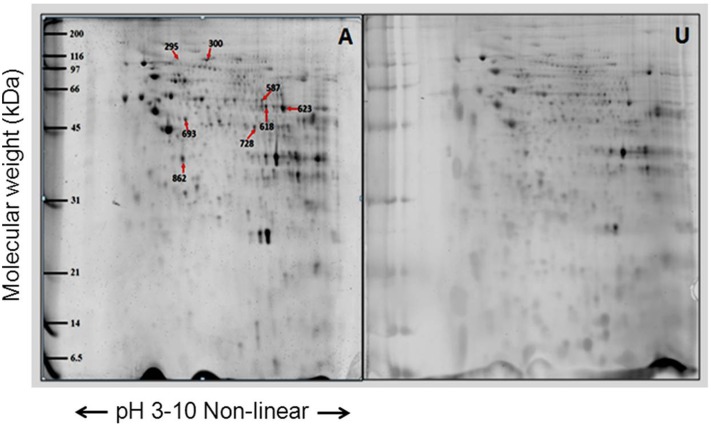
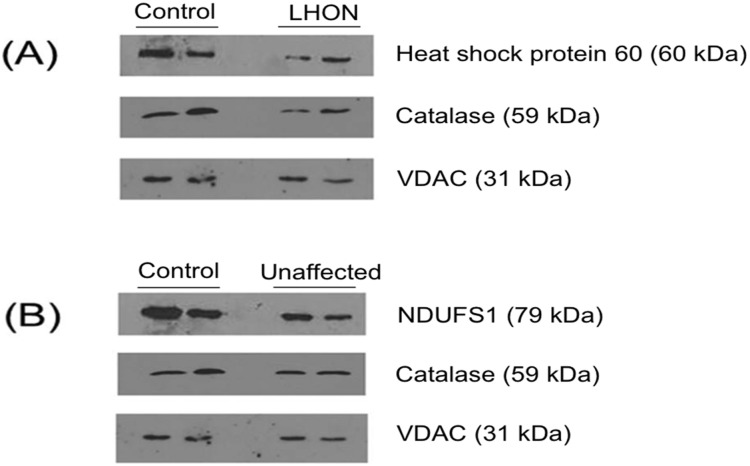
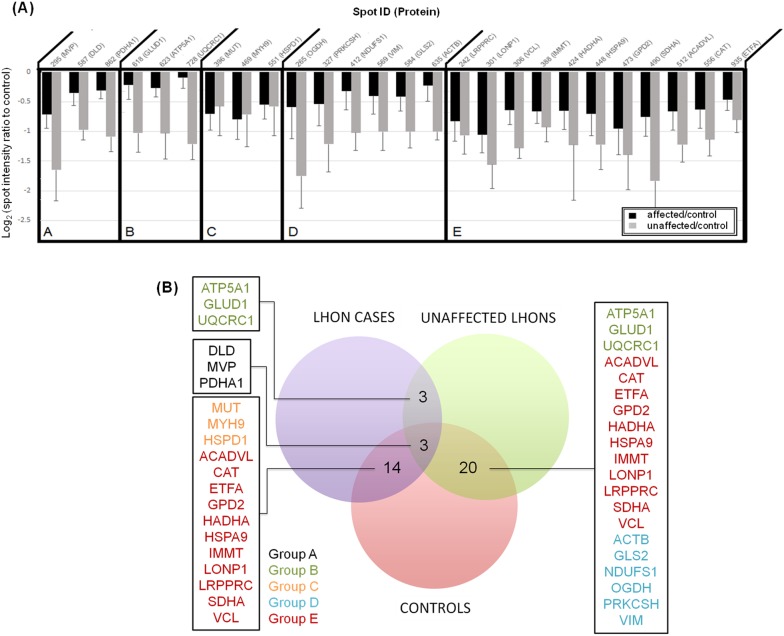
Leber's Hereditary Optic Neuropathy (LHON) is one of the commonest mitochondrial diseases. It causes total blindness, and predominantly affects young males. For the disease to develop, it is necessary for an individual to carry one of the primary mtDNA mutations 11778G>A, 14484T>C or 3460G>A. However these mutations are not sufficient to cause disease, and they do not explain the characteristic features of LHON such as the higher prevalence in males, incomplete penetrance, and relatively later age of onset. In order to explore the roles of nuclear encoded mitochondrial proteins in development of LHON, we applied a proteomic approach to samples from affected and unaffected individuals from 3 pedigrees and from 5 unrelated controls. Two-dimensional electrophoresis followed by MS/MS analysis in the mitochondrial lysate identified 17 proteins which were differentially expressed between LHON cases and unrelated controls, and 24 proteins which were differentially expressed between unaffected relatives and unrelated controls. The proteomic data were successfully validated by western blot analysis of 3 selected proteins. All of the proteins identified in the study were mitochondrial proteins and most of them were down regulated in 11778G>A mutant fibroblasts. These proteins included: subunits of OXPHOS enzyme complexes, proteins involved in intermediary metabolic processes, nucleoid related proteins, chaperones, cristae remodelling proteins and an anti-oxidant enzyme. The protein profiles of both the affected and unaffected 11778G>A carriers shared many features which differed from those of unrelated control group, revealing similar proteomic responses to 11778G>A mutation in both affected and unaffected individuals. Differentially expressed proteins revealed two broad groups: a cluster of bioenergetic pathway proteins and a cluster involved in protein quality control system. Defects in these systems are likely to impede the function of retinal ganglion cells, and may lead to the development of LHON in synergy with the primary mtDNA mutation.


Conflict of interest statement

Competing Interests: The authors have declared that no competing interests exist.

Figures

Figure 1
Figure 1. Assessment of the purity of fibroblasts from a cultured skin biopsy.
Fibroblast surface protein (FSP) was used as a marker in immunofluorescence of the cultured fibroblasts obtained directly obtained from the skin biopsy. The green represents fibroblasts and the nucleus was stained with Hoechst-dye 33342 which shows blue.
Figure 2
Figure 2. Western blot analyses for assessment of mitochondrial enrichment and purity.
20 µg of mitochondrial lysate and whole cell lysate from fibroblasts were separated by 12% SDS-PAGE gel and checked with specific antibodies against various sub-cellular organelles. (W = whole cell lysate; M = mitochondrial enriched fraction) (The same membrane for each cell type was stripped and probed with subsequent antibodies.).
Figure 3
Figure 3. Representative proteome map of differentially expressed proteins from the mitochondrial fractions of fibroblasts from (A) LHON cases (n = 7) and (C) controls (n = 5).
Equal amounts of proteins (100 µg) from each fibroblast sample were resolved by 2-DE. The numbers indicate the spot IDs of proteins whose expression levels differ significantly between the fibroblasts of LHON cases and controls.
Figure 4
Figure 4. Representative proteome map of differentially expressed proteins from mitochondria fraction between fibroblasts from (U) the unaffected LHON individuals (n = 3) and (C) the controls (n = 5).
Equal amounts of proteins (100 µg) from each sample were resolved by 2-DE. The numbers indicate the spot IDs of proteins whose expression levels differ significantly between the fibroblasts of unaffected LHON individuals and controls. Some spots in the same horizontal row showed the same proteins. For example, spot IDs 300 and 301 were identified as LONP1 and IDs 448, 451, 468 as catalase.
Figure 5
Figure 5. Representative proteome map of differentially expressed proteins from the mitochondrial fractions of fibroblasts from (A) LHON cases (n = 7) and (U) unaffected LHON individuals (n = 3).
Equal amounts of proteins (100 µg) from each sample were resolved by 2-DE. The numbers indicate the spot IDs of proteins whose expression levels differ significantly between the LHON cases and their unaffected relatives.
Figure 6
Figure 6. Validation of proteomic data by Western Blot analysis.
These figures show: (A) The differentially expression of heat-shock protein 60 and catalase between LHON cases and controls; and (B) the differential expression of NDUFS1 and catalase between unaffected mutation carriers and controls. VDAC was used as a loading control. The two lanes represent samples from two different individuals for each group of samples.
Figure 7
Figure 7. (A) A plot of log-ratio spot intensities, comparing affected individuals (black bars) and unaffected relatives (grey bars) versus controls.
Log-ratios of protein spot intensities were plotted according to the method of . In the case that one protein was identified in several spots, the only spot intensity that gave the highest significant value was selected for this plot. Negative changes were observed in all discoveries. Group A includes protein spots which were significantly differentially expressed in comparisons of affected and unaffected carriers, affected individuals and controls, and unaffected individuals and controls (Post Hoc Tukey Test; P-value<0.05). Group B includes protein spots which were significantly differentially expressed in comparisons of affected and unaffected carriers, and between unaffected carriers and controls. Changes between affected individuals and controls were not significant. Group C includes protein spots which were significantly differentially expressed only in the comparison between affected individuals and control. Group D includes protein spots which were significantly differentially expressed only in the comparison between unaffected carriers and controls. Group E includes protein spots which were significantly differentially expressed the comparisons between affected individuals and controls, and between unaffected carriers and controls. Here, the differences in expression between affected and unaffected carriers are not significantly different. (B) Venn diagram representation of proteins identified in three comparisons derived from figure 7A .

Similar articles

Cited by

References

    1. Man PY, Griffiths PG, Brown DT, Howell N, Turnbull DM, et al. (2003) The epidemiology of Leber hereditary optic neuropathy in the North East of England. Am J Hum Genet 72: 333–339. - PMC - PubMed
    1. Harding AE, Sweeney MG, Govan GG, Riordan-Eva P (1995) Pedigree analysis in Leber hereditary optic neuropathy families with a pathogenic mtDNA mutation. Am J Hum Genet 57: 77–86. - PMC - PubMed
    1. Carelli V, La Morgia C, Iommarini L, Carroccia R, Mattiazzi M, et al. (2007) Mitochondrial optic neuropathies: how two genomes may kill the same cell type? Biosci Rep 27: 173–184. - PubMed
    1. Yen MY, Wang AG, Wei YH (2006) Leber’s hereditary optic neuropathy: a multifactorial disease. Prog Retin Eye Res 25: 381–396. - PubMed
    1. Chuenkongkaew WL, Lertrit P, Poonyathalang A, Sura T, Ruangvaravate N, et al. (2001) Leber’s hereditary optic neuropathy in Thailand. Jpn J Ophthalmol 45: 665–668. - PubMed

Publication types

MeSH terms

LinkOut - more resources