. 2015 Mar;22(3):419-32.
doi: 10.1038/cdd.2014.139. Epub 2014 Sep 12.

AMBRA1 is able to induce mitophagy via LC3 binding, regardless of PARKIN and p62/SQSTM1

Affiliations

AMBRA1 is able to induce mitophagy via LC3 binding, regardless of PARKIN and p62/SQSTM1

F Strappazzon et al. Cell Death Differ. 2015 Mar.

Erratum in

Abstract

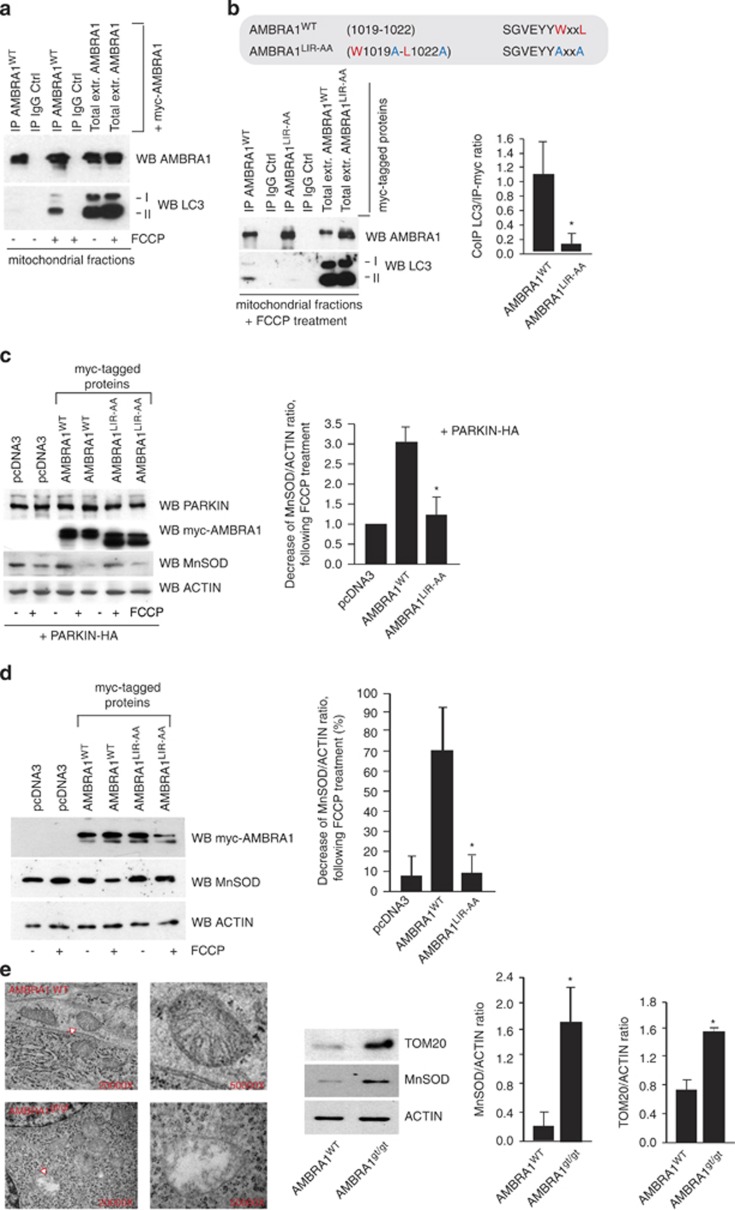
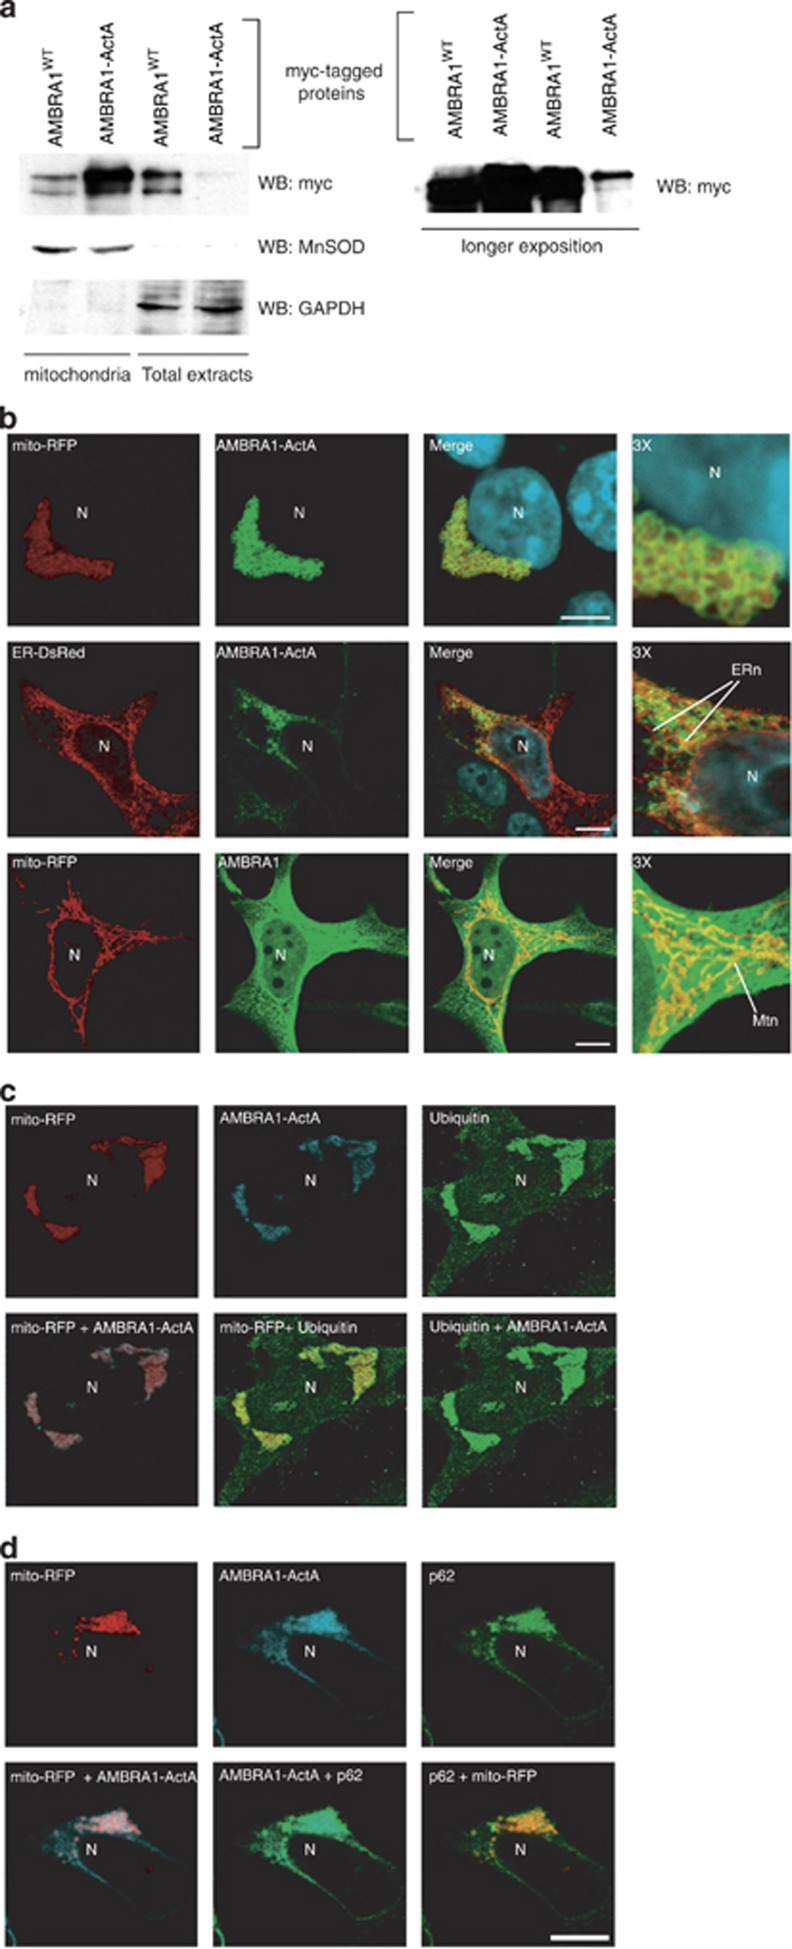
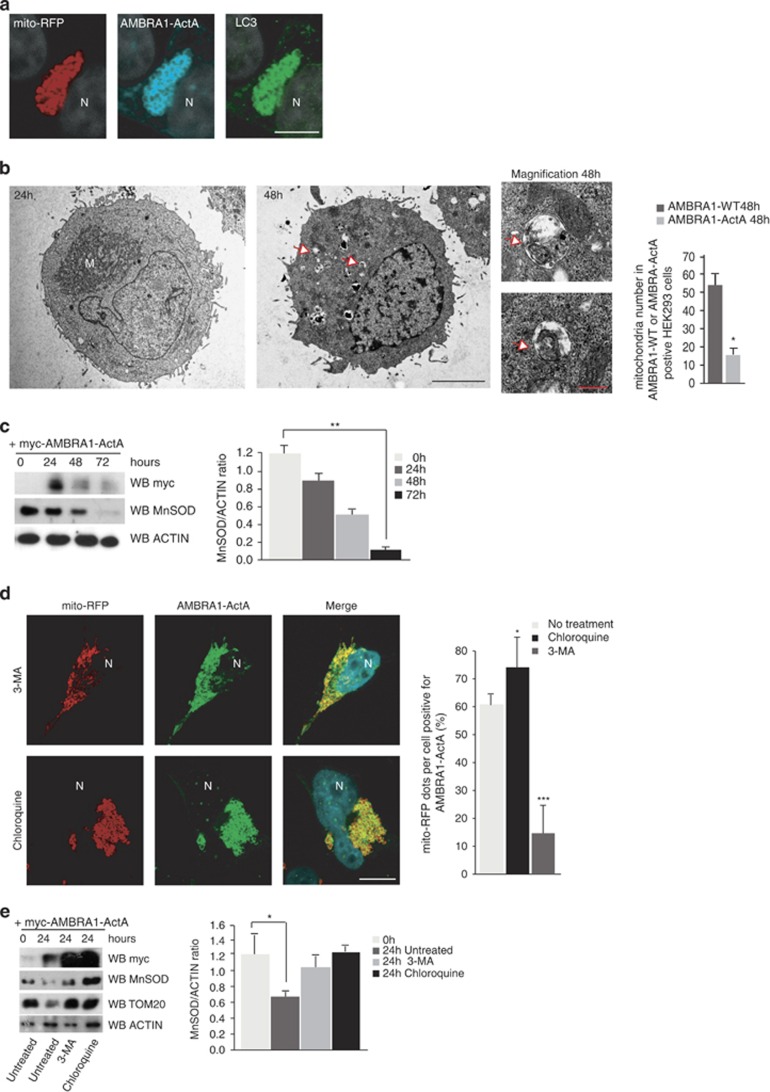
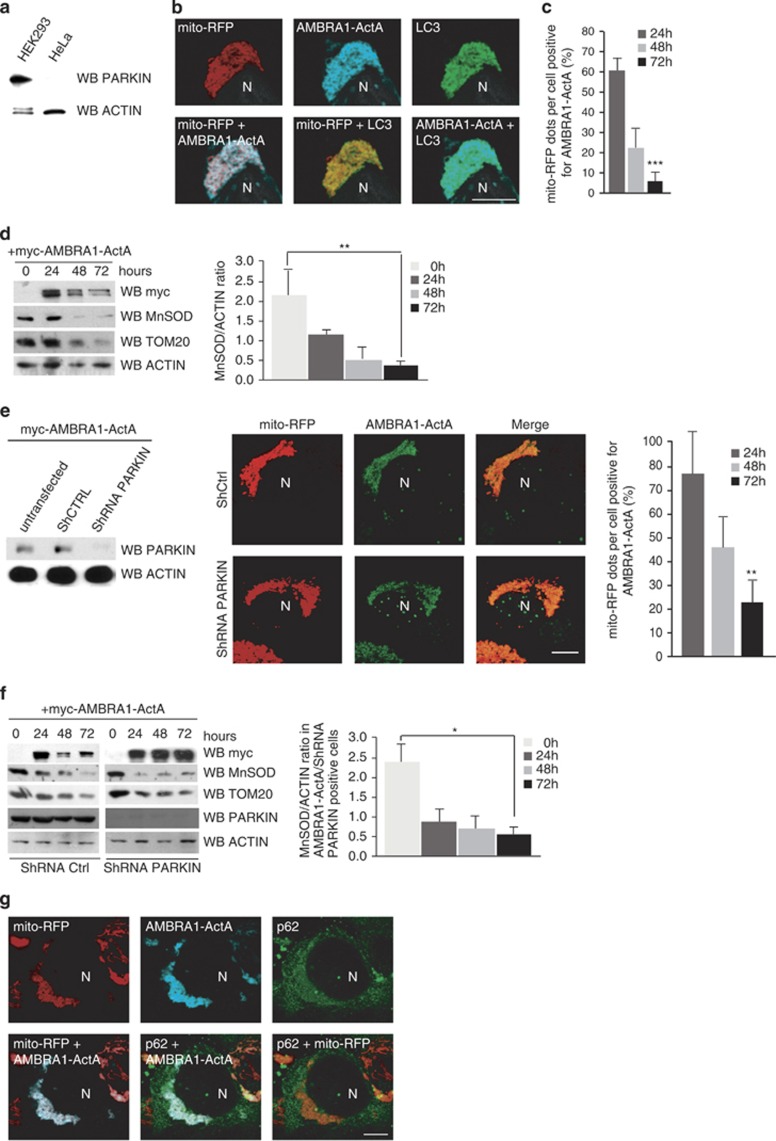
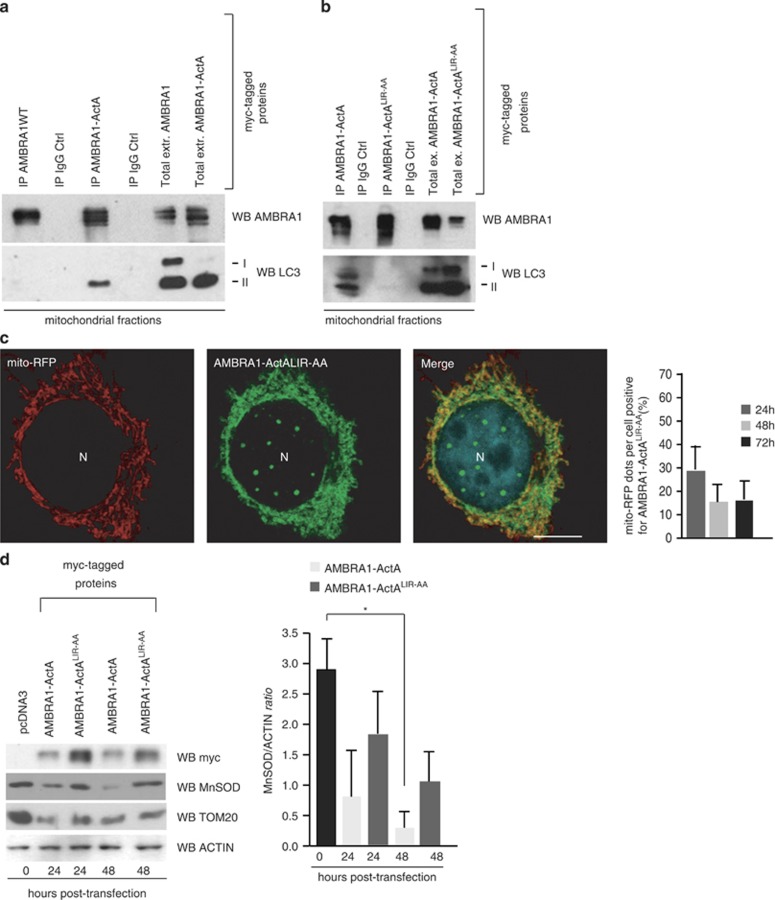
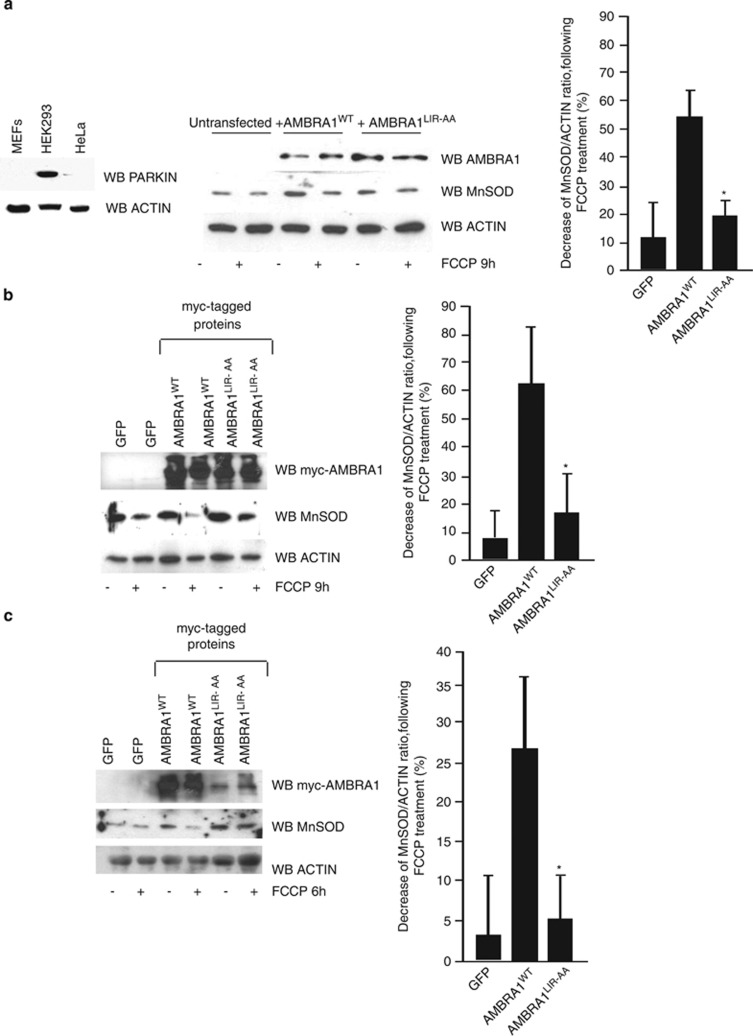
Damaged mitochondria are eliminated by mitophagy, a selective form of autophagy whose dysfunction associates with neurodegenerative diseases. PINK1, PARKIN and p62/SQTMS1 have been shown to regulate mitophagy, leaving hitherto ill-defined the contribution by key players in 'general' autophagy. In basal conditions, a pool of AMBRA1 - an upstream autophagy regulator and a PARKIN interactor - is present at the mitochondria, where its pro-autophagic activity is inhibited by Bcl-2. Here we show that, upon mitophagy induction, AMBRA1 binds the autophagosome adapter LC3 through a LIR (LC3 interacting region) motif, this interaction being crucial for regulating both canonical PARKIN-dependent and -independent mitochondrial clearance. Moreover, forcing AMBRA1 localization to the outer mitochondrial membrane unleashes a massive PARKIN- and p62-independent but LC3-dependent mitophagy. These results highlight a novel role for AMBRA1 as a powerful mitophagy regulator, through both canonical or noncanonical pathways.


Figures

Figure 1
Figure 1
FCCP induces AMBRA1 binding to LC3 through a previously undisclosed LIR motif, enhancing PARKIN-mediated mitophagy. (a) HEK293 cells transfected with a vector encoding myc-AMBRA1WT. At 24 h after transfection, cells were treated with DMSO (ctrl) or with FCCP for 1 h (10 μM). Mitochondrial extracts were immunoprecipitated using an anti-myc antibody or with IgG control. Purified complexes and corresponding total extracts were analysed by western blot (WB) using anti-AMBRA1 and anti-LC3 antibodies. (b) Identification of a LIR motif within the AMBRA1 sequence. Point mutations of both an aromatic residue and the conserved hydrophobic residue are shown (AMBRA1-LIRAA (W1019A-L1022A SGVEYYAxxA)). HEK293 cells were transfected with a vector encoding myc-AMBRA1WTor myc-AMBRA1-LIRAA. At 24 h after transfection, cells were treated with DMSO (ctrl) or FCCP for 1 h (10 μM). Mitochondrial extracts were immunoprecipitated using an anti-myc antibody or with IgG control. Purified complexes and corresponding total extracts were analysed by WB using anti-AMBRA1 and anti-LC3 antibodies. The band density ratio of immunoprecipitated AMBRA1 relative to immunoprecipitated LC3 is analysed in three independent experiments; each point value represents the mean±S.D. from three independent experiments. Statistical analysis was performed using Student's test (*P<0.05) versus AMBRA1. (c) HEK293 cells were transfected with a vector encoding myc-AMBRA1WT or myc-AMBRA1-LIRAA. At 24 h after transfection, cells were treated with DMSO (ctrl) or FCCP for 9 h (1 μM). Protein extracts were analysed using anti-MnSOD and anti-ACTIN (loading control) antibodies. The graph illustrates the MnSOD/ACTIN ratio (±S.D.). Each point value represents the mean±S.D. from three independent experiments. Statistical analysis was performed using Student's test (*P<0.05) versus AMBRA1+PARKIN. (d) ETNA cells were transfected with a vector encoding myc-AMBRA1WTor myc-AMBRA1LIR-AA. At 24 h after transfection, cells were treated with DMSO (ctrl) or FCCP for 5 h (30 μM). Protein extracts were analysed using anti-MnSOD (mitochondria) and anti-ACTIN (loading control) antibodies. The graph illustrates the MnSOD/ACTIN ratio decrease following FCCP treatment (%). Each point value represents the mean±S.D. from three independent experiments. Statistical analysis was performed using Student's test (*P<0.05) versus AMBRA1WT. (e) Ultrastructural analysis of brain from wild-type and Ambra1gt/gt embryos. The arrow (in the Ambra1gt/gt panel) indicates alterations of the cristae and the overall structure of the organelle in damaged mitochondria. Protein extracts from embryo heads (E13.5) were analysed by WB using anti-MnSOD, anti-TOM20 and anti-ACTIN (loading control) antibodies. Magnification is indicated ( × ). Graphs represent MnSOD/ACTIN or TOM20/ACTIN ratio (±S.D.). Each point value represents the mean±S.D. from three independent experiments. Statistical analysis was performed by Student's test (*P<0.05)
Figure 2
Figure 2
AMBRA1–ActA colocalizes with mitochondria and induces the formation of ubiquitin-and p62-positive mito-aggresomes in HEK293 cells. (a) HEK293 cells were transfected with a vector encoding myc-AMBRA1–ActA. At 24 h after transfection, cells were lysed and mitochondrial extracts were analysed by western blot using an anti-myc antibody. The fraction purity was verified by means of antibodies against MnSOD (mitochondria) or GAPDH (cytosol). The longer exposure in the right panel shows the low levels of Ambra1–ActA outside mitochondria. (b) HEK293 cells were co-transfected with vectors encoding myc-AMBRA1–ActA (green) and mito-RFP (red) or ER-DsRed (red). As a control, HEK293 cells were co-transfected with vectors encoding myc-AMBRA1WT and mito-RFP. At 24 h after transfection, cells were fixed and stained with an anti-myc antibody (green). Merge of the fluorescence signals is shown in the right panel, together with a higher magnification image ( × 3). N, nucleus; ERn, ER network; Mtn, mitochondrial network. Scale bar, 6 μm. (c) HEK293 cells were co-transfected with vectors encoding myc-AMBRA1-ActA and mito-RFP (red). Twenty-four hours after transfection, cells were fixed and stained with anti-myc (blue) and anti-Ubiquitin (green) antibodies. Merged images of the two fluorescence signals are shown in the right panels. (d) HEK293 cells were co-transfected with vectors encoding myc-AMBRA1-ActA and mito-RFP (red). Twenty-four hours after transfection, cells were fixed and stained with anti-myc (blue) and anti-p62 (green) antibodies. Merged images of the two fluorescence signals are shown in the right panels. N, nucleus. Scale bar, 6 μm.
Figure 3
Figure 3
AMBRA1–ActA induces mitophagy in HEK293 cells. (a) HEK293 cells were co-transfected with vectors encoding myc-AMBRA1–ActA and mito-RFP (red). At 24 h after transfection, cells were fixed and stained with anti-myc (blue) and anti-LC3 (green) antibodies. Merge of the two fluorescence signals is shown in the right panel. Scale bar, 5 μm. (b) An ultrastructural analysis by EM on whole cells. HEK293 cells were co-transfected with vectors encoding myc-AMBRA1–ActA and GFP mitochondria. At 24 or 48 h after transfection, GFP-positive cells were sorted by using FACS and fixed in glutaraldehyde. Morphological analysis was performed. In the left panel, mitochondria are already redistributed around the nucleus (24 h following transfection). M, mitochondria. The center panel (48 h following transfection) shows a whole cell containing less mitochondria than at 24 h. Arrows indicate fragmented mitochondria into autophagosomes. Scale bar, 5 μm. The upper and lower panels on the right are two magnifications of the autophagosomes observed in the whole cell (see arrows in the middle panel, 48 h). Scale bar, 500 nm. The graph shows quantification of mitochondria number per cells positive for AMBRA1WT and AMBRA1–ActA at 48 h post transfection. Each point value represents the mean±S.D. from three independent experiments. Statistical analysis was performed using Student's test (*P<0.05) (c) HEK293 cells were transfected with a vector encoding myc-AMBRA1–ActA. At 24, 48 and 72 h after transfection, proteins extracts were analysed by western blot using the following antibodies: anti-MnSOD, anti-myc (to control AMBRA1–ActA expression) and anti-ACTIN (loading control). The graph represents the MnSOD/ACTIN ratio (±S.D.). Each point value represents the mean±S.D. from three independent experiments. Statistical analysis was performed using Student's test (*P<0.01; 24 h versus 72 h). (d) 3-MA treatment partially inhibits AMBRA1–ActA/mito-DsRed vacuole formation. HEK293 cells were co-transfected with vectors encoding AMBRA1–ActA and mito-RFP and treated directly with 10 mM 3-MA. After 24 h, cells were fixed and stained with an anti-myc antibody (green). Nuclei were stained with 1 μg/μl DAPI for 20 min. Merge of the three fluorescence signals is shown in the right panel. Scale bar, 6 μm. Chloroquine treatment increases the percentage of AMBRA1–ActA/mito-RFP colocalizations on mito-aggresomes per cell. HEK293 cells were co-transfected with a vector encoding AMBRA1–ActA and a vector encoding mito-RFP. After 24 h, cells were treated with chloroquine for 1 h, and cells were fixed and stained with an anti-myc antibody (green). Nuclei were stained with 1 μg/μl DAPI for 20 min. Merge of the three fluorescence signals is shown in the right panel. Scale bar, 6 μm. The graph shows the quantification of AMBRA1–ActA/mito-RFP colocalization on mito-aggresomes per cell (±S.D.). Each point value represents the mean±S.D. from three independent experiments. Statistical analysis was performed using Student's test (*P<0.05, no treatment versus Chloroquine; and *P<0.001, no treatment versus 3-MA). N, nucleus. (e) HEK293 cells were co-transfected with vectors encoding AMBRA1–ActA and mito-RFP and treated directly with 10 mM 3-MA. After 24 h, proteins extracts treated with Chloroquine (1 h) or left untreated were analysed by western blot using the following antibodies: anti-MnSOD, anti-TOM20, anti-myc (to control AMBRA1–ActA expression) and anti-ACTIN (loading control). The graph represents the MnSOD/ACTIN ratio (±S.D.). Each point value represents the mean±S.D. from three independent experiments. Statistical analysis was performed using Student's test (*P<0.05)
Figure 4
Figure 4
AMBRA1–ActA induces mitophagy in PARKIN-deficient cell lines. (a) HeLa and HEK293 cells were grown in normal media. After extraction of proteins, we performed a western blot analysis by using antibodies against PARKIN and against ACTIN (as a loading control). (b) Colocalization between AMBRA1–ActA, mito-RFP and LC3 protein. HeLa cells were co-transfected with vectors encoding AMBRA1–ActA and mito-RFP, and grown in normal media. Cells were then stained using antibodies anti-myc (AMBRA1, blue) and anti-LC3 (green). Nuclei were stained with 1 μg/μl DAPI for 20 min. Merge of the different fluorescence signals is illustrated. Scale bar, 8 μm. (c) Quantification in HeLa cells of AMBRA1–ActA/mito-RFP mito-colocalizations at 24, 48 and 72 h after transfection per cell (±S.D.). Each time point value is the mean±S.D. from three independent experiments. Statistical analysis was performed using Student's test (***P<0.001; 24 h versus 72 h). (d) HeLa cells were transfected with a vector encoding myc-AMBRA1–ActA. At 24, 48 and 72 h after transfection, proteins extracts were analysed by western blot using the following antibodies: anti-MnSOD, anti-TOM20, anti-myc (to control AMBRA1–ActA expression) and anti-ACTIN (loading control). The graph represents the MnSOD/ACTIN ratio (±S.D.). Each point value represents the mean±S.D. from three independent experiments. Statistical analysis was performed using Student's test (**P<0.01; 24 h versus 72 h). (e) HEK293 cells were co-transfected with vectors encoding ShPARKIN or control ShRNA and myc-AMBRA1-ActA. At 24 h after transfection, expression of PARKIN was controlled by western blot analysis by means of anti-PARKIN and anti-ACTIN (loading control) antibodies. Cells were fixed and stained with an anti-myc antibody (green). The merge of the fluorescence signals is shown in the right panels. Scale bar, 4 μm. The graph illustrates the quantification of AMBRA1–ActA/mito-RFP colocalizations on mito-aggresomes per cell (±S.D.). Each point value represents the mean±S.D. from two independent experiments. Statistical analysis was performed using Student's test (*P<0.01; 24 h versus 72 h). (f) HEK293 cells were co-transfected with vectors encoding ShPARKIN or control ShRNA, and myc-AMBRA1–ActA. At 24 h after transfection, expression of PARKIN was checked by western blot analysis by means of anti-PARKIN and anti-ACTIN (loading control) antibodies. At 24, 48 and 72 h after transfection, protein extracts were analysed by western blot using the following antibodies: anti-MnSOD, anti-TOM20, anti-myc (to control AMBRA1–ActA expression) and anti-ACTIN (loading control). The graph represents the MnSOD/ACTIN ratio (±S.D.). Each point value represents the mean±S.D. from three independent experiments. Statistical analysis was performed using Student's test (*P<0.05; 24 h versus 72 h). (g) HeLa cells were co-transfected with vectors encoding myc-AMBRA1–ActA and mito-RFP (red). At 24 h after transfection, cells were fixed and stained with anti-myc (AMBRA1, blue) and anti-p62 antibodies (green). Merge of the fluorescence signals are shown. N, nucleus. Scale bar, 4 μm
Figure 5
Figure 5
AMBRA1–ActA interacts with LC3, with this interaction being crucial for AMBRA1–ActA-induced mitophagy. (a) HEK293 cells were transfected with a vector encoding myc-AMBRA1–ActA. At 24 h after transfection, mitochondrial extracts were immunoprecipitated using an anti-myc antibody. Purified complexes and corresponding total extracts were analysed by western blot (WB), using anti-AMBRA1 and anti-LC3 antibodies. (b) HEK293 cells were transfected with a vector encoding myc-AMBRA1–ActA or myc-AMBRA1–ActA-LIRAA. At 24 h after transfection, mitochondrial extracts were immunoprecipitated using an anti-myc antibody. Purified complexes and corresponding total extracts were analysed by WB using anti-AMBRA1 and anti-LC3 antibodies. (c) HEK293 cells were transfected with a vector encoding myc-AMBRA1–ActA-LIRAA and mito-RFP. At 24 h hours after transfection, cells were fixed and stained with an anti-myc antibody (green). Merge of the fluorescence signals is shown in the right panels. Scale bar, 8 μm. The graph reports the quantification of mitochondrial clearance in HEK293 cells overexpressing AMBRA1–ActALIR-AA/mito-RFP at 24, 48 and 72 h after transfection per cell (±S.D.). Each time point value is the mean±S.D. from three independent experiments. (d) HEK293 cells were transfected with a vector encoding myc-AMBRA1–ActA-LIRAA. At 0, 24 and 48 h after transfection, protein extracts were analysed using anti-MnSOD, anti-myc (AMBRA1) and anti-ACTIN (loading control) antibodies. The graph represents the MnSOD/ACTIN ratio (±S.D.). Each point value represents the mean±S.D. from three independent experiments. Statistical analysis was performed by Student's test (*P<0.05; 0 h versus 48 h)
Figure 6
Figure 6
See next page for Figure caption

References

    1. Cecconi F, Levine B. The role of autophagy in mammalian development: cell makeover rather than cell death. Dev Cell. 2008;3:344–357. - PMC - PubMed
    1. Fimia GM, Stoykova A, Romagnoli A, Giunta L, Nardacci R, Corazzari M, et al. Ambra1 regulates autophagy and development of the nervous system. Nature. 2007;447:1121–1125. - PubMed
    1. Strappazzon F, Vietri-Rudan M, Campello S, Nazio F, Florenzano F, Fimia GM, et al. Mitochondrial BCL-2 inhibits AMBRA1-induced autophagy. EMBO J. 2011;30:1195–1208. - PMC - PubMed
    1. Lippincott-Schwartz J. Mitochondria supply membranes for autophagosome biogenesis during starvation. Cell. 2010;4:656–667. - PMC - PubMed
    1. Narendra N, Tanaka A, Suen DF, Youle RJ. Parkin is recruited selectively to impaired mitochondria and promotes their autophagy. J Cell Biol. 2008;183:795–803. - PMC - PubMed

Publication types