. 2014 Oct;18(10):1964-74.
doi: 10.1111/jcmm.12367. Epub 2014 Sep 12.

Meniscus maturation in the swine model: changes occurring along with anterior to posterior and medial to lateral aspect during growth

Affiliations

Meniscus maturation in the swine model: changes occurring along with anterior to posterior and medial to lateral aspect during growth

Alessia Di Giancamillo et al. J Cell Mol Med. 2014 Oct.

Abstract

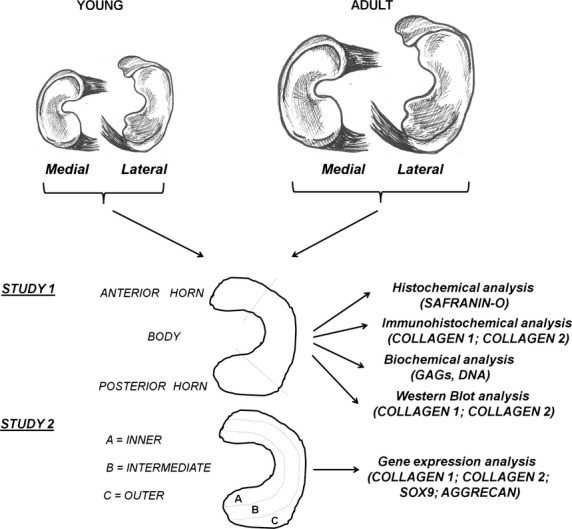
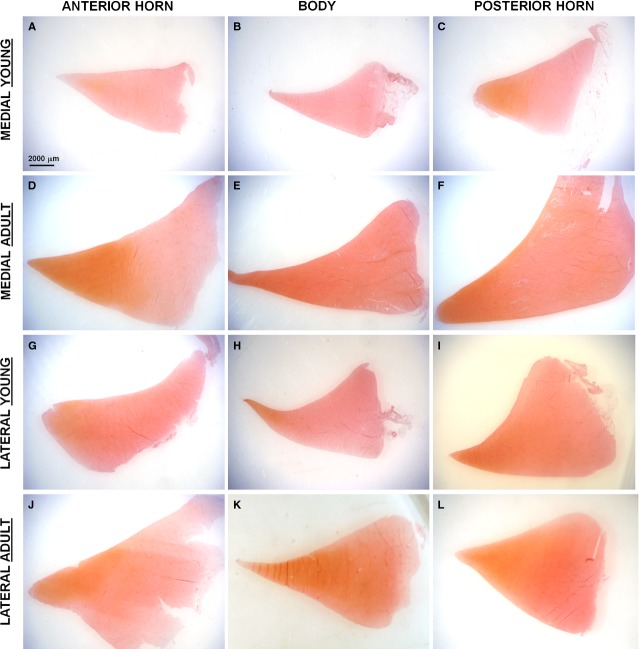
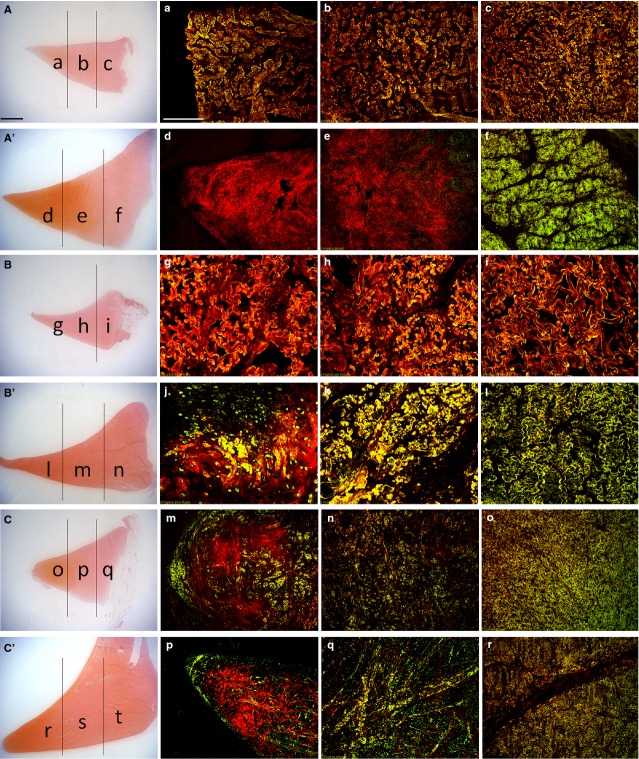
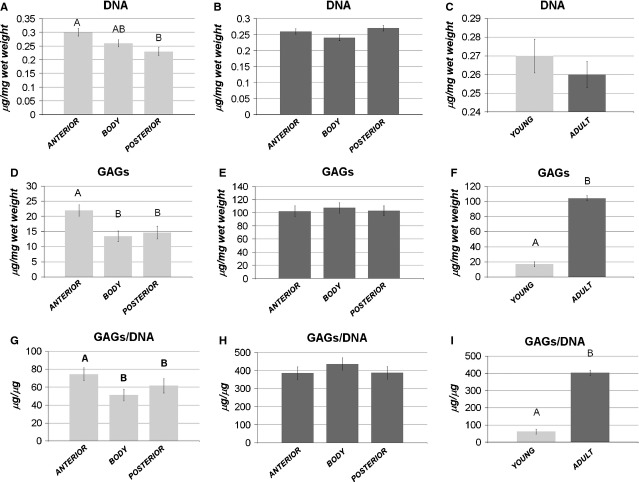
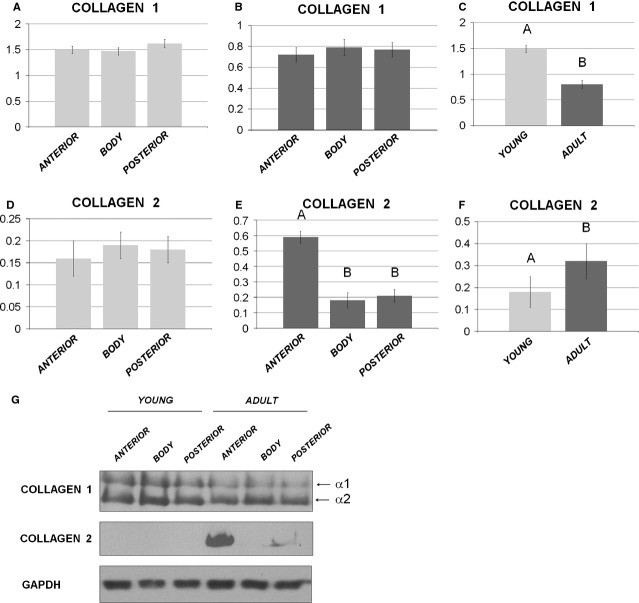
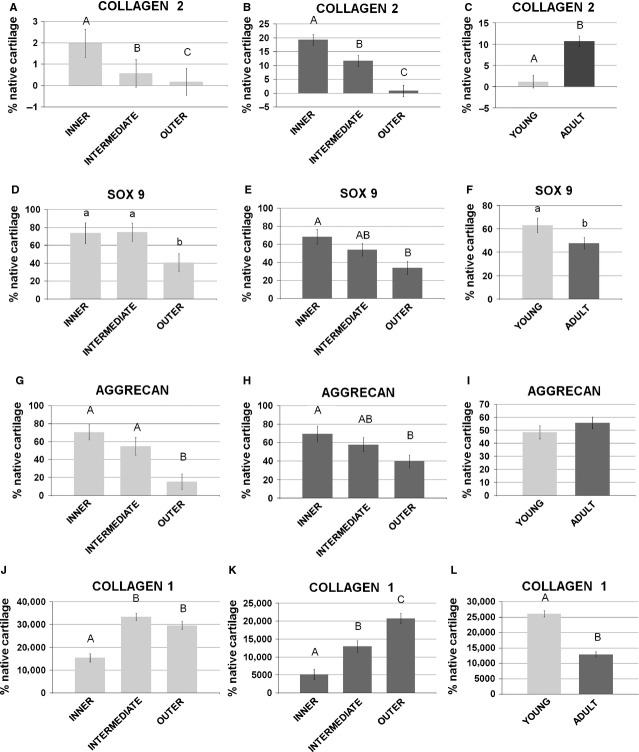
The meniscus plays important roles in knee function and mechanics and is characterized by a heterogeneous matrix composition. The changes in meniscus vascularization observed during growth suggest that the tissue-specific composition may be the result of a maturation process. This study has the aim to characterize the structural and biochemical variations that occur in the swine meniscus with age. To this purpose, menisci were collected from young and adult pigs and divided into different zones. In study 1, both lateral and medial menisci were divided into the anterior horn, the body and the posterior horn for the evaluation of glycosaminoglycans (GAGs), collagen 1 and 2 content. In study 2, the menisci were sectioned into the inner, the intermediate and the outer zones to determine the variations in the cell phenotype along with the inner-outer direction, through gene expression analysis. According to the results, the swine meniscus is characterized by an increasing enrichment in the cartilaginous component with age, with an increasing deposition in the anterior horn (GAGs and collagen 2; P < 0.01 both); moreover, this cartilaginous matrix strongly increases in the inner avascular and intermediate zone, as a consequence of a specific differentiation of meniscal cells towards a cartilaginous phenotype (collagen 2, P < 0.01). The obtained data add new information on the changes that accompany meniscus maturation, suggesting a specific response of meniscal cells to the regional mechanical stimuli in the knee joint.

Keywords: collagen fibres; fibrochondrocytes; glycosaminoglycans; meniscus.


Figures

Figure 1
Figure 1
Experimental design. Medial and lateral menisci were harvested from young and adult pigs. In study 1, the swine menisci were sectioned into the anterior horns, the bodies and the posterior horns and processed for SAFRANIN-O staining, collagen 1 and 2 immunofluorescent staining, DNA and GAGs quantification, collagen 1 and 2 quantification by Western blot analysis. In study 2, the swine menisci were sectioned into the inner, the intermediate and the external zones to determine the expression levels of collagen 1, collagen 2, Sox9 and aggrecan by real-time PCR.
Figure 2
Figure 2
SAFRANIN-O staining on traversal sections of the meniscus. Scale bar 2000 μm. (A) Anterior horn, medial young meniscus; (B) Body, medial young meniscus; (C) Posterior horn, medial young meniscus; (D) Anterior horn, medial adult meniscus; (E) Body, medial adult meniscus; (F) Posterior horn, medial adult meniscus; (G) Anterior horn, lateral young meniscus; (H) Body, lateral young meniscus; (I) Posterior horn, lateral young meniscus; (J) Anterior horn, lateral adult meniscus; (K) Body, lateral adult meniscus; (L) Posterior horn, lateral adult meniscus.
Figure 3
Figure 3
Immunofluorescent staining of collagen 1 and 2 on traversal sections: medial anterior horn of the young (ac) and adult (df) meniscus; medial body of the young (gi) and adult (ln) meniscus; medial posterior horn of the young (oq) and adult (rt) meniscus. Collagen 1 is in green, collagen 2 is in red, superimposition appears in yellow colour (various degrees). Scale bar 200 μm. For comparison, two representative pictures of the young (AC) and adult (A’, B’, C’) anterior horns, body and posterior horn at low magnification, stained for SAFRANIN-O. Scale bar 2000 μm. (a) Inner zone, anterior horn young meniscus. (b) Intermediate zone, anterior horn, young meniscus. (c) Outer zone, anterior horn, young meniscus. (d) Inner zone, anterior horn, adult meniscus. (e) Intermediate zone, anterior horn adult meniscus, (f) Outer zone, anterior horn, adult meniscus. (g) Inner zone, body, young meniscus. (h) Intermediate zone, body, young meniscus. (i) Outer zone, body, young meniscus. (j) Inner zone, body, adult meniscus. (k) Intermediate zone, body, adult meniscus. (l) Outer zone, body, adult meniscus, (m) Inner zone, posterior horn young meniscus. (n) Intermediate zone, posterior horn, young meniscus. (o) Outer zone, posterior horn, young meniscus. (p) Inner zone, posterior horn, adult meniscus. (q) Intermediate zone, posterior horn adult meniscus. (r) Outer zone, posterior horn, adult meniscus.
Figure 4
Figure 4
Biochemical analysis. Comparison of DNA (AB), GAGs (DE), and GAGs/DNA content (GH) among the anterior horn, the body and the posterior horn: (A,D,G) young model; (B,E,H) adult model. Comparison of DNA (C), GAGs (F) and GAGs/DNA content (I) between the young and the adult samples. Values with different superscripts differ for P < 0.01 (A,B). N/group = 12.
Figure 5
Figure 5
Western blot analysis. Comparison of collagen 1 (A and B) and collagen 2 (D and E) among the anterior horn, the body and the posterior horn: (A and D) young model; (B and E) adult model. Comparison of collagen 1 (C) and collagen 2 (F) content between the young and the adult specimens. Values with different superscripts differ for P < 0.01 (A,B). (G) Representative Western blot image for collagen 1, collagen 2 and GAPDH. N/group = 8.
Figure 6
Figure 6
Gene expression analysis by real-time PCR. Comparison of collagen 2 (A and B), Sox9 (D and E), aggrecan (G and H) and collagen 1 (L and M) among the inner, the intermediate and the outer areas of the menisci: (A,D,G,L) young model; (B,E,H,M) adult model. Comparison of collagen 2 (C), Sox9 (F), aggrecan (I) and collagen 1 (N) between the young and the adult samples. Values with different superscripts differ for P < 0.05 (a,b) or P < 0.01 (A,B). N/group = 8.

References

    1. Aagaard H, Verdonk R. Function of the normal meniscus and consequences of meniscal resection. Scand J Med Sci Sports. 1999;9:134–40. - PubMed
    1. Fithian DC, Kelly MA, Mow VC. Material properties and structure-function relationships in the menisci. Clin Orthop. 1990;252:19–31. - PubMed
    1. Messner K, Gao J. The menisci of the knee joint. Anatomical and functional characteristics, and a rationale for clinical treatment. J Anat. 1998;193:161–78. - PMC - PubMed
    1. Furumatsu T, Kanazawa T, Yokoyama Y, et al. Inner meniscus cells maintain higher chondrogenic phenotype compared with outer meniscus cells. Connect Tissue Res. 2011;52:459–65. - PubMed
    1. Smith SM, Shu C, Melrose J. Comparative immunolocalisation of perlecan with collagen II and aggrecan in human foetal, newborn and adult ovine joint tissues demonstrates perlecan as an early developmental chondrogenic marker. Histochem Cell Biol. 2010;134:251–63. - PubMed

MeSH terms