

Forest stand growth dynamics in Central Europe have accelerated since 1870
- PMID: 25216297
- PMCID: PMC4175583
- DOI: 10.1038/ncomms5967
Forest stand growth dynamics in Central Europe have accelerated since 1870
Abstract
Forest ecosystems have been exposed to climate change for more than 100 years, whereas the consequences on forest growth remain elusive. Based on the oldest existing experimental forest plots in Central Europe, we show that, currently, the dominant tree species Norway spruce and European beech exhibit significantly faster tree growth (+32 to 77%), stand volume growth (+10 to 30%) and standing stock accumulation (+6 to 7%) than in 1960. Stands still follow similar general allometric rules, but proceed more rapidly through usual trajectories. As forest stands develop faster, tree numbers are currently 17-20% lower than in past same-aged stands. Self-thinning lines remain constant, while growth rates increase indicating the stock of resources have not changed, while growth velocity and turnover have altered. Statistical analyses of the experimental plots, and application of an ecophysiological model, suggest that mainly the rise in temperature and extended growing seasons contribute to increased growth acceleration, particularly on fertile sites.
Figures
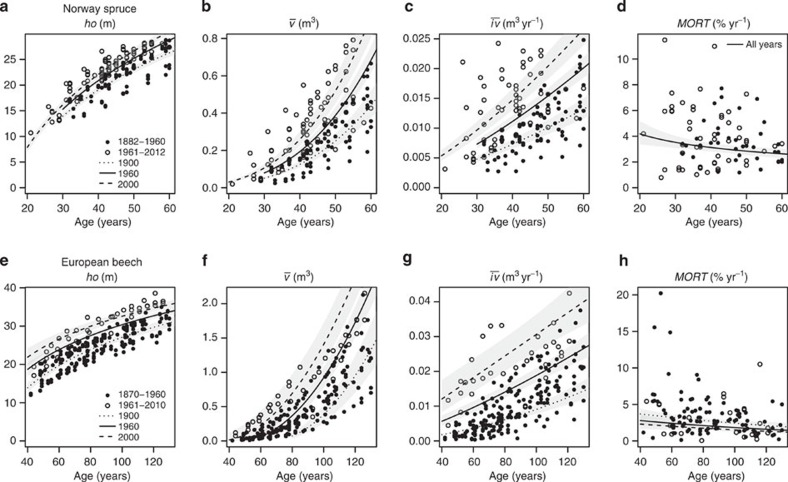
 ; (c,g) mean tree annual volume increment
  ; and (d,h) relative tree mortality rate, MORT; for Norway spruce (a–d) and European beech (e–h) age ranges. Observations before 1960 (filled symbols); after 1960 (empty symbols); predictions with our fitted linear mixed models (LMM) for 2000 (dashed line); for 1960 (solid line); and as a reference for 1900 (dotted line). The grey-shaded areas illustrate the prediction standard error. Although the error bands partially overlap, all illustrated calendar year trends are statistically significant at a minimum of P<0.05 (LMM), with n=157 (a,b); n=141 (c); n=225 (e,f); n=217 (g), with the exception of MORT in European beech (h) with P<0.1 (LMM, n=119) and no significance in Norway spruce (d). Note that positions on these error bands are not independent, for example, a prediction on the lower edge of the confidence band for one calendar year would be on the lower edge for all other calendar years.
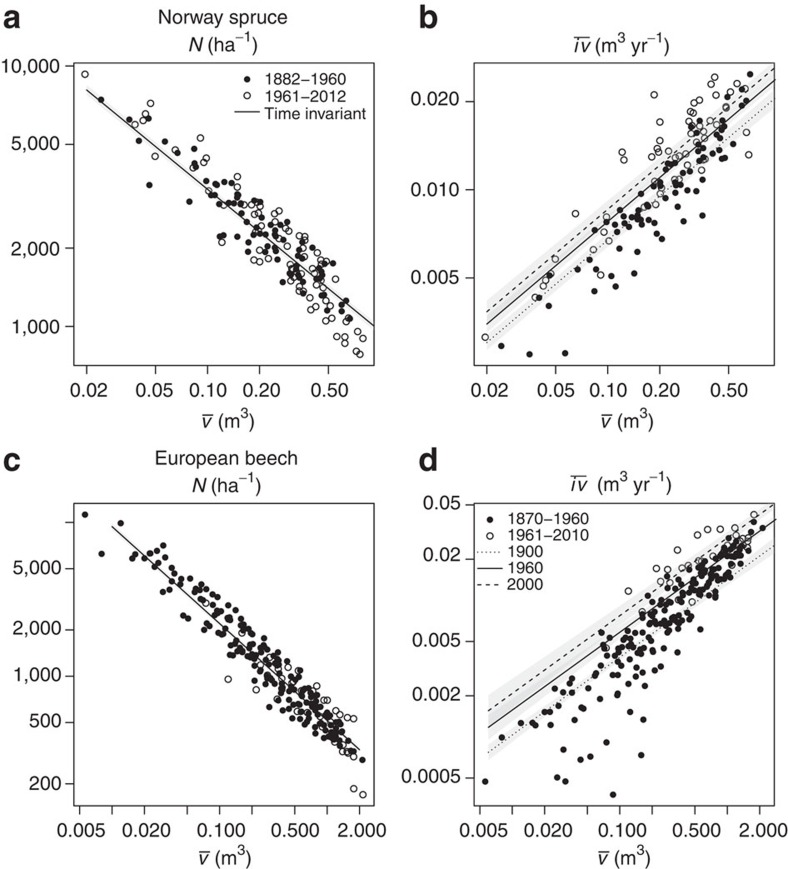
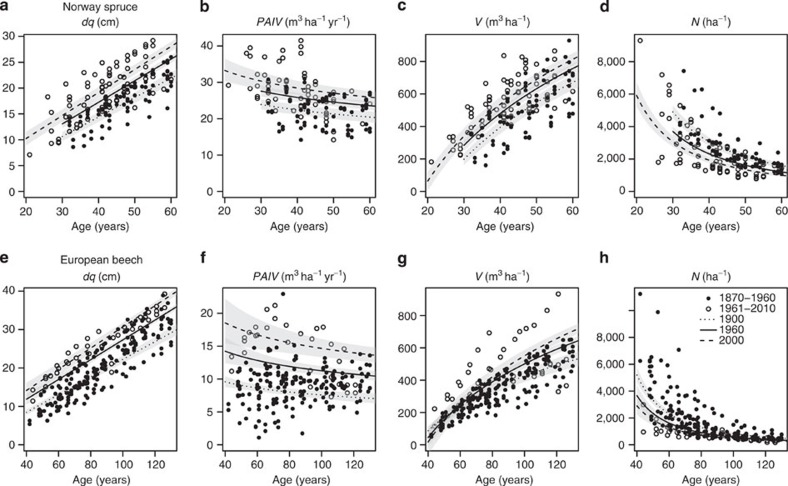
 ; and (b,d) mean annual volume growth
  and mean tree volume
  in a double-logarithmic scale for Norway spruce (a,b) and European beech (c,d). Filled symbols: observations up to 1960; empty symbols: after 1960. Predictions derived from our fitted linear mixed models (LMMs) do not change with calendar year for the
  relationship (solid lines in a,c), whereas they do for the
  relationship. We show the predictions for the years 2000 (dashed lines in b,d), 1960 (solid lines in b,d) and the 1900 reference (dotted lines in b,d). The grey-shaded areas illustrate the prediction standard error. Although the error bands partially overlap, all illustrated calendar year trends were significant at P<0.01 (LMM, n=141 and n=217 for Norway spruce and European beech). Note that positions on these error bands are not independent, for example, a prediction on the lower edge of the confidence band for one calendar year would be on the lower edge for all other calendar years.
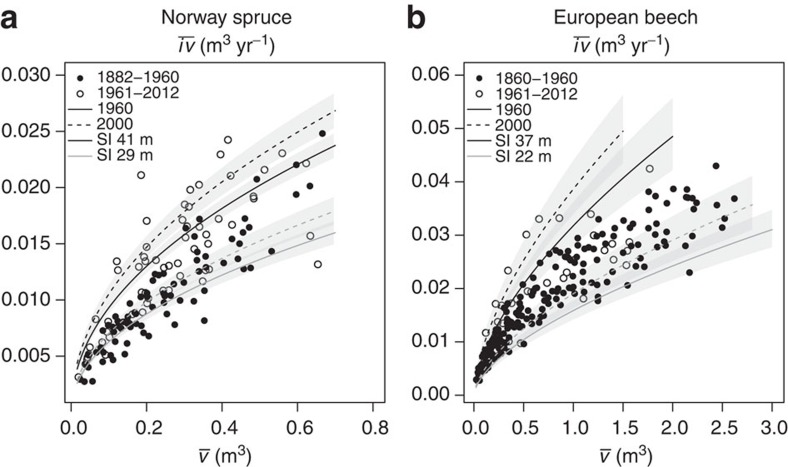
 relationship’s change (
 : mean annual volume growth;
  : mean tree volume) depended on site quality as expressed by the site index (SI) for Norway spruce (a) and European beech (b). SI is the yield-table expectation for stand height at 100 years of age. Filled symbols: observations up to 1960; empty symbols: after 1960. Dashed lines represent the estimated curves obtained from fitted linear mixed models (LMM) for the calendar year 2000; solid lines for 1960. Light grey and black lines: curves for the lowest and highest SI represented by our data, respectively. The grey-shaded areas illustrate the prediction standard error. Although the error bands partly overlap, the illustrated interactions of calendar year and site quality were significant at P<0.01 (LMM, n=141 and n=217 for Norway spruce and European beech). Note that positions on these error bands were not independent, for example, a prediction on the lower edge of the confidence band for a given calendar year and a given site quality would be on the lower edge for all other calendar years and SI’s.
References
-
- Pretzsch H. Growth and Yield 664Springer (2009).
-
- Stephenson N. L. et al.. Rate of tree carbon accumulation increases continuously with tree size. Nature 507, 90–93 (2014). - PubMed
-
- Assmann E. & Franz F. Vorläufige Fichten-Ertragstafel für Bayern. Forstw Cbl 84, 13–43 (1965).
-
- Schober R. inDie Rotbuche 1971. Schr Forstl Fak Univ Göttingen u Niedersächs Forstl Versuchsanst 43/44, JD Sauerländer’s Verlag ed Schober R. 333Frankfurt am Main (1967).
Publication types
MeSH terms
LinkOut - more resources
Full Text Sources
Other Literature Sources
Research Materials
Miscellaneous
