. 2014 Oct;20(10):1147-56.
doi: 10.1038/nm.3681. Epub 2014 Sep 14.

Regulation of astrocyte activation by glycolipids drives chronic CNS inflammation

Affiliations

Regulation of astrocyte activation by glycolipids drives chronic CNS inflammation

Lior Mayo et al. Nat Med. 2014 Oct.

Abstract

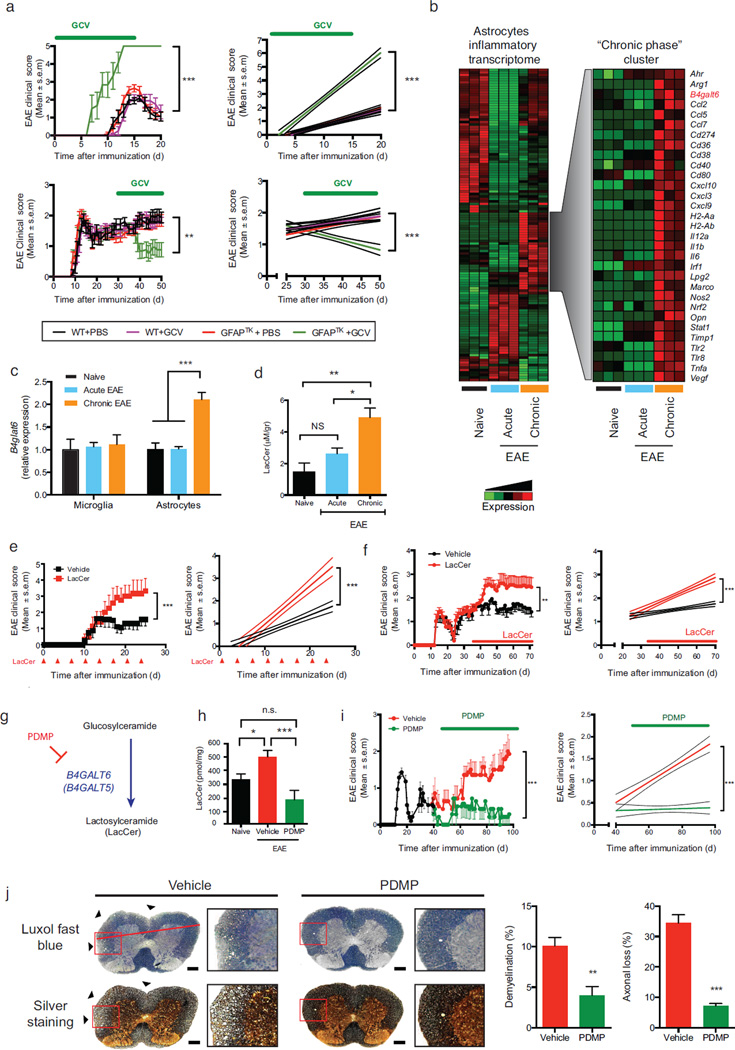
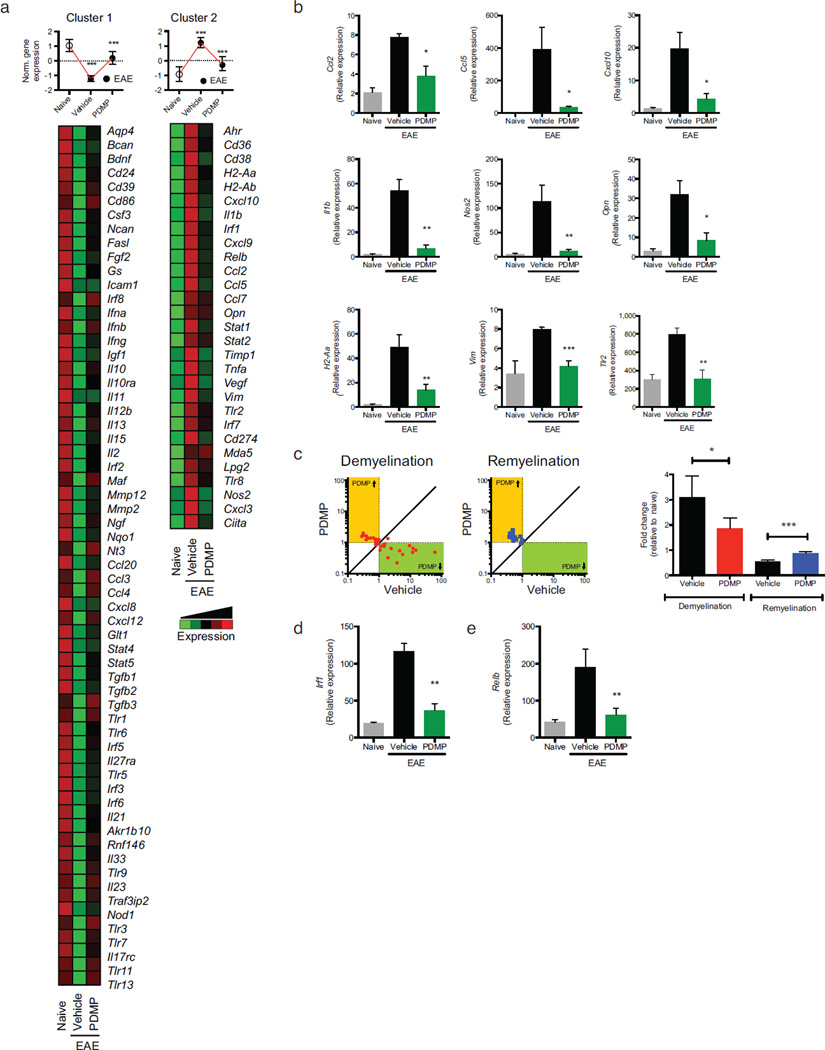
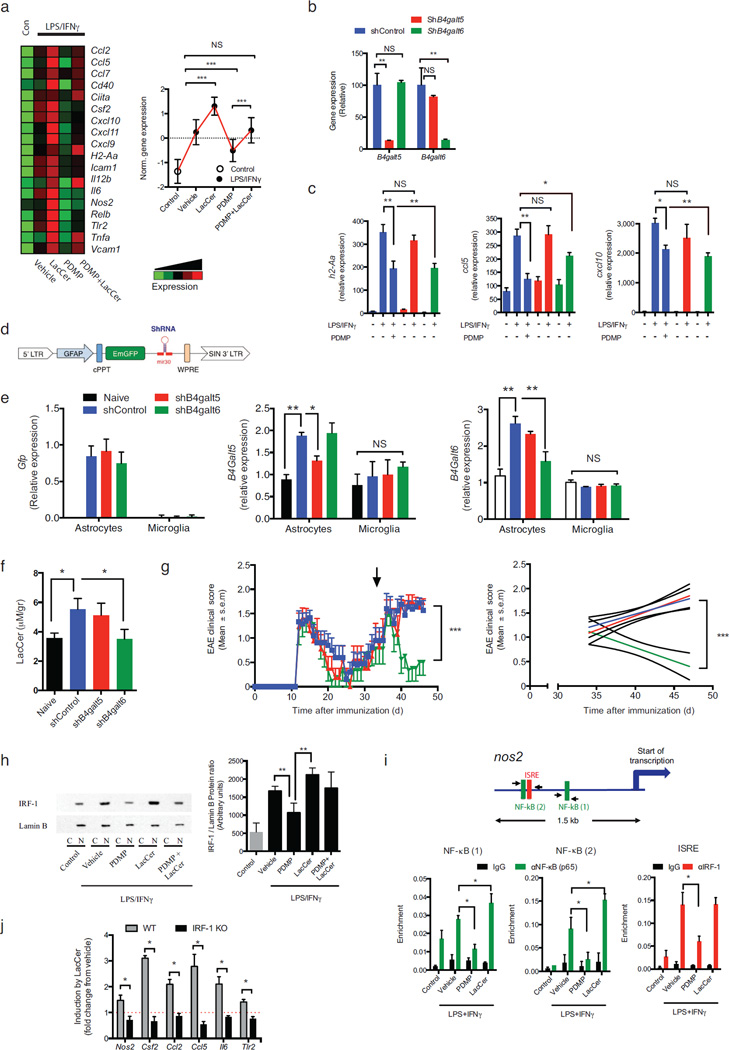
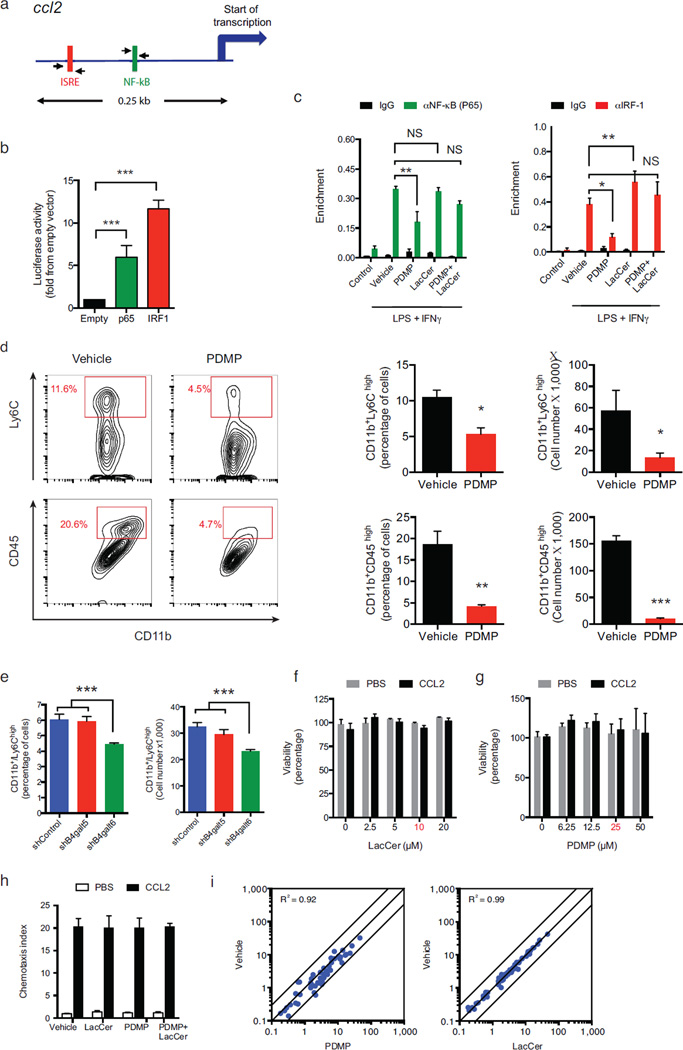
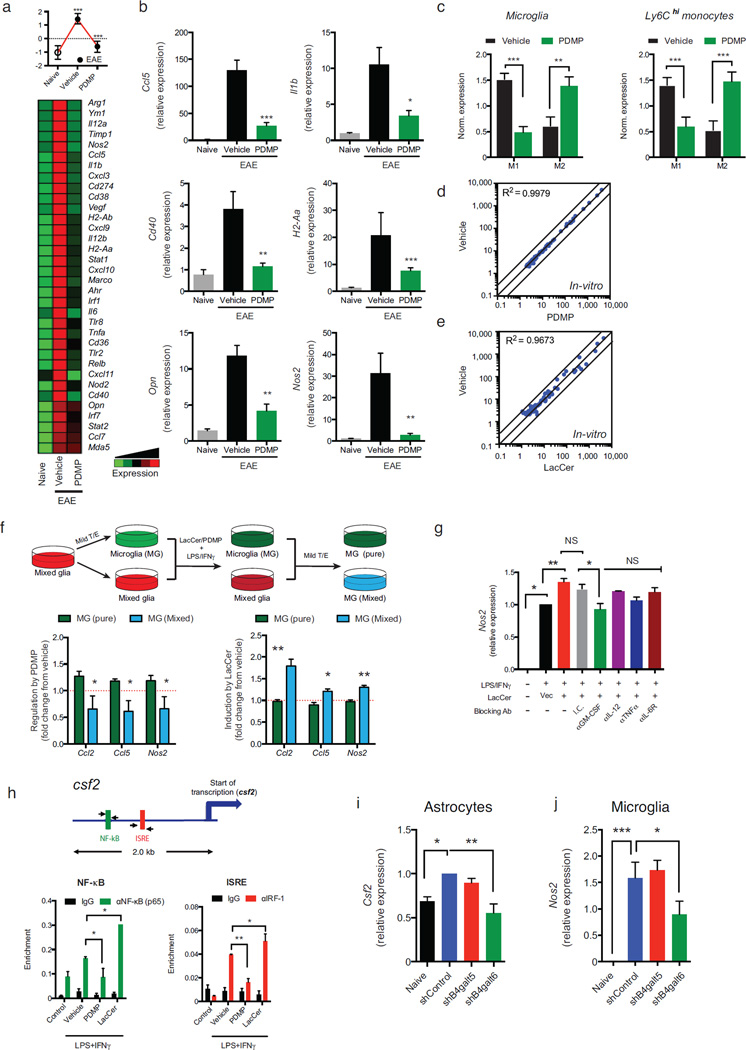
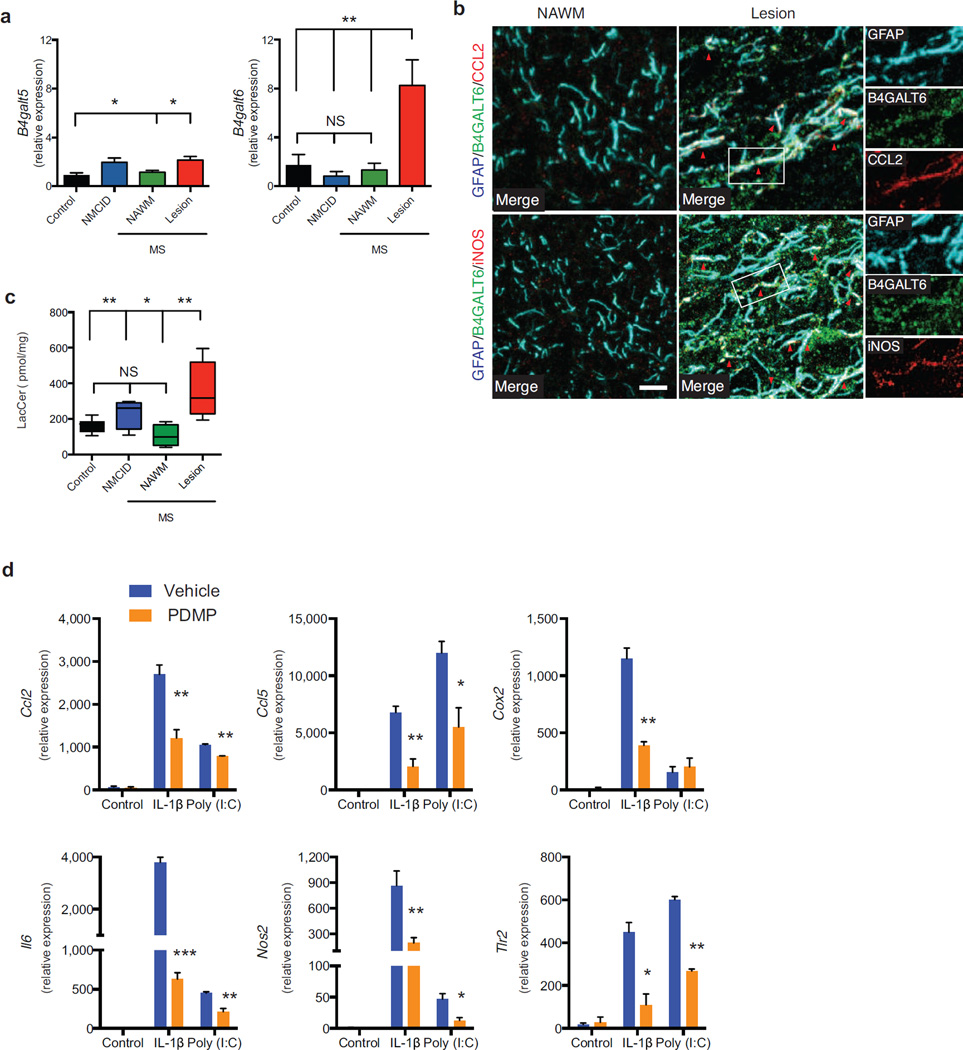
Astrocytes have complex roles in health and disease, thus it is important to study the pathways that regulate their function. Here we report that lactosylceramide (LacCer) synthesized by β-1,4-galactosyltransferase 6 (B4GALT6) is upregulated in the central nervous system (CNS) of mice during chronic experimental autoimmune encephalomyelitis (EAE), a model of multiple sclerosis (MS). LacCer acts in an autocrine manner to control astrocyte transcriptional programs that promote neurodegeneration. In addition, LacCer in astrocytes controls the recruitment and activation of microglia and CNS-infiltrating monocytes in a non-cell autonomous manner by regulating production of the chemokine CCL2 and granulocyte-macrophage colony-stimulating factor (GM-CSF), respectively. We also detected high B4GALT6 gene expression and LacCer concentrations in CNS MS lesions. Inhibition of LacCer synthesis in mice suppressed local CNS innate immunity and neurodegeneration in EAE and interfered with the activation of human astrocytes in vitro. Thus, B4GALT6 regulates astrocyte activation and is a potential therapeutic target for MS and other neuroinflammatory disorders.


Figures

Figure 1
Figure 1. B4GALT6 activity controls CNS inflammation and neurodegeneration
(a) EAE scores in wild type (WT) and GFAP-TK transgenic (GFAPTK) F1 hybrid mice (mean and s.e.m.). Right panel, linear-regression curve; dashed lines indicate 95% confidence interval of the regression line. Mice were treated daily with Ganciclovir (GCV, 25mg/kg) or vehicle (PBS) as indicated (green bar). Representative data of three independent experiments with n ≥ 7 mice/group. (a, upper panel) Mice were pretreated 7 days before EAE induction and continuously until day 15, (a, lower panel) or were treated only during the progressive phase (days 30–50). (b, left panel) Heatmap depicting the differential mRNA expression profiles in astrocytes isolated from the CNS of naïve NOD mice, or during the acute or the progressive phase of NOD EAE, as detected by Nanostring nCounter analysis; Representative data of three independent experiments. (b, right panel) Heatmap depicting a unique gene cluster specifically up-regulated during the progressive phase of EAE. (c) qPCR analysis of b4galt6 expression in microglia or astrocytes from naïve or EAE NOD mice; expression normalized to gapdh and presented relative to that of cells from naïve mice. Representative data of three independent experiments, statistical analysis by Student’s t-test. (d) Quantification of lactosylceramide (LacCer) in the CNS of naïve or EAE NOD mice, relative to net tissue weight. Representative data of three independent experiments with n ≥ 15 samples per condition, statistical analysis by Student’s t-test. (e, f) EAE clinical scores in C57BL/6 (e) and NOD (f) mice following administration of LacCer (10µg per mouse) or vehicle as indicated by red arrows or bar. Representative data of two independent experiments with n ≥ 8 mice/group. Statistical analysis as in (a). (e) EAE scores following LacCer or vehicle administration together with the MOG(35–55) peptide to C57BL/6 mice during EAE induction, and also intraperitoneally (i.p.) every other 3 days henceforth (mean and s.e.m.). (f) EAE scores following LacCer or vehicle administration initiated at day 35 after EAE induction (progressive phase). (g) PDMP inhibits LacCer synthesis by B4GALT6. (h) Quantification of LacCer levels in the CNS of naïve or EAE NOD mice treated with PDMP or vehicle as shown in (i). (i) Clinical scores of EAE in NOD mice treated with PDMP or vehicle, administered daily (20mg/kg given i.p. twice a day) from day 40 after EAE induction (progressive phase) for the duration of the experiment Representative data of three independent experiments with n ≥ 8 mice/group). (j) Histopathology analysis of lumbar spinal cord sections from EAE NOD mice treated with PDMP or vehicle as in (i) and stained with Luxol fast blue or Bielschowsky’s silver stain for analysis of demyelination or axonal loss, respectively. Scale bar 100 µM. Representative data of two independent experiments with n ≥ 6 mice/group (mean and s.e.m.). *P<0.05, **P<0.01, ***P<0.001, n.s. not significant.
Figure 2
Figure 2. B4GALT6 inhibition suppresses astrocyte activation during EAE
(a) Heatmap depicting mRNA expression, as detected by Nanostring nCounter analysis, in astrocytes isolated from naïve or EAE NOD mice treated with PDMP or vehicle (vehicle). Upper panels, histogram presentation of normalized gene expression in each gene cluster. Representative data of three independent experiments, statistical analysis by Student’s t-test. (b) qPCR analysis of ccl2, ccl5, cxcl10, il1b, nos2, opn, H2-Aa, vim and tlr2 expression in astrocytes isolated from naïve and EAE NOD mice treated with vehicle or PDMP; expression is presented relative gapdh. Representative data of three independent experiments, statistical analysis by Student’s t-test. (c) Relative expression (to NOD naïve group) of genes associated with the control of myelination (Supplementary Table 2) in astrocytes isolated from EAE NOD mice treated with vehicle or PDMP. Representative data of three independent experiments. Statistical analysis by Student’s t-test. (d, e) qPCR analysis of Irf1(d) and Relb(e) expression performed as in (b). All data presented as mean and s.e.m. *P < 0.05, **P < 0.01, ***P < 0.001 and n.s. not significant.
Figure 3
Figure 3. LacCer produced by B4GALT6 acts in an autocrine manner to boost astrocyte activation
Cultured astrocytes were pre-treated for 1h with PDMP (25µM), LacCer (10µM), both (LacCer+PDMP), or vehicle (vehicle), followed by activation with lipopolysaccharide (100 ng/ml) and Interferon-γ (100 Units/ml) (LPS/IFNγ) or left un-treated (control). (a) mRNA expression, as detected by Nanostring nCounter analysis, in astrocytes stimulated with LPS/IFNγ, presented as Heatmap (right panel) and histogram presentation of the normalized gene expression (left panel). Representative data of three independent experiments, statistical analysis by one-way ANOVA followed by Tukey post-hoc analysis. (b-c) The expression of B4galt5 (shB4galt5), B4galt6 (shB4galt6) or non-targeting shRNA (ShControl) in C8-D30 astrocytes was knocked-down using verified shRNA (n ≥ 4). (b) qRT analysis of B4galt5 and B4galt6 mRNA expression. (c) astrocytes were activated as in (a) and mRNA expression for H2-Aa, Ccl5 and Cxcl10 was determined; expression is presented relative to house keeping gene (Gapdh) (n ≥ 4). (d) Schematic map of the astrocyte-specific shRNA lentiviral vector. (e–g) i.c.v. injection of astrocyte-specific shB4galt6 lentivirus ameliorates disease severity. NOD mice were injected i.c.v. with 1 × 10⁷ IU of shControl, shB4galt5 or shB4galt6 lentivirus, at day 35 after EAE induction (progressive phase). n = 10 mice per group (e, f) 10 days after i.c.v. injection experiment was terminated and (e) b4galt5 and b4galt6 expression levels were determined by qPCR in astrocytes isolated from naïve or EAE NOD mice; expression normalized to gapdh and presented relative to that of cells from naïve mice. Representative data of two independent experiments, Statistical analysis by one-way ANOVA, followed by Tukey post-hoc analysis. (f) LacCer levels were quantified of in the CNS of naïve or EAE NOD mice treated as shown in (g). Statistical analysis by one-way ANOVA, followed by Tukey post-hoc analysis. (g) EAE clinical scores. Representative data of two independent experiments. Statistical analysis as in (Fig. 1a). (h) Cultured primary astrocytes were pre-treated for 1h with PDMP (25µM), LacCer (10µM), both (LacCer+PDMP), or vehicle control (vehicle), followed by activation with LPS/IFNγ for 45min, or left un-treated (control, Con). IRF-1 and Lamin B expression in the nuclear fraction analyzed by western blot and the degree of IRF-1 translocation to the nucleus was assessed by the ratio between the expression of IRF-1 and Lamin-B in the nuclear fractions following densitometric quantification on four independent experiments (right panel). Statistical analysis by one-way ANOVA, followed by Tukey post-hoc analysis. (i) ChIP analysis of the interaction of NF- κB, and IRF-1 with the) nos2 promoter in primary cultured astrocytes. Experimental design and data analysis as in (Fig. 4c). Data from two independent experiments (j) qPCR analysis of the expression of nos2, csf2, ccl2, ccl5, il6, and tlr2 in astrocyte cultures established from WT or IRF-1 deficient (IRF-1 KO) mice, pre-treated with LacCer or vehicle, and activated with LPS/IFNγ. Mean gene induction in response to LacCer treatment in LPS/IFNγ-activated cells from 5 independent experiments. Statistical analysis by Student’s t-test. All data presented as mean and s.e.m. *P<0.05, **P<0.01, ***P<0.01 and n.s. not significant.
Figure 4
Figure 4. B4GALT6 regulates ccl2 transcriptional activity in astrocytes
(a) Murine ccl2 promoter. (b) Luciferase activity in 293T cells transfected with the ccl2 luciferase reporter plus one of the following constructs encoding IRF-1, p65 or an empty control vector (Empty). Results are relative to secreted alkaline phosphatase activity, presented as fold induction from empty vector. Data from three independent experiments, statistical analysis by Student’s t-test. (c) ChIP analysis of the interaction of NF- κB, and IRF-1 with the ccl2 promoter in primary cultured astrocytes, pre-treated with PDMP and LacCer and activated with LPS/IFNγ (as in Fig. 3), 2 hours following LPS/IFNγ induction. (d) Recruitment of inflammatory monocytes (defined either as of CD11b+ Ly6Chigh or CD11b+CD45high cells) to the CNS of EAE NOD mice treated with PDMP or vehicle, as in (Fig. 1i), analyzed by flow cytometry and presented as cell frequency, and total cell numbers. Representative data of three independent experiments. Statistical analysis by Student’s t-test. (e) The frequency and number of CD11b+ Ly6Chigh monocytes as determined in the CNS 10 days after the i.c.v. injection of astrocytes-specific shRNA lentivirus as in (Fig. 3g) . Representative data of two independent experiments. Statistical analysis by one-way ANOVA, followed by Tukey post-hoc analysis. (f–h) monocytes were pre-treated for 1h with PDMP, LacCer, both (LacCer+PDMP), or vehicle, and monocytes chemotaxis was measured using a transwell chamber system. CCL2 or PBS were added to the lower compartment, and 3h later cell viability (f, g) and the number of the migrating monocytes (h) and cell viability were determined. Migration data is presented as fold from control, and cell viability as percentage from control. Working concentrations are marked in red. Representative data of four independent experiments. (i) CD11b+ Ly6Chigh monocytes were treated with PDMP, LacCer or vehicle, followed by activation with LPS/IFNγ for 6h or left un-treated (control) as in (Fig. 3a). mRNA expression was determined by nCounter Nanostring analysis. Statistical analysis by two ANOVA showed no significance effect of the LacCer or PDMP treatments on the monocytes migration. For all data, data presented as mean and s.e.m. *P<0.05, **P<0.01, ***P<0.001 and n.s. not significant.
Figure 5
Figure 5. B4GALT6 in astrocytes regulates the activation of microglia and CNS-infiltrating monocytes
(a) Heatmap depicting mRNA expression, as determined by nCounter Nanostring analysis, in microglia from naïve or EAE NOD mice treated with PDMP or vehicle. Representative data of three independent experiments. Statistical analysis by Student’s t-test. (b) qPCR analysis of ccl5, il1b, opn, nos2, cd40, and H2-Aa gene expression relative to Gapdh. (c) Mean normalized expression of genes associated with M1- or M2-phenotype in microglia (Supplementary Table 3) (c, left panel) and Ly6Chigh monocytes (c, right panel). Statistical analysis by Student’s t-test. (d, e) Primary microglia were pre-treated with PDMP, LacCer, or vehicle, followed by activation with LPS/IFNγ for 6h or left un-treated (control) as in (Fig. 3a). mRNA expression was determined by nCounter Nanostring analysis (d, e) was determined. Representative data of five independent experiments. (f) Mixed glia cultures were treated with mild trypsin/EDTA (T/E) to remove the astrocyte monolayer leaving only the microglia attached to the plate, or left un-treated. Cultures were pre-treated with PDMP, LacCer or vehicle, and activated with LPS/IFNγ for 6h. Following activation, both cultures were washed, and incubated with mild T/E to remove the astrocytes; thus, leaving only the microglia (MG) attached to the plates. RNA was harvested from microglia treated in the absence [MG (pure)] or presence [MG (mixed)] of astrocytes and gene expression was analyzed by qPCR for the expression ccl2, ccl5 and nos2 relative to gapdh. Data present the relative effect of PDMP (left panel) or LacCer (right panel) pre-treatment on LPS/IFNγ-triggered gene induction, from five independent experiments. Statistical analysis by Student’s t-test. (g) Mixed glia were pre-treated with indicated blocking antibodies or appropriate isotype controls (25µg/ml) and LacCer (10µM) or vehicle control, and then activated with LPS/IFNγ for 6h. Microglia were isolated as in (f), and microglial-nos2 expression was determined by qRT relative to gapdh and presented as in (f). Representative data of three independent experiments. (h) ChIP analysis of the interaction of NF- κB, and IRF-1 with the csf2 promoter in primary cultured astrocytes. (i, j) Expression csf2 in astrocytes (i) and nos2 in microglial cells (j) isolated form the CNS of chronic EAE NOD mice, 10 days after the i.c.v. injection of astrocytes-specific shRNA lentivirus as in (Fig. 3g). Data from two independent experiments. For all data, means and s.e.m. are shown. *P<0.05, **P< 0.01, ***P<0.001 and n.s. not significant.
Figure 6
Figure 6. B4GALT5 and B4GALT6 and LacCer levels are up-regulated in MS lesions
Autopsy samples were obtained from lesions (n=10) or NAWM (n=5) from MS, non-MS CNS inflammatory diseases (NMSCID, including viral encephalitis, Rasmussen’s encephalitis and ADEM, n=5) patients and healthy controls (n=6). (a) qPCR analysis of B4GALT5 and B4GALT6 mRNA expression in CNS samples relative to ACTB. (b) IF analysis of B4GALT6, CCL2 and iNOS in GFAP+ astrocytes in NAWM and Lesion of MS patients. Scale Bar 10 µM (c) LacCer levels determined in CNS samples, relative to protein content. Statistical analysis by one-way ANOVA, followed by Tukey post-hoc analysis. (d) Primary human astrocytes were pre-treated with PDMP (25 µM) or vehicle, and activated with IL-1β (10 ng/ml) or Poly (I:C) (10 µg/ml) or left untreated (control). RNA was harvested 6h later and the expression of CCL2, CCL5, COX2, IL6, NOS2, and TLR2 was analyzed by qPCR relative to ACTB in 3 independent experiments. Statistical analysis by Student’s t-test. Data presented are mean and s.e.m. *P<0.05, **P<0.01 and ***P<0.001.

Comment in

References

    1. Clarke LE, Barres BA. Emerging roles of astrocytes in neural circuit development. Nat Rev Neurosci. 2013;14:311–321. - PMC - PubMed
    1. Rouach N, Koulakoff A, Abudara V, Willecke K, Giaume C. Astroglial metabolic networks sustain hippocampal synaptic transmission. Science. 2008;322:1551–1555. - PubMed
    1. Seifert G, Schilling K, Steinhauser C. Astrocyte dysfunction in neurological disorders: a molecular perspective. Nat Rev Neurosci. 2006;7:194–206. - PubMed
    1. Tsai HH, et al. Regional astrocyte allocation regulates CNS synaptogenesis and repair. Science. 2012;337:358–362. - PMC - PubMed
    1. Bush TG, et al. Leukocyte infiltration, neuronal degeneration, and neurite outgrowth after ablation of scar-forming, reactive astrocytes in adult transgenic mice. Neuron. 1999;23:297–308. - PubMed

Publication types

MeSH terms