

Cost-effectiveness of the Three I's for HIV/TB and ART to prevent TB among people living with HIV
- PMID: 25216828
- PMCID: PMC4886505
- DOI: 10.5588/ijtld.13.0571
Cost-effectiveness of the Three I's for HIV/TB and ART to prevent TB among people living with HIV
Abstract
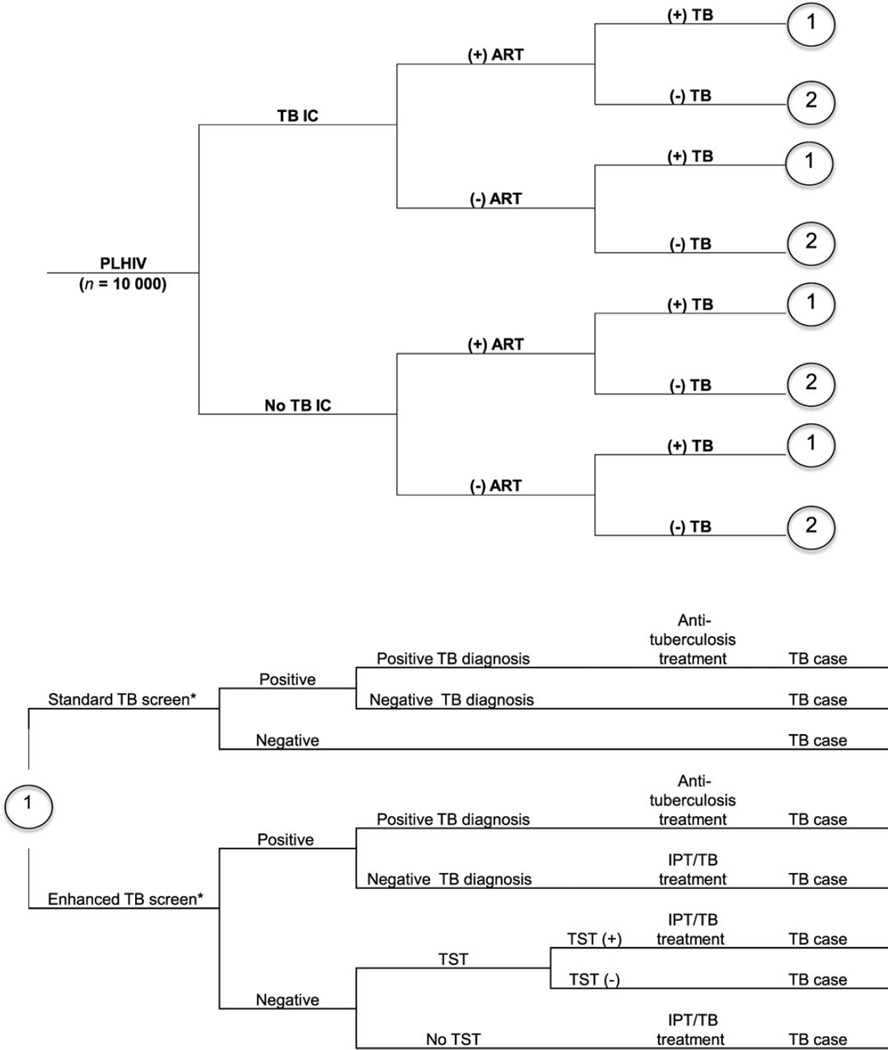
Objective: To evaluate the cost-effectiveness of the Three I's for HIV/TB (human immunodeficiency virus/tuberculosis): antiretroviral therapy (ART), intensified TB case finding (ICF), isoniazid preventive treatment (IPT), and TB infection control (IC).
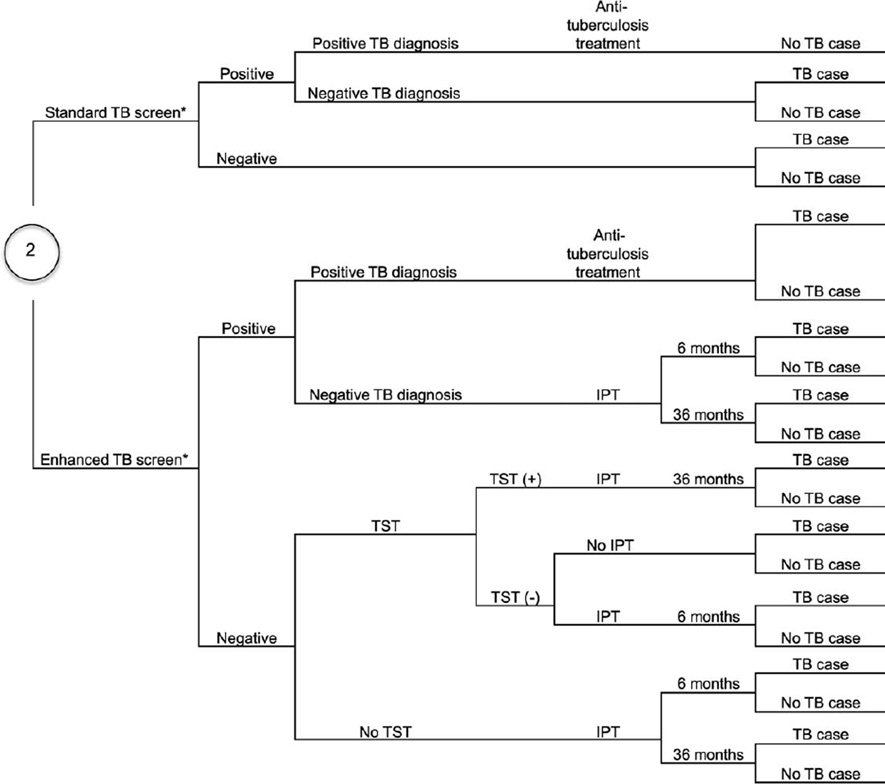
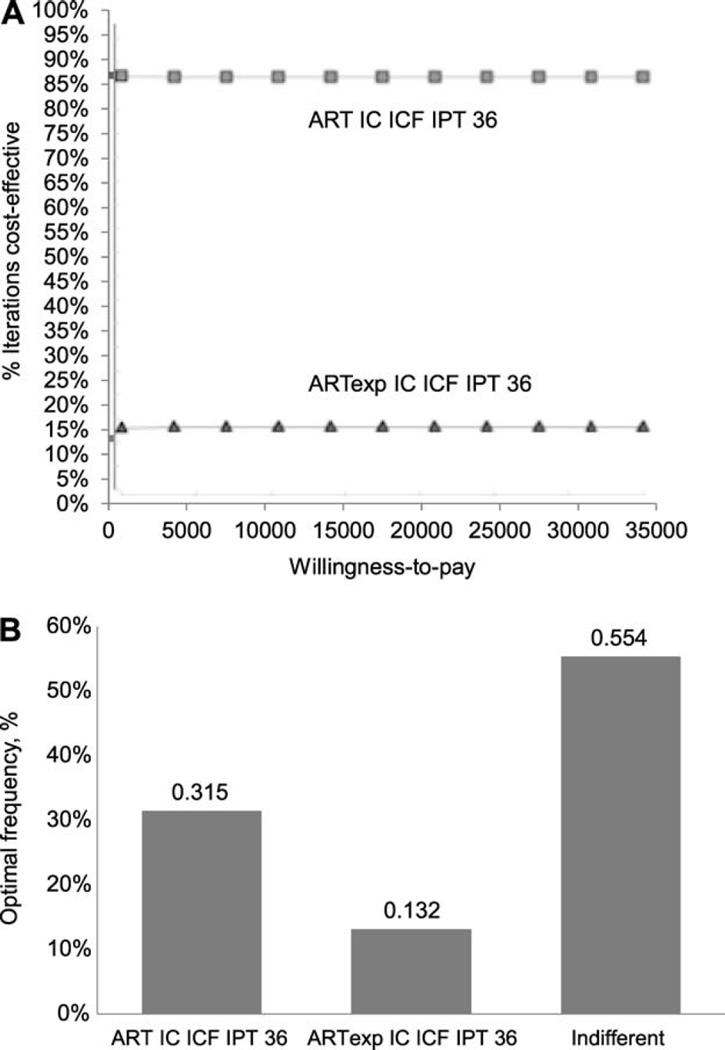
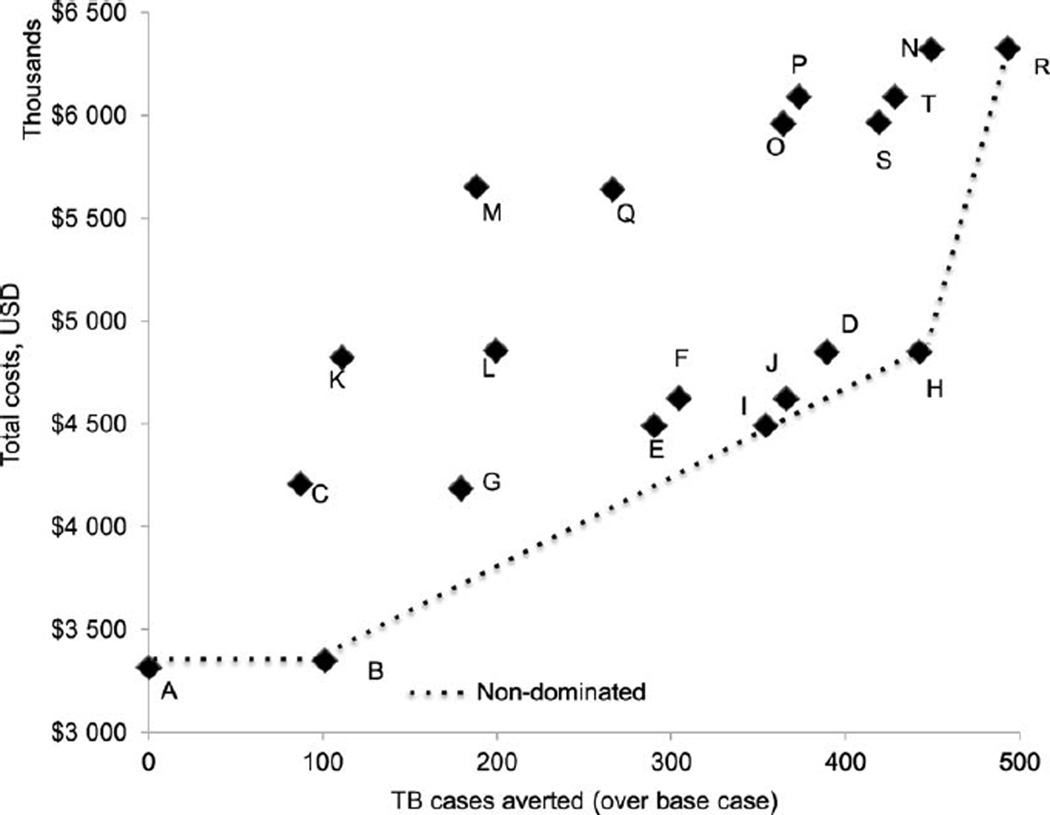
Methods: Using a 3-year decision-analytic model, we estimated the cost-effectiveness of a base scenario (55% ART coverage at CD4 count ⩿350 cells/mm(3)) and 19 strategies that included one or more of the following: 1) 90% ART coverage, 2) IC and 3) ICF using four-symptom screening and 6- or 36-month IPT. The TB diagnostic algorithm included 1) sputum smear microscopy with chest X-ray, and 2) Xpert® MTB/RIF.
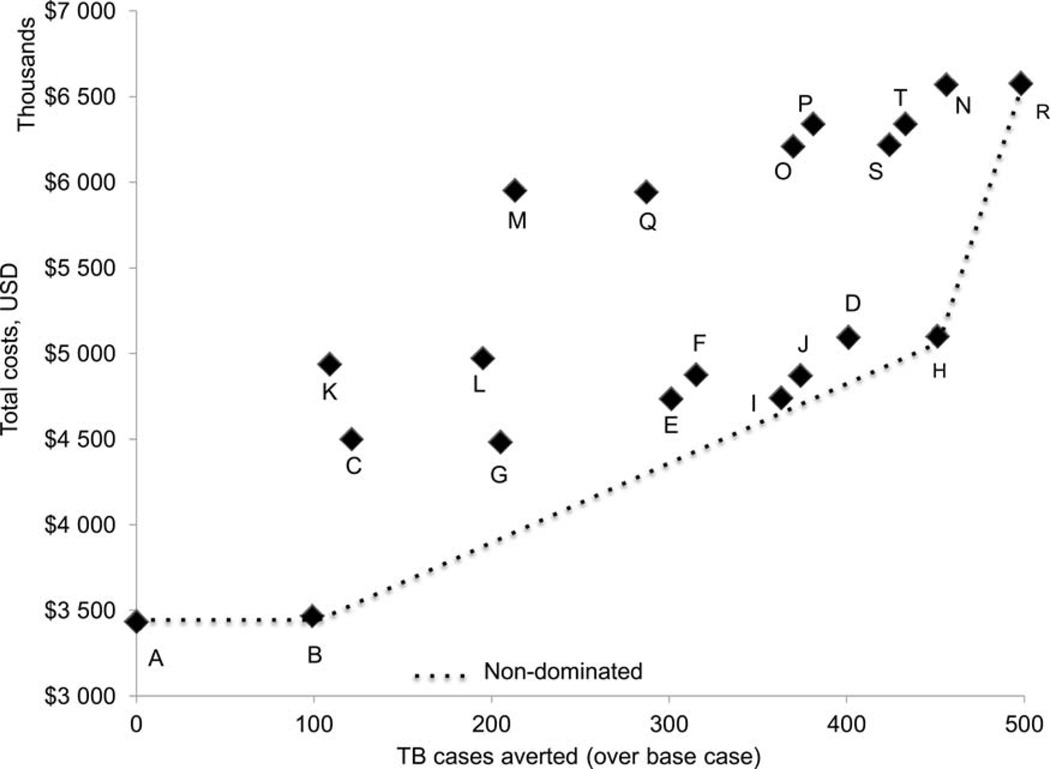
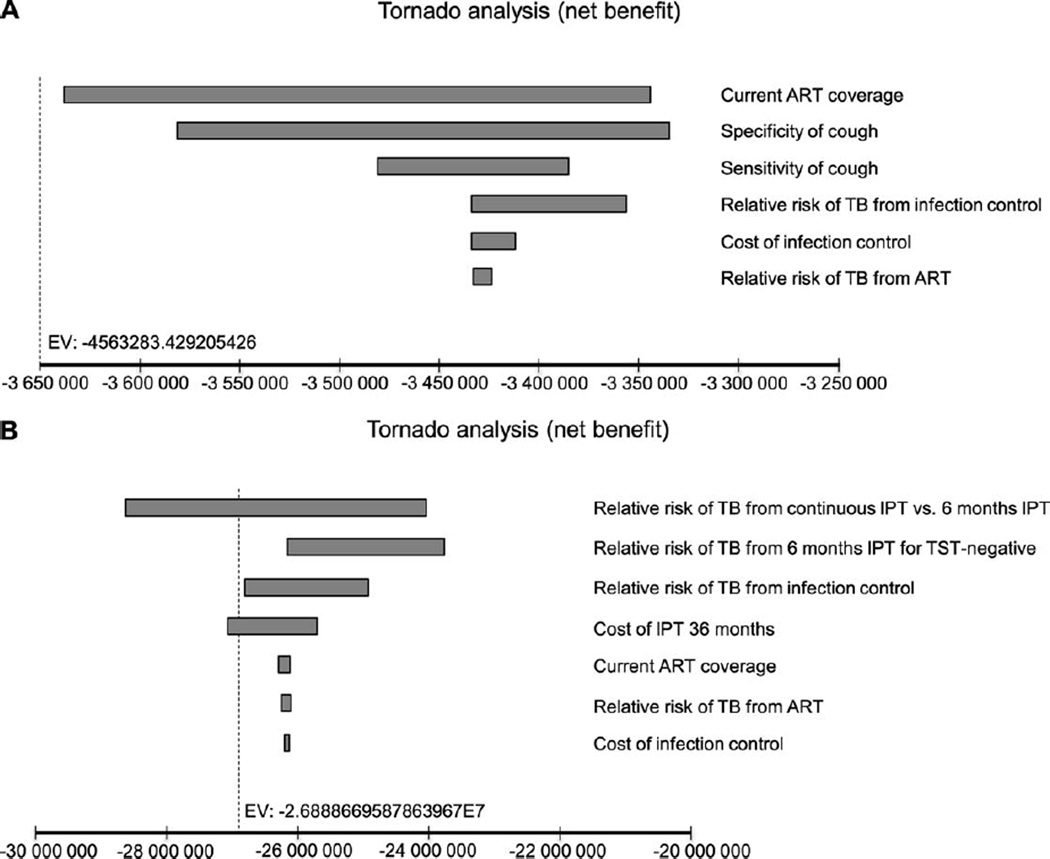
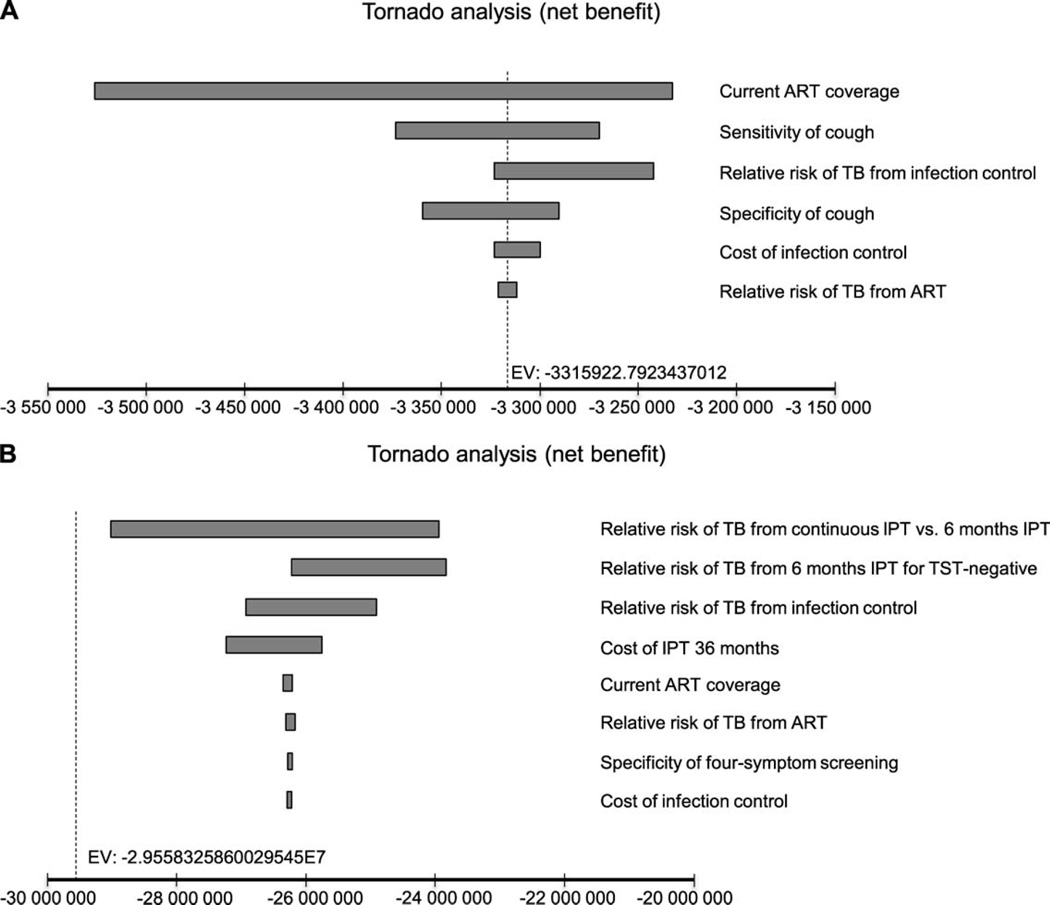
Results: In resource-constrained settings with a high burden of HIV and TB, the most cost-effective strategies under both diagnostic algorithms included 1) 55% ART coverage and IC, 2) 55% ART coverage, IC and 36-month IPT, and 3) expanded ART at 90% coverage with IC and 36-month IPT. The latter averted more TB cases than other scenarios with increased ART coverage, IC, 6-month IPT and/or IPT for tuberculin skin test positive individuals. The cost-effectiveness results did not change significantly under the sensitivity analyses.
Conclusion: Expanded ART to 90% coverage, IC and a 36-month IPT strategy averted most TB cases and is among the cost-effective strategies.
CONTEXTE: Nous évaluons le rapport coût-efficacité de l’approche des « 3 I » dans la lutte contre le virus de l’immunodéficience humaine (VIH) et la TB : traitement antirétroviral (ART) et intensification de la recherche de cas de TB (ICF), traitement préventif par isoniazide (IPT) et lutte contre l’infection tuberculeuse (IC).
MÉTHODES: Nous avons estimé, grâce à un modèle de décision analytique de 3 ans, le rapport coût-efficacité d’un scénario de base (55% de couverture du traitement ART quand la numération des CD4 est ≤350 cellules/mm3) et 19 stratégies qui incluaient une ou plusieurs des stratégies suivantes : 1) 90% de couverture par ART, 2) IC et 3) ICF grâce à un dépistage basé sur quatre symptômes et un IPT pendant 6 ou 36 mois. L’algorithme de diagnostic de la TB incluait 1) microscopie des frottis de crachats et radio pulmonaire et 2) Xpert® MTB/RIF.
RÉSULTATS: Dans les contextes ressources limitées confrontés à un lourd fardeau de VIH et de TB, les stratégies les plus rentables en termes d’algorithmes de diagnostic incluaient 1) 55% de couverture par ART et IC; 2) 55 % de couverture par ART, IC et 36 mois d’IPT; et 3) expansion de l’ART à une couverture de 90% avec IC et IPT de 36 mois. Cette dernière stratégie a évité davantage de cas de TB que les autres scénarios avec augmentation de la couverture par ART, IC, 6 mois d’IPT et/ou IPT pour les cas positifs au test cutané tuberculinique. Les résultats en termes de coût-efficacité n’ont pas changé significativement avec les analyses de sensibilité.
CONCLUSION: La stratégie d’expansion de la couverture par ART à 90%, IC et 36 mois d’IPT a évité le plus de cas de TB et elle est parmi les stratégies les plus rentables.
MARCO DE REFERENClA: Se llevó a cabo una evaluación de la rentabilidad de las intervenciones de prevención de la tuberculosis (TB), el tratamiento antirretrovírico (ART) y la estrategia de las ‘Tres íes’ (que comporta la intensificación de la búsqueda de casos [ICF] de coinfección por el virus de la inmunodeficiencia humana [VIH] y TB, el tratamiento preventive con isoniazida [IPT] y el control de la infección [IC] tuberculosa).
MÉTODOS: Se construyó unmodelo analítico decisional destinado a evaluar en una población positiva frente al VIH durante un período de 3 años, la rentabilidad de la prevención de la TB en un contexto hipotético de base (cobertura del 55% con el ART en pacientes con recuentos de linfocitos CD4 ≤350 células/µl) y en 19 estrategias comparativas que comportaban una o varias de las siguientes condiciones: 1) una cobertura del 90% con el ART, 2) medidas de IC tuberculosa y 3) la ICF mediante un sistema de detección por cuatro síntomas y el IPT durante 6 meses o 36 meses en los casos negatives. Se compararon todas las estrategias al usar dos algoritmos diagnósticos diferentes: 1) la baciloscopia del esputo con radiografía de tórax y 2) la prueba Xpert® MTB/RIF.
RESULTADOS: En los entornos con recursos limitados y una alta carga de morbilidad por TB e infección por el VIH, las estrategias más rentables con ambos algoritmos diagnósticos fueron: 1) una cobertura del 55% con el ART y las medidas de IC tuberculosa; 2) una cobertura del 55% con el ART y 36 meses de IPT; y 3) la ampliación de la cobertura con el ART al 90%, con medidas de IC tuberculosa y 36 meses de IPT. Esta última estrategia evitó más casos de TB que otras dos hipótesis con ampliación de la cobertura a 90%, IC y 6 meses de IPT o con tratamiento preventive en los casos de reacción tuberculínica positiva. Los resultados de rentabilidad no se modificaron de manera significativa en los análisis de sensibilidad.
CONCLUSION: La estrategia que comporta la ampliación de la cobertura con el ART a 90%, las medidas de IC tuberculosa y el IPT durante 36 meses evitó el mayor número de casos de TB y es rentable.
Conflict of interest statement
Conflict of interest: none declared.
Figures
Comment in
-
Africa--not lost but still sick. Implementing interventions to prevent HIV-associated tuberculosis.Int J Tuberc Lung Dis. 2014 Oct;18(10):1135-6. doi: 10.5588/ijtld.14.0583. Int J Tuberc Lung Dis. 2014. PMID: 25216823 No abstract available.
Similar articles
-
Implementation and Operational Research: Cost-Effectiveness of Antiretroviral Therapy and Isoniazid Prophylaxis to Reduce Tuberculosis and Death in People Living With HIV in Botswana.J Acquir Immune Defic Syndr. 2015 Nov 1;70(3):e84-93. doi: 10.1097/QAI.0000000000000783. J Acquir Immune Defic Syndr. 2015. PMID: 26258564 Free PMC article. Clinical Trial.
-
Implementation of Tuberculosis Intensive Case Finding, Isoniazid Preventive Therapy, and Infection Control ("Three I's") and HIV-Tuberculosis Service Integration in Lower Income Countries.PLoS One. 2016 Apr 13;11(4):e0153243. doi: 10.1371/journal.pone.0153243. eCollection 2016. PLoS One. 2016. PMID: 27073928 Free PMC article.
-
The cost of intensified case finding and isoniazid preventive therapy for HIV-infected patients in Battambang, Cambodia.Int J Tuberc Lung Dis. 2009 Jun;13(6):713-8. Int J Tuberc Lung Dis. 2009. PMID: 19460246
-
Review of policy and status of implementation of collaborative HIV-TB activities in 23 high-burden countries.Int J Tuberc Lung Dis. 2014 Oct;18(10):1149-58. doi: 10.5588/ijtld.13.0889. Int J Tuberc Lung Dis. 2014. PMID: 25216827 Review.
-
New vaccines for the prevention of tuberculosis in human immunodeficiency virus infection.Int J Tuberc Lung Dis. 2012 Jun;16(6):718-23. doi: 10.5588/ijtld.11.0444. Epub 2012 Apr 9. Int J Tuberc Lung Dis. 2012. PMID: 22507085 Review.
Cited by
-
Economic and modeling evidence for tuberculosis preventive therapy among people living with HIV: A systematic review and meta-analysis.PLoS Med. 2021 Sep 14;18(9):e1003712. doi: 10.1371/journal.pmed.1003712. eCollection 2021 Sep. PLoS Med. 2021. PMID: 34520463 Free PMC article.
-
Cost-Effectiveness of isoniazid preventive therapy among HIV-infected patients clinicaly screened for latent tuberculosis infection in Dar es Salaam, Tanzania: A prospective Cohort study.BMC Public Health. 2017 Jul 19;18(1):35. doi: 10.1186/s12889-017-4597-9. BMC Public Health. 2017. PMID: 28724374 Free PMC article.
-
Cost-Effectiveness of Community-Based TB/HIV Screening and Linkage to Care in Rural South Africa.PLoS One. 2016 Dec 1;11(12):e0165614. doi: 10.1371/journal.pone.0165614. eCollection 2016. PLoS One. 2016. PMID: 27906986 Free PMC article.
-
Prevalence, Conversion and Reversion of Tuberculosis Infection Among Healthcare Workers of Tertiary Care Centres in Puducherry, India: A Prospective Cohort Study.Trop Med Infect Dis. 2025 May 20;10(5):141. doi: 10.3390/tropicalmed10050141. Trop Med Infect Dis. 2025. PMID: 40423370 Free PMC article.
-
Tuberculosis infection control practices in a high-burden metro in South Africa: A perpetual bane for efficient primary health care service delivery.Afr J Prim Health Care Fam Med. 2018 May 30;10(1):e1-e6. doi: 10.4102/phcfm.v10i1.1628. Afr J Prim Health Care Fam Med. 2018. PMID: 29943601 Free PMC article.
References
-
- World Health Organization. Global tuberculosis report, 2013. WHG7HTM/TB/2013.11. Geneva, Switzerland: WHO; 2013. [Accessed June 2014]. http://apps.who.int/iris/bitstream/10665/91355/1/9789241564656_eng.pdf.
-
- Joint United Nations Programme on HIV/AIDS. UNAIDS report on the global AIDS epidemic 2013. UNAIDS/JC2502/1/E. Geneva, Switzerland: UNAIDS; 2013. 2013. [Accessed June 2014]. http://www.unaids.org/en/media/unaids/contentassets/documents/epidemiolo....
-
- World Health Organization. Policy on collaborative TB/HIV activities: guidelines for national programmes and other stakeholders. WHO/HTM/TB/2012.1. WHO/HIV/2012.1. Geneva, Switzerland: WHO; 2012. [Accessed June 2014]. http://whqlibdoc.who.int/publications/2012/9789241503006_eng.pdf. - PubMed
MeSH terms
Substances
Grants and funding
LinkOut - more resources
Full Text Sources
Other Literature Sources
Medical
Research Materials
