. 2014 Dec;24(12):2050-8.
doi: 10.1101/gr.176214.114. Epub 2014 Sep 12.

A formal perturbation equation between genotype and phenotype determines the Evolutionary Action of protein-coding variations on fitness

Affiliations

A formal perturbation equation between genotype and phenotype determines the Evolutionary Action of protein-coding variations on fitness

Panagiotis Katsonis et al. Genome Res. 2014 Dec.

Abstract

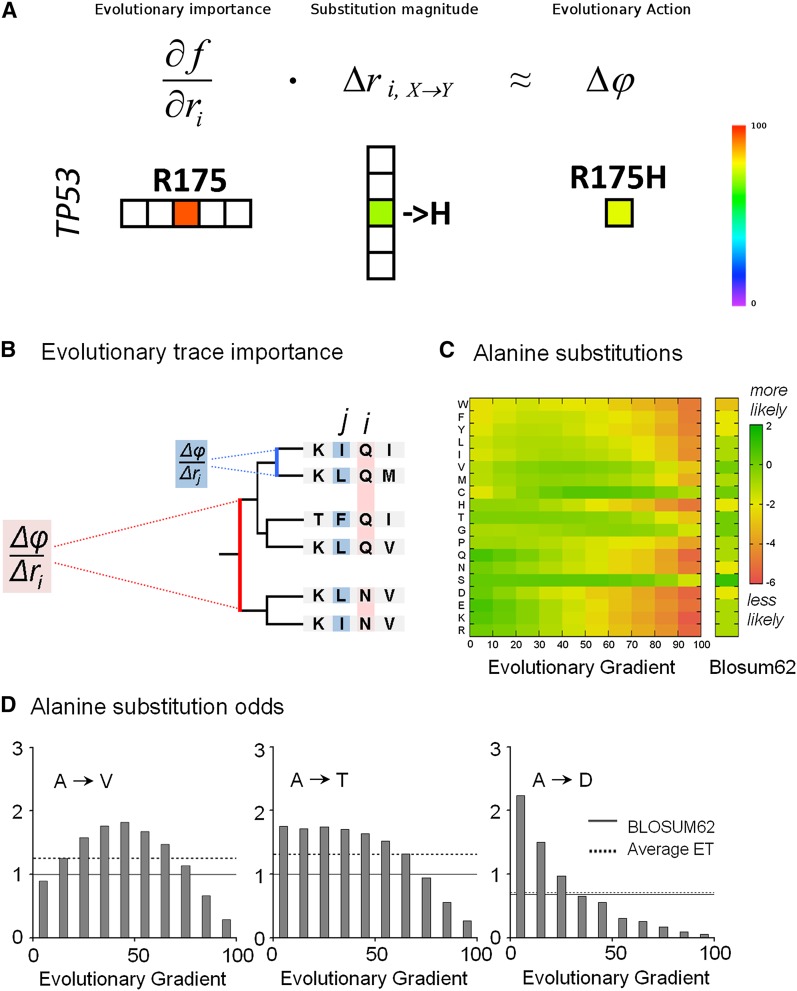
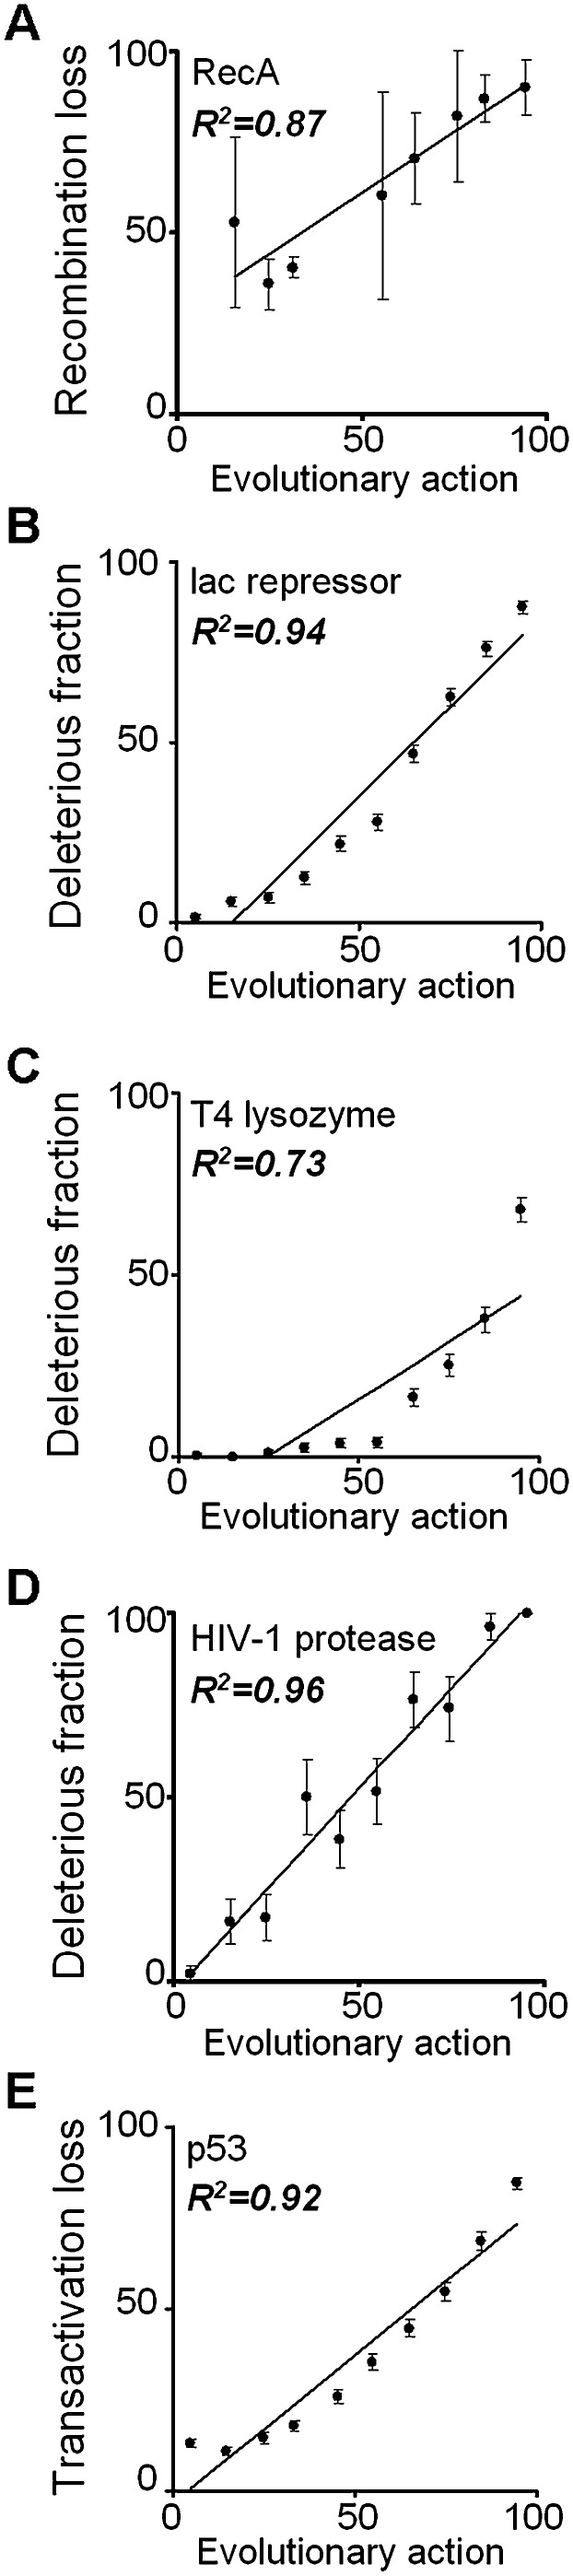
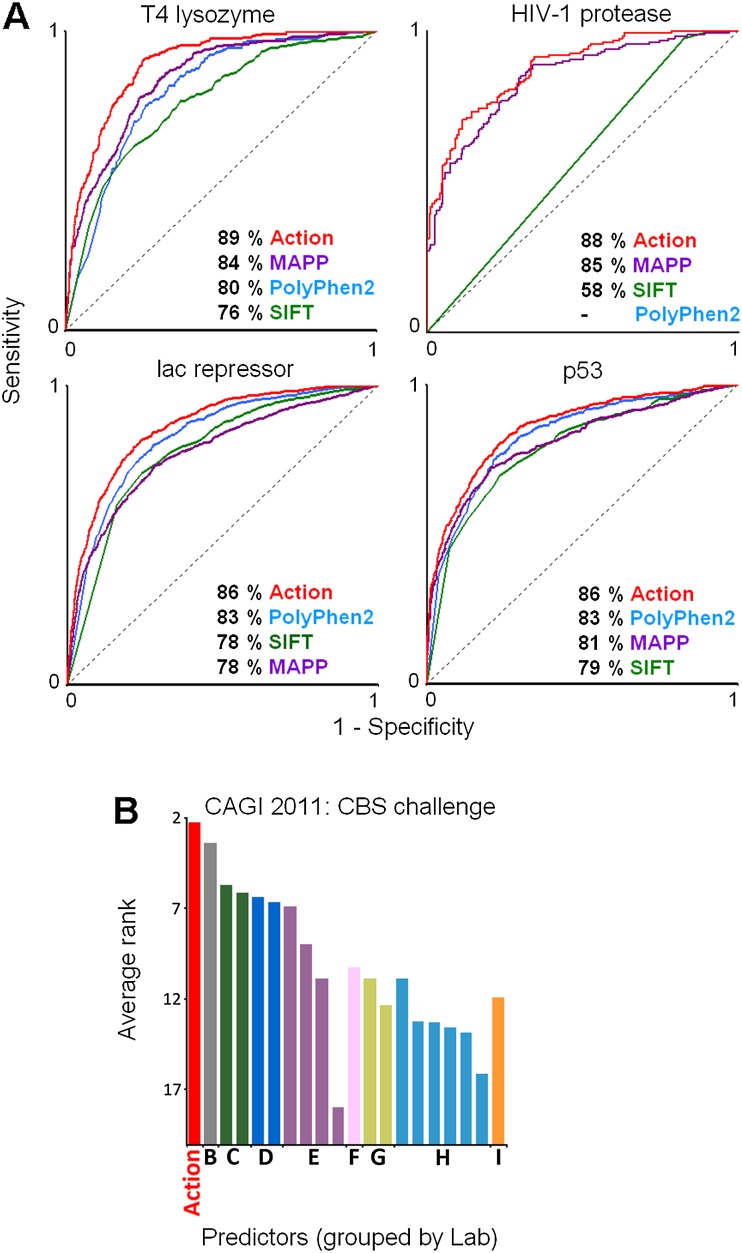
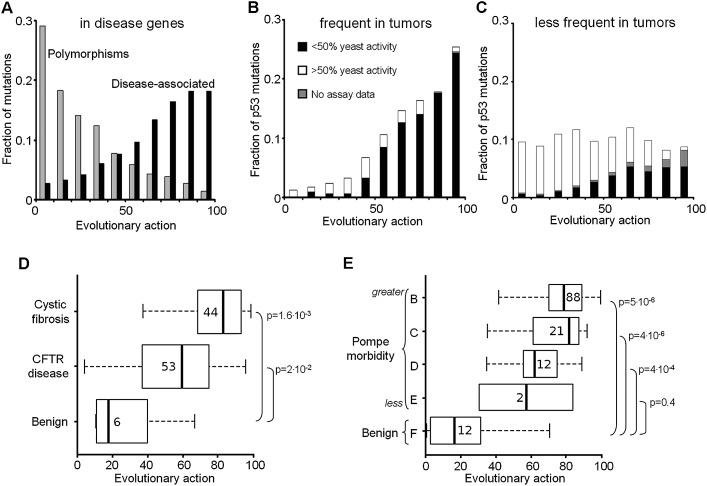
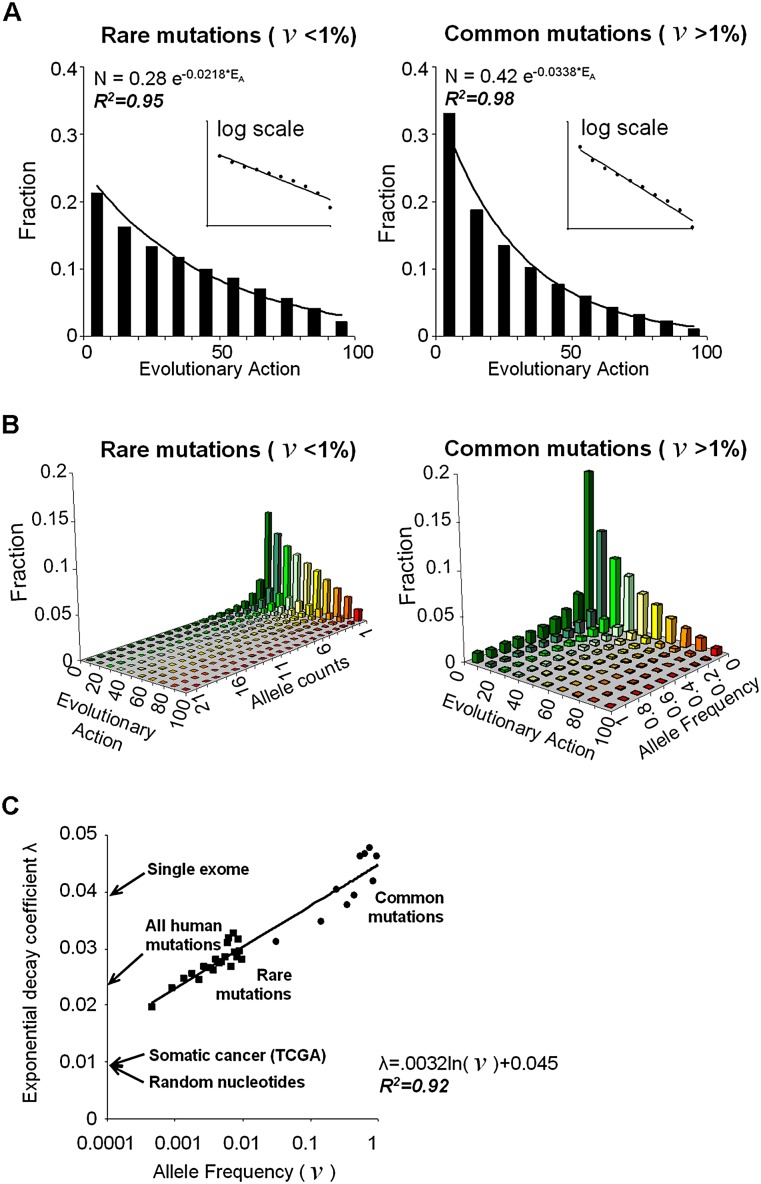
The relationship between genotype mutations and phenotype variations determines health in the short term and evolution over the long term, and it hinges on the action of mutations on fitness. A fundamental difficulty in determining this action, however, is that it depends on the unique context of each mutation, which is complex and often cryptic. As a result, the effect of most genome variations on molecular function and overall fitness remains unknown and stands apart from population genetics theories linking fitness effect to polymorphism frequency. Here, we hypothesize that evolution is a continuous and differentiable physical process coupling genotype to phenotype. This leads to a formal equation for the action of coding mutations on fitness that can be interpreted as a product of the evolutionary importance of the mutated site with the difference in amino acid similarity. Approximations for these terms are readily computable from phylogenetic sequence analysis, and we show mutational, clinical, and population genetic evidence that this action equation predicts the effect of point mutations in vivo and in vitro in diverse proteins, correlates disease-causing gene mutations with morbidity, and determines the frequency of human coding polymorphisms, respectively. Thus, elementary calculus and phylogenetics can be integrated into a perturbation analysis of the evolutionary relationship between genotype and phenotype that quantitatively links point mutations to function and fitness and that opens a new analytic framework for equations of biology. In practice, this work explicitly bridges molecular evolution with population genetics with applications from protein redesign to the clinical assessment of human genetic variations.


Figures

Figure 1.
Figure 1.
Computation of the Evolutionary Action equation. (A) An illustration of computing the Evolutionary Action of a mutation, such as the R175H in the TP53 gene, from the evolutionary importance of the residue R175 and the arginine-to-histidine substitution magnitude at that position. (B) A sequence alignment and the associated evolutionary tree show that the evolutionary fitness gradient of a protein residue, which is defined as the phenotypic fitness change due to an elementary genotypic change, will be larger (in red), or smaller (in blue), depending on the phylogenetic distance between evolutionary branches that differ at that position. Since the Evolutionary Trace ranks the functional importance of sequence positions by correlating residue variations with phylogenetic branching (Lichtarge et al. 1996; Mihalek et al. 2004), we can estimate the evolutionary fitness gradient with ET. (C) A color matrix, computed from nearly 67,000 protein sequence alignments, displays the relative substitution odds from alanine to any other amino acids (in single-letter code) depending on the evolutionary gradient decile at the mutation site (most likely substitutions are green, least likely ones are in red), and compared to the standard BLOSUM62. (D) The gradient-specific (gray bars), the nonspecific (dashed lines), and the BLOSUM62 (solid lines) substitution odds are illustrated for alanine substitutions to valine (V), threonine (T), and aspartate (D). The code is (A) alanine, (W) tryptophan, (F) phenylalanine, (Y) tyrosine, (L) leucine, (I) isoleucine, (V) valine, (M) methionine, (C) cysteine, (H) histidine, (T) threonine, (G) glycine, (P) proline, (Q) glutamine, (N) asparagine, (S) serine, (D) aspartic acid, (E) glutamic acid, (K) lysine, (R) arginine.
Figure 2.
Figure 2.
Mutational action correlates with experimental impact. Each panel shows along the x-axis the action predicted from Equation (2) and along the y-axis the fractional activity or fitness measured experimentally as (A) the average loss of recombination activity in 31 point mutants of E. coli RecA protein; (B) the nonfunctional fraction of 4041 point mutants in E. coli lac repressor in a β-galactosidase repression assay (Markiewicz et al. 1994); (C) the nonfunctional fraction of 2015 point mutants in bacteriophage T4 lysozyme in a plaque formation assay (Rennell et al. 1991); (D) the nonfunctional fraction of 336 HIV-1 protease point mutants in substrate cleavage (Loeb et al. 1989); and (E) the average transactivation activity of 2314 human TP53 point mutants assayed in yeast over eight response-elements (Petitjean et al. 2007). The data are binned into action deciles, the R2 values indicate Pearson product-moment correlation coefficients following linear fitting, and the standard error of the mean is shown with error bars.
Figure 3.
Figure 3.
The performance of the Evolutionary Action method was compared to state-of-the-art methods. (A) The area under the receiver operating characteristic curve (AUC) of the relative sensitivity and specificity to separate harmful from harmless mutations for the Evolutionary Action, PolyPhen-2, SIFT, and MAPP was calculated for each of the data sets: 2015 bacteriophage T4 lysozyme mutants to break the host cell walls; 4041 E. coli lac repressor mutants to repress β-galactosidase more than 20-fold; 336 HIV-1 protease mutants to cleave the Gag and Gag-Pol precursor proteins (PolyPhen-2 returned no predictions for the HIV-1 protease mutations); and 2314 human TP53 mutants to transactivate eight TP53 response-elements in yeast. (B) The average rank of current methods (bars), from different groups (letters), to predict the activity of cystathionine beta-synthase (CBS) mutants was assessed by the Critical Assessment of Genome Interpretation (CAGI) of 2011. The CBS activity was assayed for the ability of each mutant to restore growth in yeast cells lacking the normal CYS4 ortholog under two different growth conditions (high and low concentrations of pyridoxine cofactor) (Mayfield et al. 2012). Twenty methods from nine groups were assessed over nine criteria (precision, recall, accuracy, harmonic mean f1, Spearman’s rank correlation coefficient, Student’s t-test P-value, root mean square deviation [RMSD], RMSD over Z-scores, and the AUC) for each cofactor concentration, and then their rank was averaged. Evolutionary Action is shown in red, and a taller bar is a better rank. Raw data and assessment details are available at the CAGI website (https://genomeinterpretation.org/) and from the CAGI organizers Susanna Repo, John Moult, and Steven E. Brenner. The Evolutionary Action analysis files are available at http://mammoth.bcm.tmc.edu/KatsonisLichtargeGR.
Figure 4.
Figure 4.
Mutational action correlates with morbidity. (A) The action distributions of coding polymorphisms from 218 genes for the 8553 cases that are disease-associated (in black) compared to the 794 that are benign (in gray). Each of these genes, obtained from the UniProt database, is linked to at least one disease. (B) The action distribution of 343 somatic TP53 mutations found frequently in tumor samples (at least ten times in 26,597 cases tallied in the IARC database), compared to (C) the remaining 1026 sporadic TP53 mutations. The fraction with less (more) than 50% of the wild-type transactivation activity in yeast assays is black (white), and those for which these data are unknown is gray. (D) The action distribution of 103 mutations in the CFTR gene binned by the severity of clinical presentation: full-blown cystic fibrosis (top), CFTR-related disorders (middle), and no symptoms (bottom) (Dorfman et al. 2010). Vertical bars indicate median action; numbers refer to the total mutations in each group; box sizes match the quartiles of the distributions, and the error bars indicate the spread of variation. (E) The action distribution of 135 Pompe disease mutations in the GAA gene binned into decreasing severity classes from Class B, the most severe, to Class F, which contains the asymptomatic patients.
Figure 5.
Figure 5.
Nearly exponential action distributions of human coding polymorphisms. (A) Coding polymorphisms from the 1000 Genomes Project (including 1092 individuals) were separated into 225,751 rare variants (left) and 36,354 common mutations (right), based on an allele frequency (ν) threshold of 1%. Both groups fit exponential distributions with Pearson coefficients R2 of 0.95 and 0.98 and decay rates of 2.18 × 10⁻² and 3.38 × 10⁻², respectively, when binned into action deciles. The insets show equivalent log-linear plots. (B) These groups were further fractionated by allele count or frequency. The action distribution of polymorphisms in the same tranche of allele count, or frequency, also fit an exponential with R2 values from 0.87 to 0.99. The colors represent different Evolutionary Action (green for low and red for high). (C) The action decay rate for these exponentials varies linearly with the logarithm of their allele frequency (R2 value of 0.92). Arrows indicate the observed decay rates for all nonsynonymous coding mutations from a single individual’s exome; for the rare and the common mutations of the 1000 Genomes Project; for somatic cancer mutations retrieved from TCGA (http://tcga-data.nci.nih.gov); and for nonsynonymous mutations obtained by the translation of random nucleotide changes following the standard genetic code (random nucleotides).

Similar articles

Cited by

References

    1. The 1000 Genomes Project Consortium 2012. An integrated map of genetic variation from 1,092 human genomes. Nature 491: 56–65. - PMC - PubMed
    1. Adikesavan AK, Katsonis P, Marciano DC, Lua R, Herman C, Lichtarge O. 2011. Separation of recombination and SOS response in Escherichia coli RecA suggests LexA interaction sites. PLoS Genet 7: e1002244. - PMC - PubMed
    1. Adzhubei I, Schmidt S, Peshkin L, Ramensky V, Gerasimova A, Bork P, Kondrashov A, Sunyaev S. 2010. A method and server for predicting damaging missense mutations. Nat Methods 7: 248–249. - PMC - PubMed
    1. Amin S, Erdin S, Ward R, Lua R, Lichtarge O. 2013. Prediction and experimental validation of enzyme substrate specificity in protein structures. Proc Natl Acad Sci 110: 45. - PMC - PubMed
    1. Bodmer W, Bonilla C. 2008. Common and rare variants in multifactorial susceptibility to common diseases. Nat Genet 40: 695–701. - PMC - PubMed

Publication types