. 2015 Apr;22(4):484-94.
doi: 10.1177/1933719114549851. Epub 2014 Sep 11.

Expression and subcellular localization of metastasis-associated protein 1, its short form, and estrogen receptors in rat placenta

Affiliations

Expression and subcellular localization of metastasis-associated protein 1, its short form, and estrogen receptors in rat placenta

Maie Dawoud Al-Bader et al. Reprod Sci. 2015 Apr.

Abstract

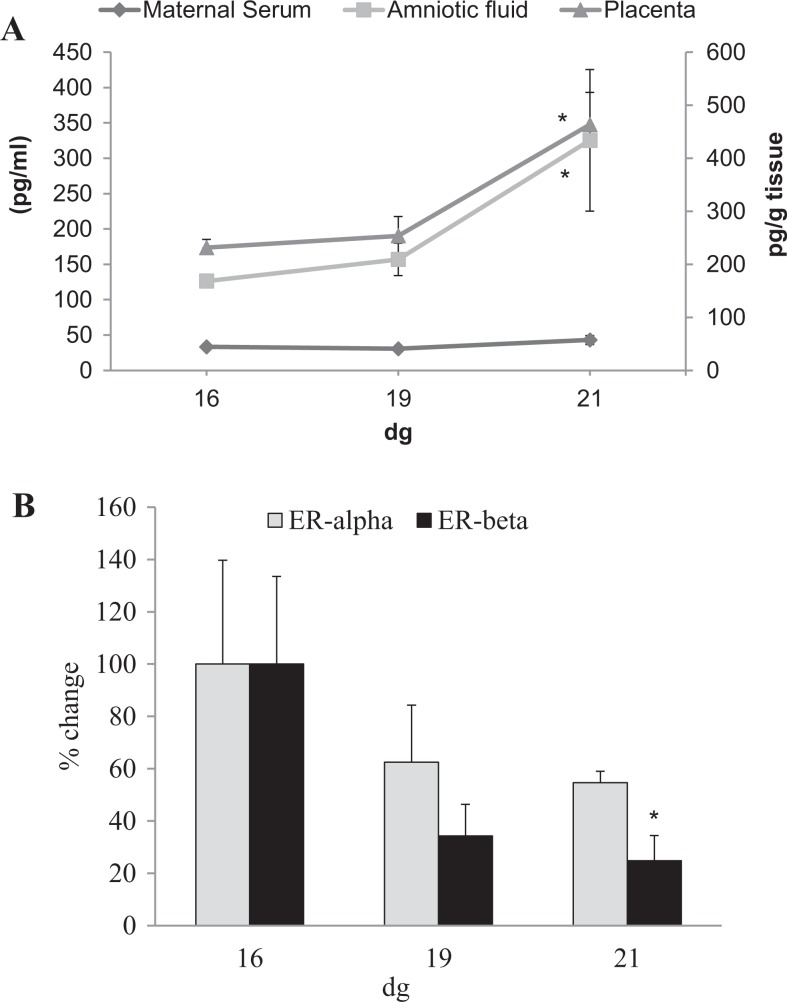
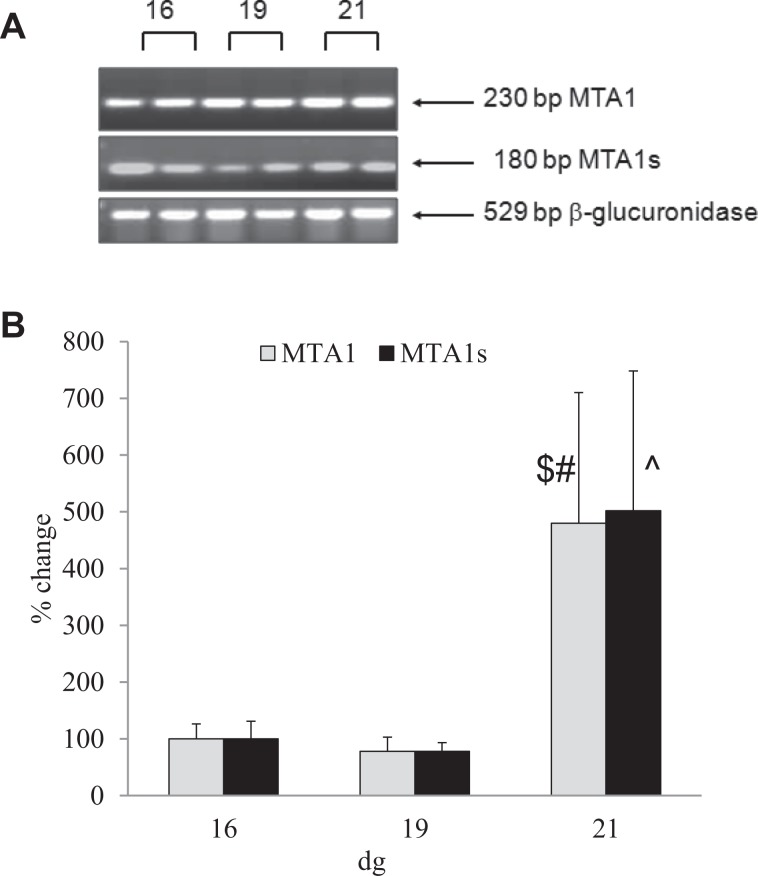
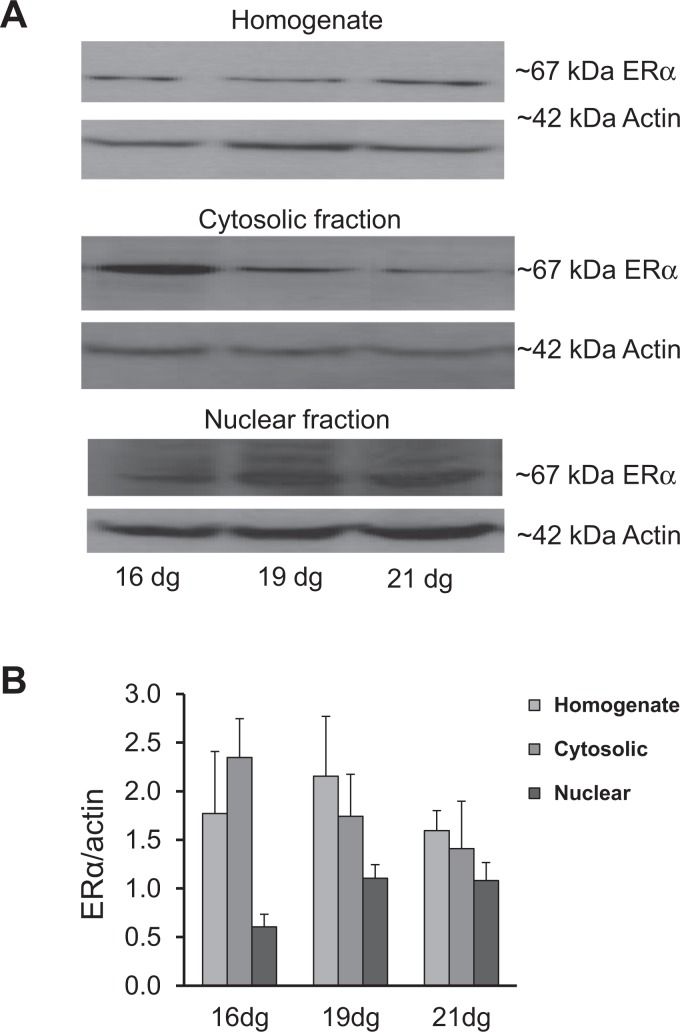
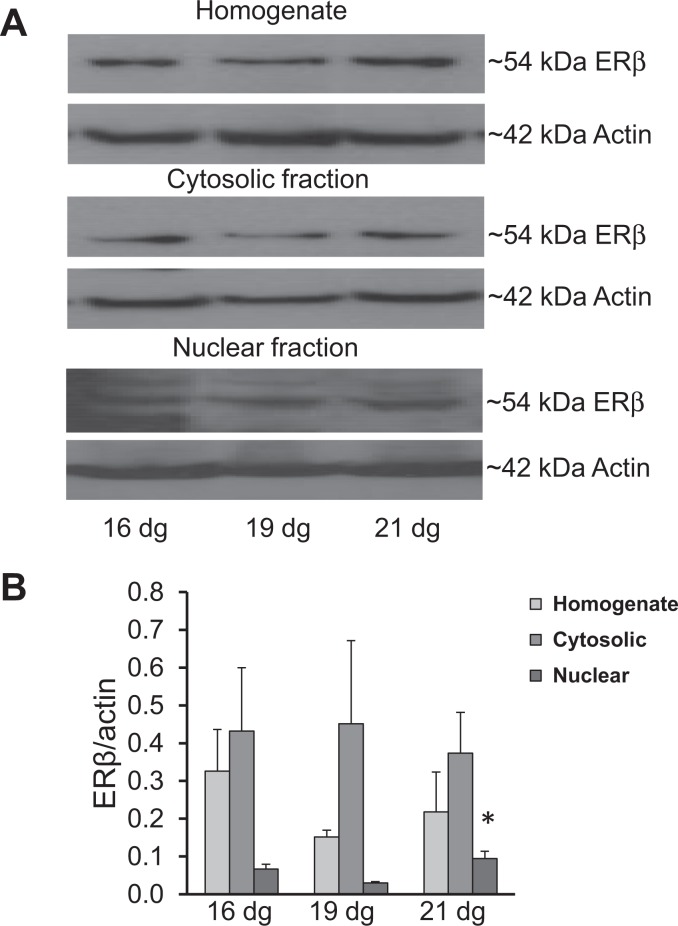
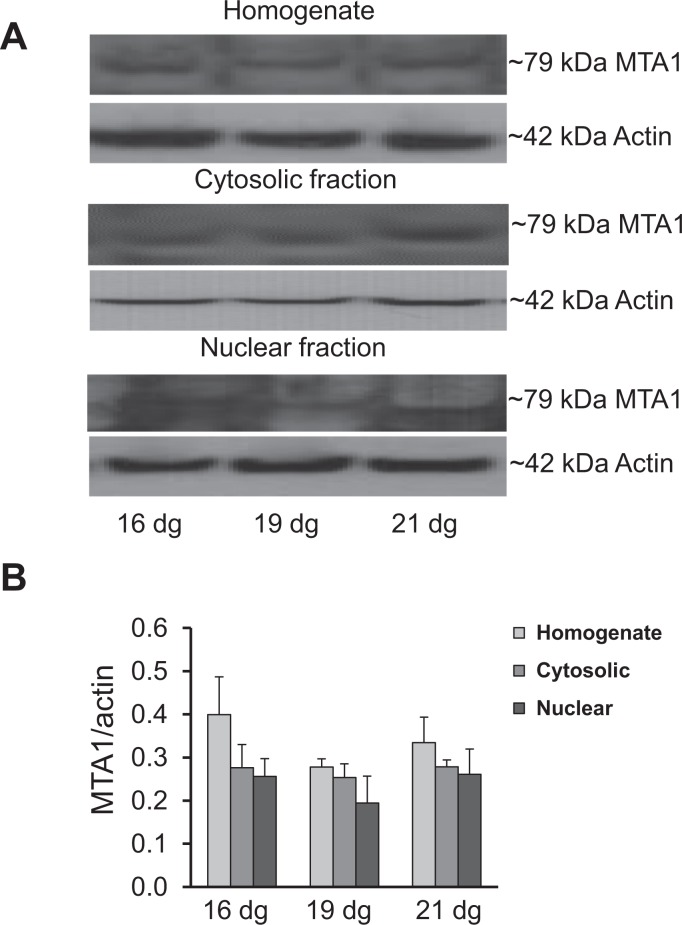
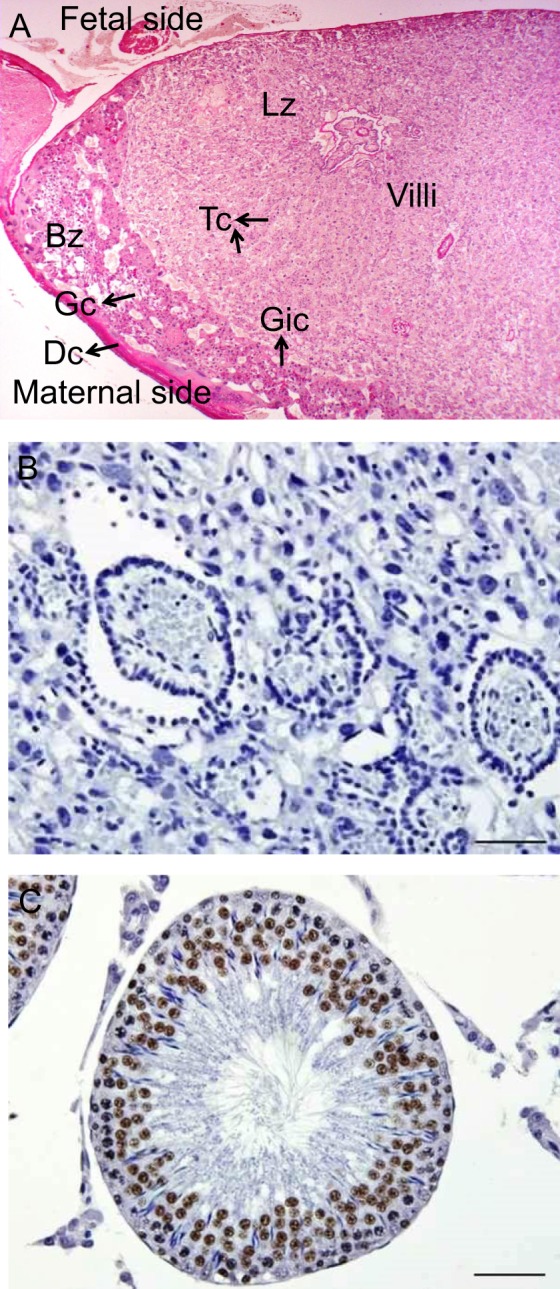
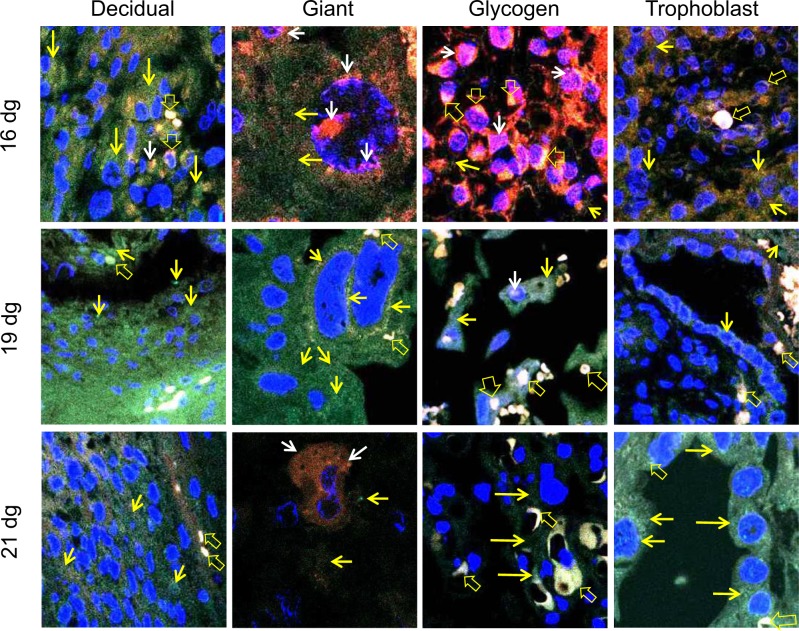
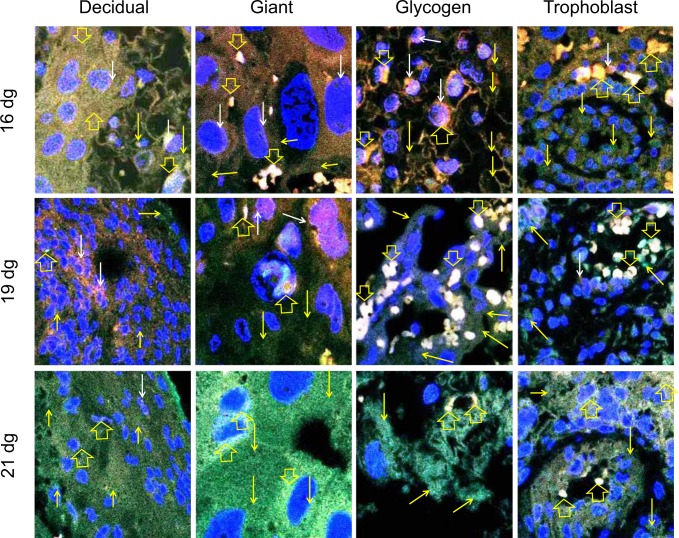
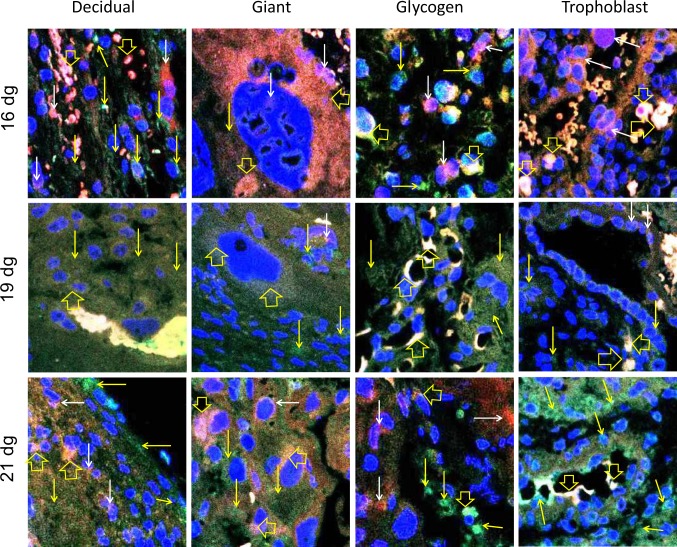
Metastasis-associated protein 1 (MTA1) and its short form (MTA1s) regulate the function of estrogen receptors (ERs). Estrogens, via ERs, affect placental growth and fetal development, a process that may involve MTA1 signaling. Expression of MTA1, MTA1s, ERα, and ERβ genes and proteins in rat placentas was studied on 16, 19, and 21 days of gestation (dg). The ERβ messenger RNA decreased significantly toward the end of gestation, whereas its protein level increased in the nuclear fraction on 21 dg. Both MTA1 and MTA1s increased with gestation. Decidual, trophoblast giant, glycogen, and villous trophoblast cells expressed MTA1, ERα, and ERβ proteins on all dg with colocalization of MTA1 with ERα and ERβ in the nucleus and cytoplasm. Expression of MTA1 suggests a possible role in regulating placental functions; considering the repressive function of MTA1 on ERs, the expression of MTA1 suggests that placental cells may be less sensitive to estrogens during late pregnancy.

Keywords: MTA1; estrogen receptor alpha; estrogen receptor beta; estrogens; placental growth.


Conflict of interest statement

Declaration of Conflicting Interests: The author(s) declared no potential conflicts of interest with respect to the research, authorship, and/or publication of this article.

Figures

Figure 1.
Figure 1.
Estradiol levels and estrogen receptor (ER) transcript expression in rat placentas. A, Estradiol levels in maternal serum did not show any significant changes; however, in amniotic fluid and placentas, the hormone levels increased on 21 dg compared to that on 16 dg (*P < .05). B, Percentage change in ERα and ERβ messenger RNA (mRNA) expression on 19 dg and 21 dg after normalization with the expression on 16 dg, for each gene, respectively. No significant differences between the three dgs were observed for ERα mRNA. A significant percentage change in mRNA expression of ERβ was detected on 21 dg when normalized to the expression on 16 dg (*P < .05). Note that real-time PCR (ReT-PCR) for both the genes was conducted separately. Samples were run in duplicates; data are mean ± standard error of the mean (n = 4/group).
Figure 2.
Figure 2.
The expression of metastasis-associated protein 1 (MTA1) and MTA1s transcripts in rat placentas. A, Ethidium bromide-labeled gel for MTA1, MTA1s, and β glucuronidase (internal control) following real-time PCR (ReT-PCR). MTA1 and MTA1s were detected from 16 dg. Both negative controls (RT-) and water samples were negative (data not shown). B, A significant increase in expression of MTA1 mRNA was detected between 16 dg and 21 dg and 19 dg and 21 dg ($P < .001 and #P < .01, respectively). Expression of MTA1s increased between 19 dg and 21 dg (^P < .05). Samples were run in duplicates; data are mean ± standard error of the mean (n = 4/group).
Figure 3.
Figure 3.
Protein expression of estrogen receptor α (ERα) in the homogenate, cytosolic, and nuclear fractions of placentas. A, Representative Western blots for ERα and β actin. B, No significant change was detected among different groups on different dg; however, there was a decreasing trend in the homogenate and cytosolic fractions and an increasing trend in the nuclear fractions at 21 dg. Samples were run in duplicates; data are mean ± standard error of the mean (n = 4/group).
Figure 4.
Figure 4.
Protein expression of estrogen receptor β (ERβ) in the homogenate, cytosolic, and nuclear fractions of placentas. A, Representative Western blots for ERβ and β actin. B, No significant change was detected in expression of ERβ in the homogenate and cytosolic fractions on all dg; however, there was an increase in the expression in the nuclear fraction on 21 dg compared to that on 19 dg (*P < .05). Samples were run in duplicates; data are mean ± standard error of the mean (n = 4/group).
Figure 5.
Figure 5.
Expression of metastasis-associated protein 1 (MTA1) in the homogenate, cytosolic, and nuclear fractions of placentas. A, Representative Western blots for MTA1 and β actin. B, No significant change was detected in the homogenate, cytosolic, and nuclear fractions among different groups on all dg. Samples were run in duplicates; data are mean ± standard error of the mean (n = 4/group).
Figure 6.
Figure 6.
Structural organization of a rat placenta and negative and positive controls. A, A low-magnification photomicrograph of the placenta stained with Periodic acid-Schiff reaction showing basal (Bz) and labyrinth (Lz) zones. The location of decidual (Dc), glycogen (Gc), giant (Gic), and trophoblast (Tc) cells and villi are indicated, 40×. B, A negative control (without primary antibody) used simultaneously with confocal microscopy but stained for light microscopy showing no background labeling, 400×. C, Rat testis was used as a positive control for MTA1 showing labeled germ cells, 400×. Both negative and positive controls were counterstained with Mayer hematoxylin.
Figure 7.
Figure 7.
Colocalization of estrogen receptor (ER) α (TRITC) and ERβ (FITC) in placental cells. Confocal images showing expression of the ERs in different cells of the placenta. The nuclei are labeled with 4′,6-diamidino-2-phenylindole (DAPI; blue). Expression of ERα (red staining indicated by white arrows) and ERβ (green staining indicated by yellow arrows) is shown. Yellow to white labeling observed is due to colocalization of the proteins (mixture of green and red to variable degrees due to merging of images) and is indicated by open yellow arrows. These pictures show that ERα and ERβ are coexpressed in the cytoplasm and nucleus of decidual, glycogen, giant, and trophoblast cells on 16 dg, 19 dg, and 21 dg. Original magnification, 400×. (The color version of this article is available at http://rs.sagepub.com.)
Figure 8.
Figure 8.
Merged confocal images indicating colocalization of estrogen receptor (ER) α (TRITC) and metastasis-associated protein 1 (MTA1; FITC) in placental cells. The nuclei are labeled with 4′,6-diamidino-2-phenylindole (DAPI; blue). Expression of ERα (red staining indicated by white arrows) and MTA1 (green staining indicated by yellow arrows) is shown. Yellow to white labeling is due to colocalization of the proteins (mixture of green and red to variable degrees due to merging of images) and is indicated by open yellow arrows. These photomicrographs show that ERα and MTA1 are coexpressed in the cytoplasm and nucleus of decidual, glycogen, giant, and trophoblast cells on 16 dg, 19 dg, and 21 dg. Original magnification, 400×. (The color version of this article is available at http://rs.sagepub.com.)
Figure 9.
Figure 9.
Merged confocal images indicating colocalization of estrogen receptor (ER) β (red, TRITC) and metastasis-associated protein 1 (MTA1; green, FITC) in placental cells. The nuclei are labeled with 4′,6-diamidino-2-phenylindole (DAPI; blue). Expression of ERβ (red staining indicated by white arrows) and MTA1 (green staining indicated by yellow arrows) is shown. Yellow to white labeling is due to colocalization of the proteins (mixture of green and red to variable degrees due to merging of images) and is indicated by open yellow arrows. These photomicrographs show that ERβ and MTA1 are coexpressed in the cytoplasm and nucleus of decidual, glycogen, giant, and trophoblast cells on 16 dg, 19 dg, and 21 dg. Original magnification, 400×. (The color version of this article is available at http://rs.sagepub.com.)

Similar articles

Cited by

References

    1. Furukawa S, Hayashi S, Usuda K, Abe M, Hagio S, Ogawa I. Toxicological pathology in the rat placenta. J Toxicol Pathol. 2011;24 (2):95–111. - PMC - PubMed
    1. Fonseca BM, Correia-da-Silva G, Teixeira NA. The rat as an animal model for fetoplacental development: a reappraisal of the post-implantation period. Reprod Biol. 2012;12 (2):97–118. - PubMed
    1. Bartholomeusz RK, Bruce NW, Lynch AM. Embryo survival, and fetal and placental growth following elevation of maternal estradiol blood concentrations in the rat. Biol Reprod. 1999;61 (1):46–50. - PubMed
    1. Manavathi B, Kumar R. Steering estrogen signals from the plasma membrane to the nucleus: two sides of the coin. J Cell Physiol. 2006;207 (3):594–604. - PubMed
    1. Al-Bader M. Estrogen receptors alpha and beta in rat placenta: detection by RT-PCR, real time PCR and Western blotting. Reprod Biol Endocrinol. 2006;4:13. - PMC - PubMed

Publication types