Impact of hypocapnia and cerebral perfusion on orthostatic tolerance
- PMID: 25217373
- PMCID: PMC4262334
- DOI: 10.1113/jphysiol.2014.280586
Impact of hypocapnia and cerebral perfusion on orthostatic tolerance
Abstract
We examined two novel hypotheses: (1) that orthostatic tolerance (OT) would be prolonged when hyperventilatory-induced hypocapnia (and hence cerebral hypoperfusion) was prevented; and (2) that pharmacological reductions in cerebral blood flow (CBF) at baseline would lower the 'CBF reserve', and ultimately reduce OT. In study 1 (n = 24; aged 25 ± 4 years) participants underwent progressive lower-body negative pressure (LBNP) until pre-syncope; end-tidal carbon dioxide (P ET , CO 2) was clamped at baseline levels (isocapnic trial) or uncontrolled. In study 2 (n = 10; aged 25 ± 4 years), CBF was pharmacologically reduced by administration of indomethacin (INDO; 1.2 mg kg(-1)) or unaltered (placebo) followed by LBNP to pre-syncope. Beat-by-beat measurements of middle cerebral artery blood flow velocity (MCAv; transcranial Doppler), heart rate (ECG), blood pressure (BP; Finometer) and end-tidal gases were obtained continuously. In a subset of subjects' arterial-to-jugular venous differences were obtained to examine the independent impact of hypocapnia or cerebral hypoperfusion (following INDO) on cerebral oxygen delivery and extraction. In study 1, during the isocapnic trial, P ET , CO 2 was successfully clamped at baseline levels at pre-syncope (38.3 ± 2.7 vs. 38.5 ± 2.5 mmHg respectively; P = 0.50). In the uncontrolled trial, P ET , CO 2 at pre-syncope was reduced by 10.9 ± 3.9 mmHg (P ≤ 0.001). Compared to the isocapnic trial, the decline in mean MCAv was 15 ± 4 cm s(-1) (35%; P ≤ 0.001) greater in the uncontrolled trial, yet the time to pre-syncope was comparable between trials (544 ± 130 vs. 572 ± 180 s; P = 0.30). In study 2, compared to placebo, INDO reduced resting MCAv by 19 ± 4 cm s(-1) (31%; P ≤ 0.001), but time to pre-syncope remained similar between trials (placebo: 1123 ± 138 s vs. INDO: 1175 ± 212 s; P = 0.53). The brain extracted more oxygen in face of hypocapnia (34% to 53%) or cerebral hypoperfusion (34% to 57%) to compensate for reductions in delivery. In summary, cerebral hypoperfusion either at rest or induced by hypocapnia at pre-syncope does not impact OT, probably due to a compensatory increase in oxygen extraction.
© 2014 The Authors. The Journal of Physiology © 2014 The Physiological Society.
Figures


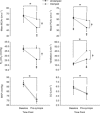
 ), minute ventilation, mean arterial blood pressure (MAP) and cardiac output (CO) from baseline to pre-syncope in study 1. *Main effect for time, independent of experimental trial; baseline significantly different from pre-syncope (P < 0.0001). †Main effect for experimental trial, independent of time point; clamped trial significantly different from unclamped trial (P < 0.0001). ‡Significant interaction between time point and experimental trial; mean PCAv in the clamped trial significantly different from the unclamped trial at baseline; mean PCAv, mean MCAv and
  in the clamped trial were significantly different from the unclamped trial at pre-syncope (P < 0.0001).
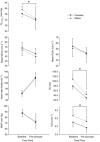
 ), minute ventilation, mean arterial blood pressure (MAP), heart rate. Stroke volume (SV) and cardiac output (CO) from baseline to pre-syncope in study 1. *Females significantly different from males.
 ), cerebral oxygen (O2) extraction and mean arterial blood pressure (MAP) from normocapnia to hypocapnia in study 1B. *Hypocapnia significantly different from normocapnia (P < 0.001).
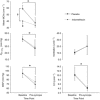
 ), minute ventilation, mean arterial blood pressure (MAP) and cardiac output (CO) from baseline to pre-syncope in study 2. *Main effect for time, independent of experimental trial; baseline significantly different from pre-syncope (P < 0.0001). †Main effect for experimental trial, independent of time point, clamped trial significantly different from unclamped trial (P < 0.0001). ‡Significant interaction between time point and experimental trial; mean MCAv in the clamped trial was significantly different from the unclamped trial at baseline (P < 0.0001).
 ), cerebral oxygen (O2) extraction and mean arterial blood pressure (MAP) following administration of indomethacin (NDO); study 2A. *Post-INDO significantly difference from pre-INDO (P < 0.001).
Similar articles
-
Impact of transient hypotension on regional cerebral blood flow in humans.Clin Sci (Lond). 2015 Jul;129(2):169-78. doi: 10.1042/CS20140751. Clin Sci (Lond). 2015. PMID: 25697830 Clinical Trial.
-
Carbon dioxide-mediated vasomotion of extra-cranial cerebral arteries in humans: a role for prostaglandins?J Physiol. 2016 Jun 15;594(12):3463-81. doi: 10.1113/JP272012. Epub 2016 Apr 6. J Physiol. 2016. PMID: 26880615 Free PMC article. Clinical Trial.
-
Modulation of the human brain oxygen extraction fraction and metabolic rate in response to hyperoxia: the role of hypocapnia.J Appl Physiol (1985). 2025 Jul 1;139(1):287-295. doi: 10.1152/japplphysiol.00354.2025. Epub 2025 Jul 1. J Appl Physiol (1985). 2025. PMID: 40590785
-
Hyperventilation, cerebral perfusion, and syncope.J Appl Physiol (1985). 2014 Apr 1;116(7):844-51. doi: 10.1152/japplphysiol.00637.2013. Epub 2013 Nov 21. J Appl Physiol (1985). 2014. PMID: 24265279 Review.
-
The impact of age on cerebral perfusion, oxygenation and metabolism during exercise in humans.J Physiol. 2016 Aug 15;594(16):4471-83. doi: 10.1113/JP271081. Epub 2015 Nov 2. J Physiol. 2016. PMID: 26435295 Free PMC article. Review.
Cited by
-
Similarity between carotid and coronary artery responses to sympathetic stimulation and the role of α1-receptors in humans.J Appl Physiol (1985). 2018 Aug 1;125(2):409-418. doi: 10.1152/japplphysiol.00386.2017. Epub 2018 Mar 22. J Appl Physiol (1985). 2018. PMID: 29565771 Free PMC article.
-
Differential contribution of cyclooxygenase to basal cerebral blood flow and hypoxic cerebral vasodilation.Am J Physiol Regul Integr Comp Physiol. 2020 Feb 1;318(2):R468-R479. doi: 10.1152/ajpregu.00132.2019. Epub 2019 Dec 23. Am J Physiol Regul Integr Comp Physiol. 2020. PMID: 31868517 Free PMC article.
-
The effect of α1 -adrenergic blockade on post-exercise brachial artery flow-mediated dilatation at sea level and high altitude.J Physiol. 2017 Mar 1;595(5):1671-1686. doi: 10.1113/JP273183. Epub 2016 Dec 29. J Physiol. 2017. PMID: 28032333 Free PMC article. Clinical Trial.
-
A comparison of protocols for simulating hemorrhage in humans: step versus ramp lower body negative pressure.J Appl Physiol (1985). 2021 Feb 1;130(2):380-389. doi: 10.1152/japplphysiol.00230.2020. Epub 2020 Nov 19. J Appl Physiol (1985). 2021. PMID: 33211600 Free PMC article.
-
The impact of acute central hypovolemia on cerebral hemodynamics: does sex matter?J Appl Physiol (1985). 2021 Jun 1;130(6):1786-1797. doi: 10.1152/japplphysiol.00499.2020. Epub 2021 Apr 29. J Appl Physiol (1985). 2021. PMID: 33914663 Free PMC article.
References
-
- Ainslie PN, Lucas SJ, Fan JL, Thomas KN, Cotter JD, Tzeng YC. Burgess KR. Influence of sympathoexcitation at high altitude on cerebrovascular function and ventilatory control in humans. J Appl Physiol. 2012;113:1058–1067. &. - PubMed
-
- Ainslie PN, Shaw AD, Smith KJ, Willie CK, Ikeda K, Graham J. Macleod DB. Stability of cerebral metabolism and substrate availability in humans during hypoxia and hyperoxia. Clin Sci (Lond) 2014;126:661–670. &. - PubMed
-
-
Bain AR, Smith KJ, Lewis NC, Foster GE, Wildfong KW, Willie CK, Hartley GL, Cheung SS. Ainslie PN. Regional changes in brain blood flow during severe passive hyperthermia: effects of
 and extracranial blood flow. J Appl Physiol. 2013;115:653–659. &.
-
PubMed
-
Bain AR, Smith KJ, Lewis NC, Foster GE, Wildfong KW, Willie CK, Hartley GL, Cheung SS. Ainslie PN. Regional changes in brain blood flow during severe passive hyperthermia: effects of
-
- Bruhn H, Fransson P. Frahm J. Modulation of cerebral blood oxygenation by indomethacin: MRI at rest and functional brain activation. J Magn Reson Imaging. 2001;13:325–334. &. - PubMed
-
- Blaber AP, Bondar RL, Moradshahi P, Serrador JM. Hughson RL. Inspiratory CO2 increases orthostatic tolerance during repeated tilt. Aviat Space Environ Med. 2001;72:985–991. &. - PubMed
Publication types
MeSH terms
Substances
LinkOut - more resources
Full Text Sources
Other Literature Sources
Research Materials

