

Hypomethylated pollen bypasses the interploidy hybridization barrier in Arabidopsis
- PMID: 25217506
- PMCID: PMC4213165
- DOI: 10.1105/tpc.114.130120
Hypomethylated pollen bypasses the interploidy hybridization barrier in Arabidopsis
Abstract
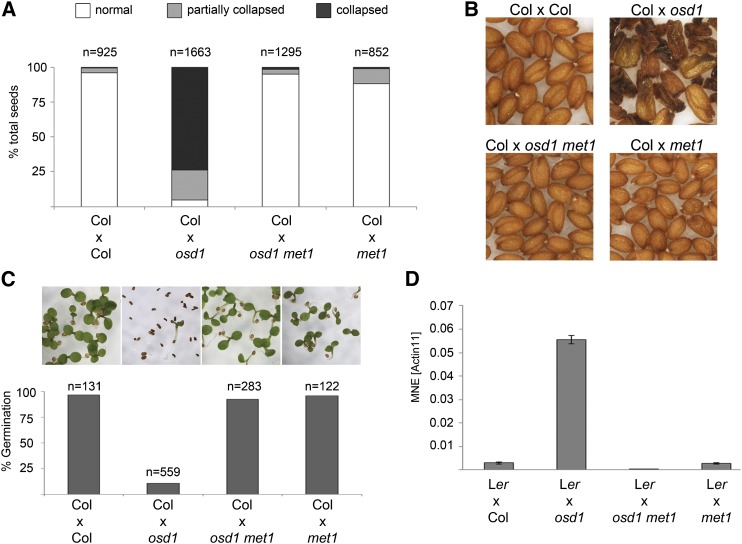
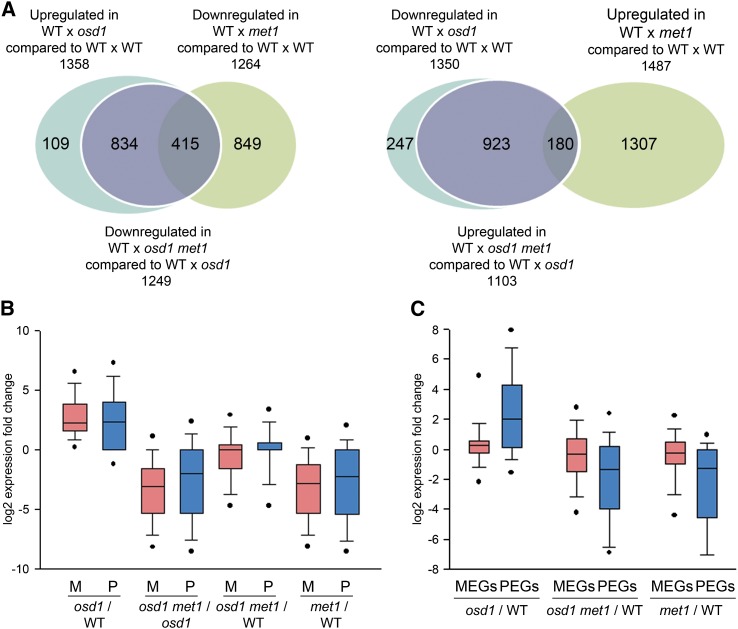
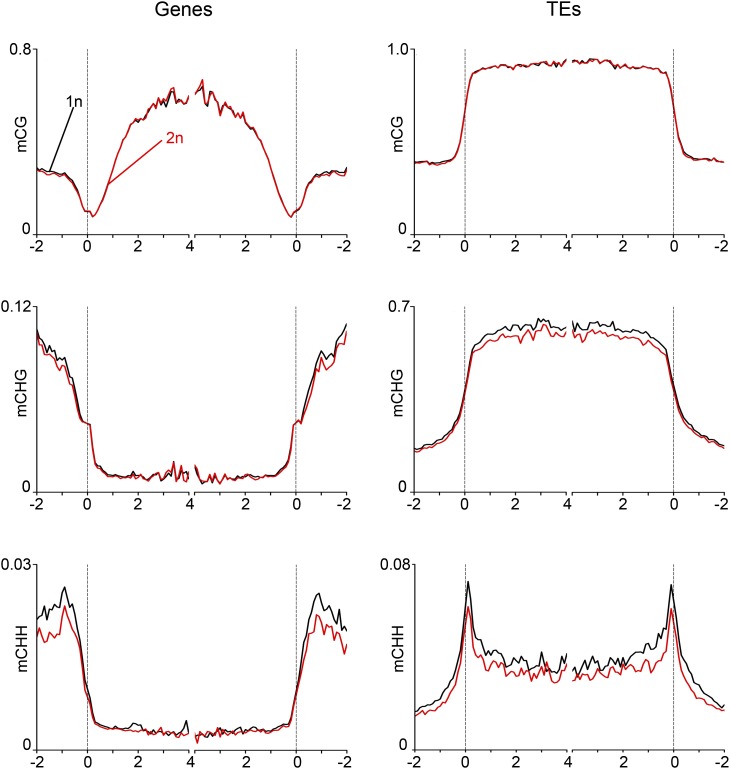
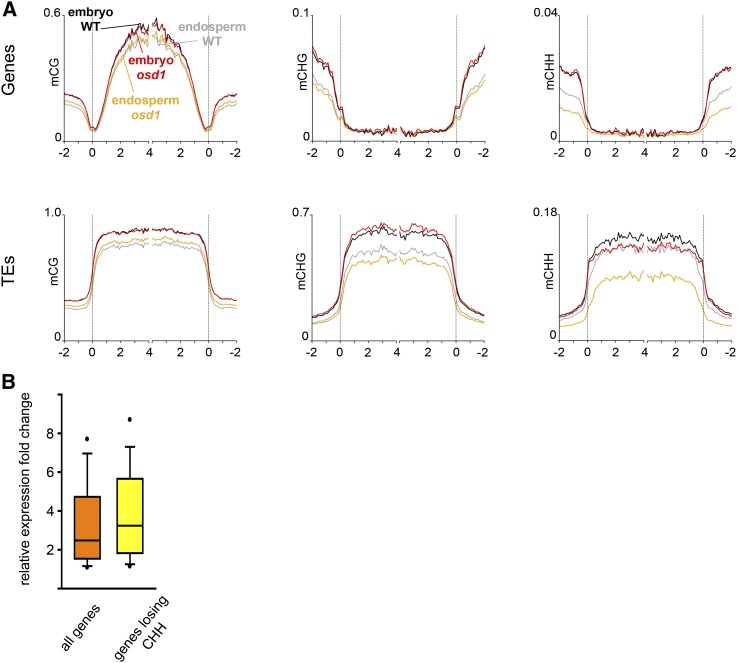
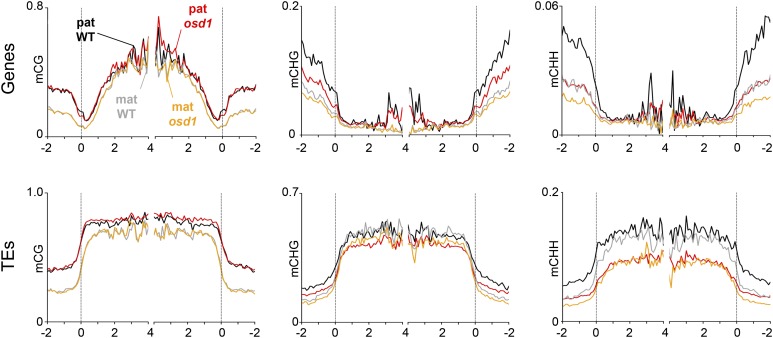
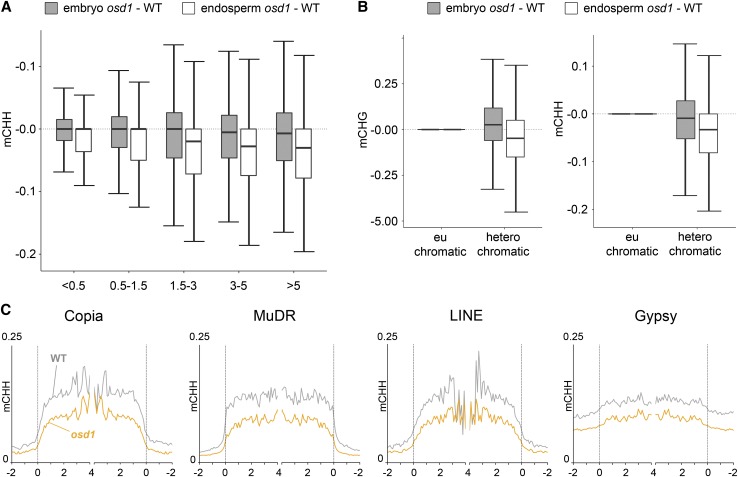
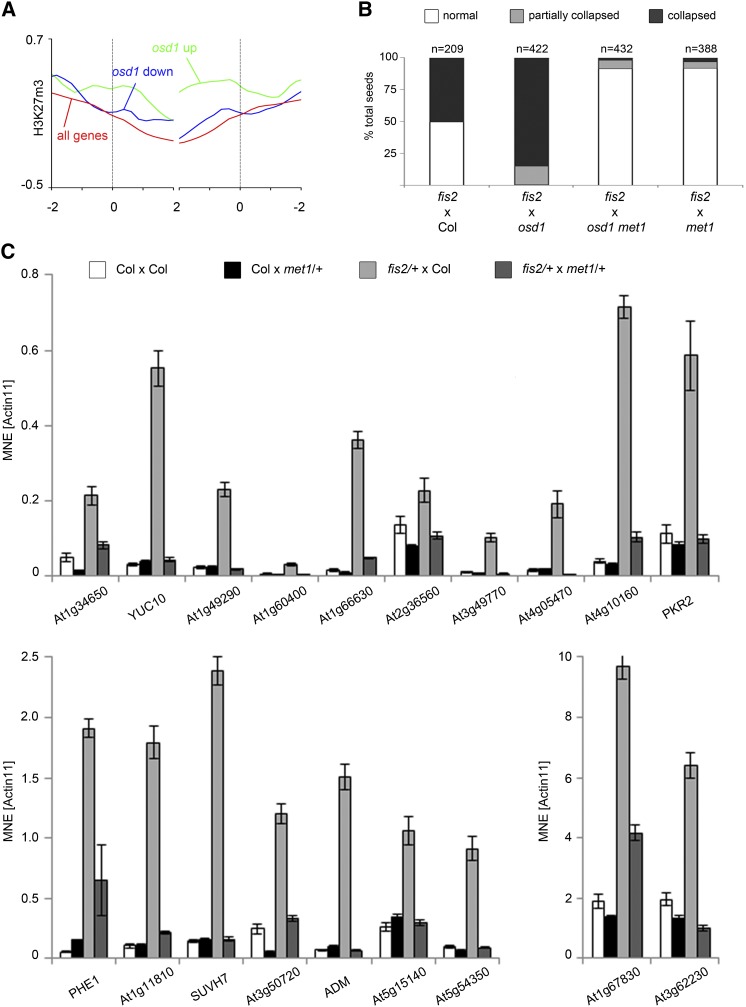
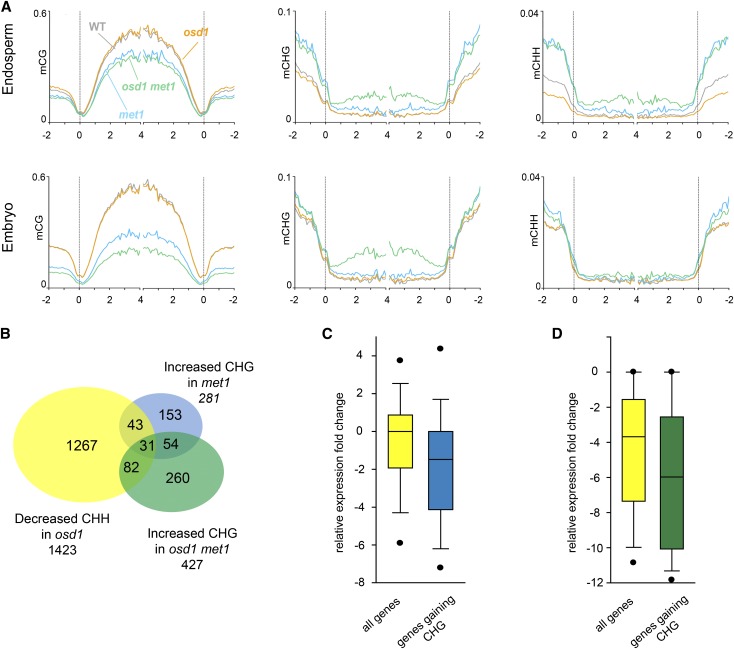
Plants of different ploidy levels are separated by a strong postzygotic hybridization barrier that is established in the endosperm. Deregulated parent-of-origin specific genes cause the response to interploidy hybridizations, revealing an epigenetic basis of this phenomenon. In this study, we present evidence that paternal hypomethylation can bypass the interploidy hybridization barrier by alleviating the requirement for the Polycomb Repressive Complex 2 (PRC2) in the endosperm. PRC2 epigenetically regulates gene expression by applying methylation marks on histone H3. Bypass of the barrier is mediated by suppressed expression of imprinted genes. We show that the hypomethylated pollen genome causes de novo CHG methylation directed to FIS-PRC2 target genes, suggesting that different epigenetic modifications can functionally substitute for each other. Our work presents a method for the generation of viable triploids, providing an impressive example of the potential of epigenome manipulations for plant breeding.
© 2014 American Society of Plant Biologists. All rights reserved.
Figures
Comment in
-
Advice to the lovelorn polyploid plant.Plant Cell. 2014 Sep;26(9):3470. doi: 10.1105/tpc.114.131854. Epub 2014 Sep 16. Plant Cell. 2014. PMID: 25228342 Free PMC article. No abstract available.
Similar articles
-
An imprinted gene underlies postzygotic reproductive isolation in Arabidopsis thaliana.Dev Cell. 2013 Sep 16;26(5):525-35. doi: 10.1016/j.devcel.2013.08.006. Epub 2013 Sep 5. Dev Cell. 2013. PMID: 24012484
-
Parental epigenetic asymmetry of PRC2-mediated histone modifications in the Arabidopsis endosperm.EMBO J. 2016 Jun 15;35(12):1298-311. doi: 10.15252/embj.201593534. Epub 2016 Apr 25. EMBO J. 2016. PMID: 27113256 Free PMC article.
-
FERTILIZATION-INDEPENDENT SEED-Polycomb Repressive Complex 2 Plays a Dual Role in Regulating Type I MADS-Box Genes in Early Endosperm Development.Plant Physiol. 2018 May;177(1):285-299. doi: 10.1104/pp.17.00534. Epub 2018 Mar 9. Plant Physiol. 2018. PMID: 29523711 Free PMC article.
-
Tearing down barriers: understanding the molecular mechanisms of interploidy hybridizations.J Exp Bot. 2012 Oct;63(17):6059-67. doi: 10.1093/jxb/ers288. J Exp Bot. 2012. PMID: 23105129 Review.
-
Endosperm-based postzygotic hybridization barriers: developmental mechanisms and evolutionary drivers.Mol Ecol. 2016 Jun;25(11):2620-9. doi: 10.1111/mec.13552. Epub 2016 Mar 9. Mol Ecol. 2016. PMID: 26818717 Review.
Cited by
-
Aberrant imprinting may underlie evolution of parthenogenesis.Sci Rep. 2018 Jul 13;8(1):10626. doi: 10.1038/s41598-018-27863-7. Sci Rep. 2018. PMID: 30006526 Free PMC article.
-
The MADS-box transcription factor PHERES1 controls imprinting in the endosperm by binding to domesticated transposons.Elife. 2019 Dec 2;8:e50541. doi: 10.7554/eLife.50541. Elife. 2019. PMID: 31789592 Free PMC article.
-
Loss of Small-RNA-Directed DNA Methylation in the Plant Cell Cycle Promotes Germline Reprogramming and Somaclonal Variation.Curr Biol. 2021 Feb 8;31(3):591-600.e4. doi: 10.1016/j.cub.2020.10.098. Epub 2020 Dec 3. Curr Biol. 2021. PMID: 33275892 Free PMC article.
-
Plant 3D genomics: the exploration and application of chromatin organization.New Phytol. 2021 Jun;230(5):1772-1786. doi: 10.1111/nph.17262. Epub 2021 Mar 4. New Phytol. 2021. PMID: 33560539 Free PMC article. Review.
-
Paternally Acting Canonical RNA-Directed DNA Methylation Pathway Genes Sensitize Arabidopsis Endosperm to Paternal Genome Dosage.Plant Cell. 2019 Jul;31(7):1563-1578. doi: 10.1105/tpc.19.00047. Epub 2019 May 7. Plant Cell. 2019. PMID: 31064867 Free PMC article.
References
-
- Adams, S., Vinkenoog, R., Spielman, M., Dickinson, H.G., Scott, R.J. (2000). Parent-of-origin effects on seed development in Arabidopsis thaliana require DNA methylation. Development 127: 2493–2502 - PubMed
-
- Birchler, J.A. (1993). Dosage analysis of maize endosperm development. Annu. Rev. Genet. 27: 181–204 - PubMed
-
- Brink, R., Cooper, D. (1947). The endosperm in seed development. Bot. Rev. 132: 423–541
Publication types
MeSH terms
Substances
Grants and funding
LinkOut - more resources
Full Text Sources
Other Literature Sources
Molecular Biology Databases
