. 2014 Sep 12:3:e03821.
doi: 10.7554/eLife.03821.

HIV-1 DNA predicts disease progression and post-treatment virological control

Collaborators, Affiliations

HIV-1 DNA predicts disease progression and post-treatment virological control

James P Williams et al. Elife. .

Abstract

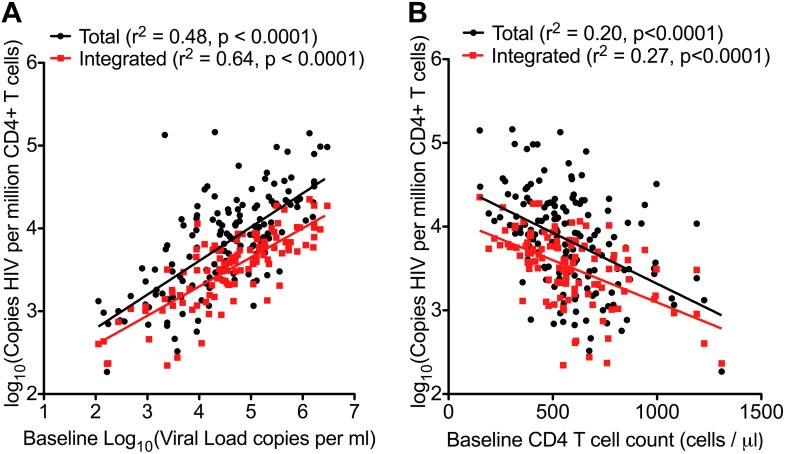
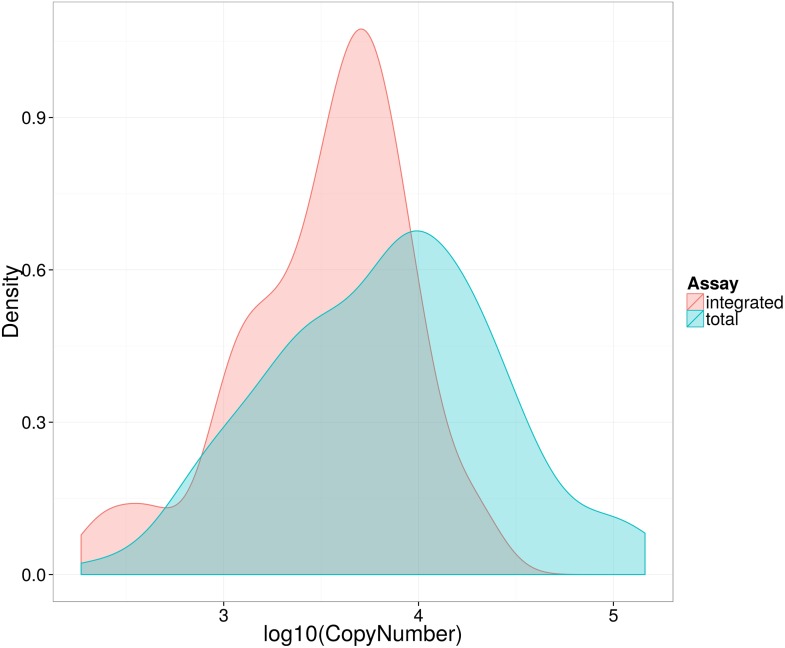
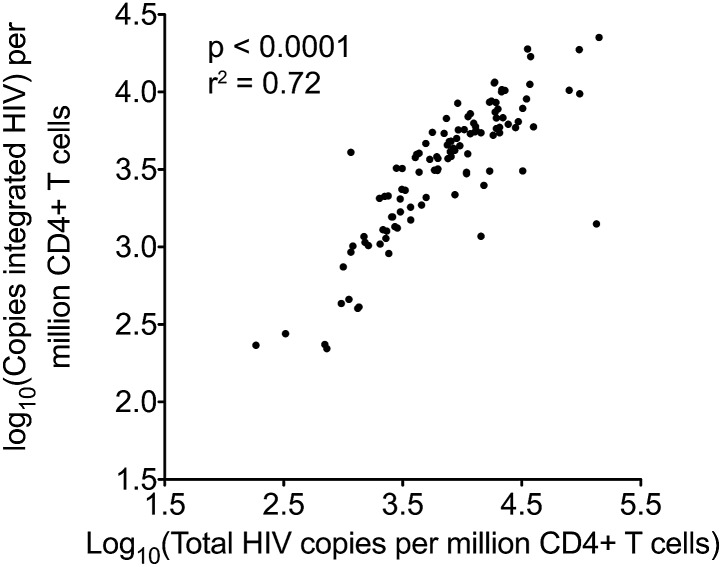
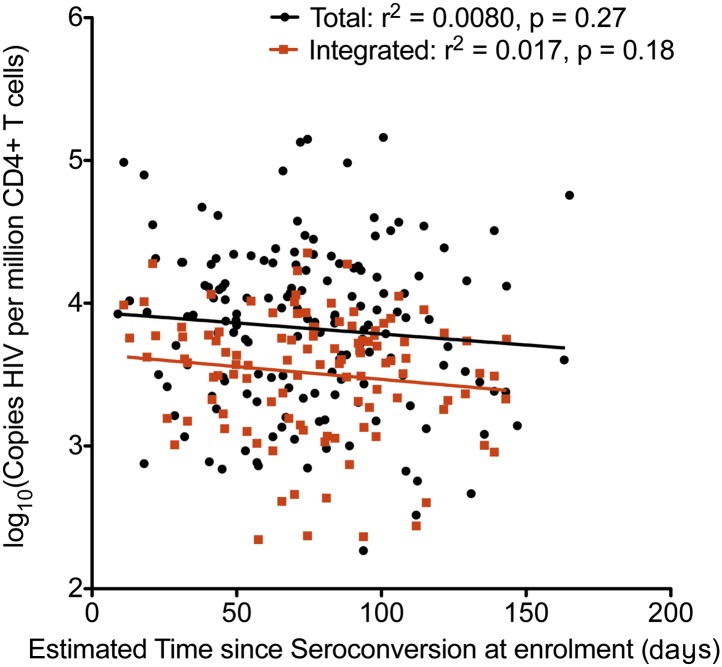
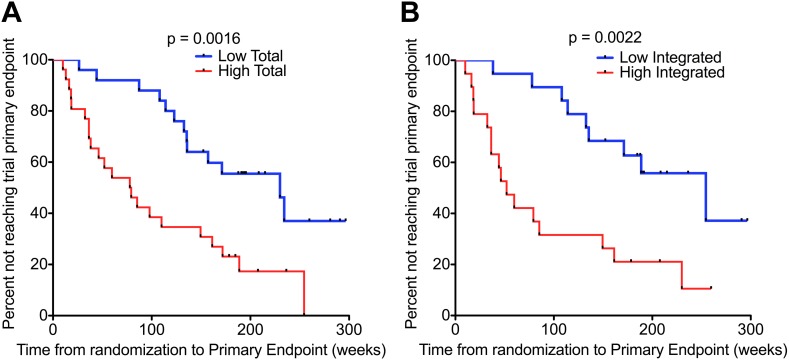
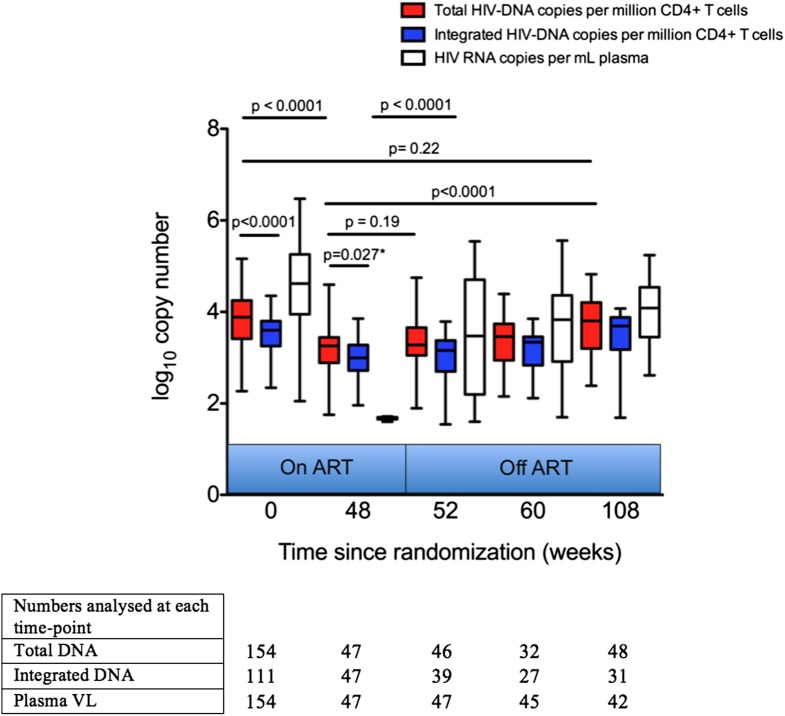
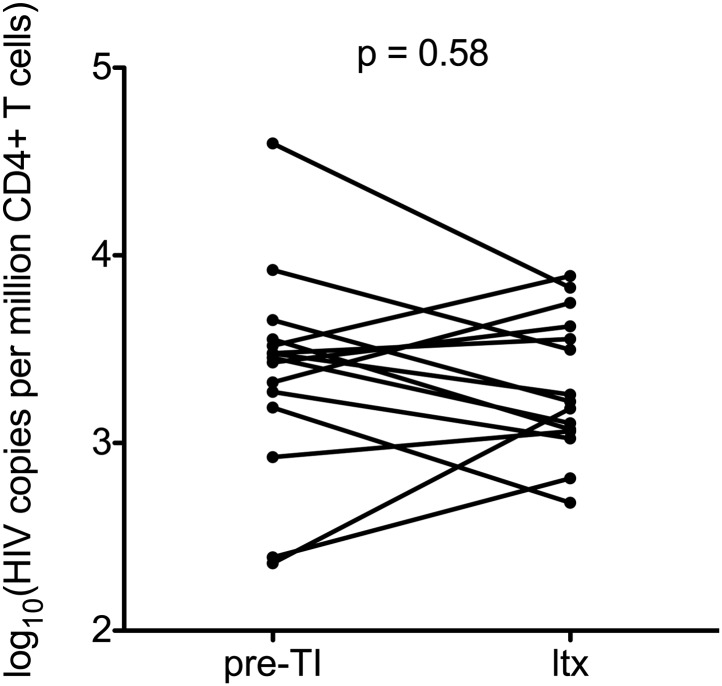
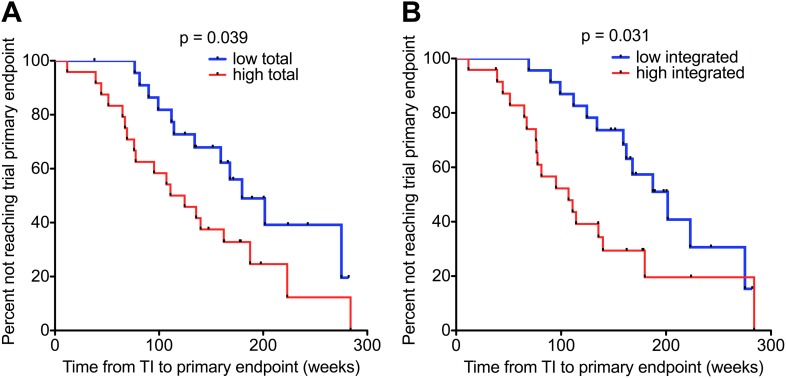
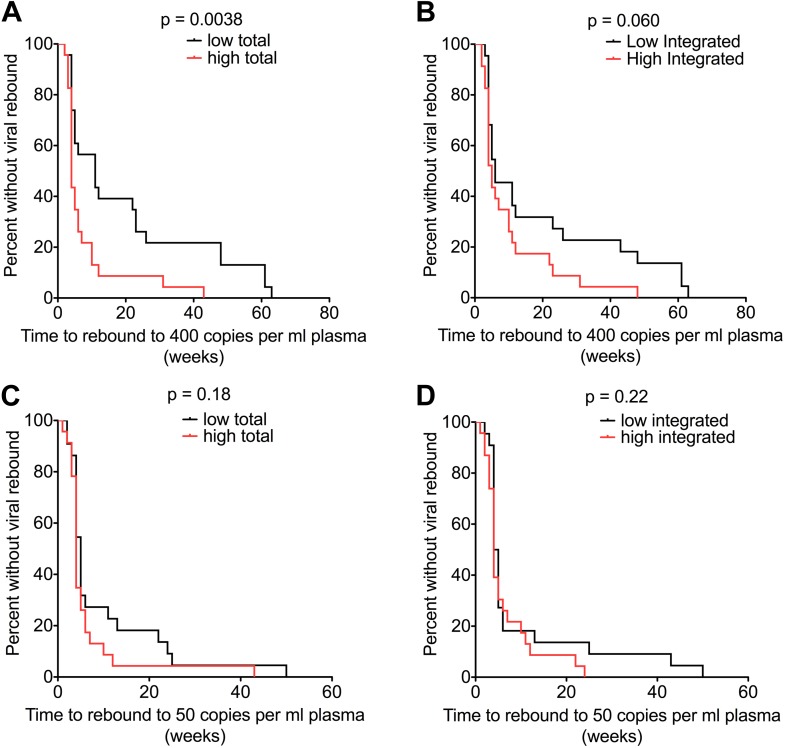
In HIV-1 infection, a population of latently infected cells facilitates viral persistence despite antiretroviral therapy (ART). With the aim of identifying individuals in whom ART might induce a period of viraemic control on stopping therapy, we hypothesised that quantification of the pool of latently infected cells in primary HIV-1 infection (PHI) would predict clinical progression and viral replication following ART. We measured HIV-1 DNA in a highly characterised randomised population of individuals with PHI. We explored associations between HIV-1 DNA and immunological and virological markers of clinical progression, including viral rebound in those interrupting therapy. In multivariable analyses, HIV-1 DNA was more predictive of disease progression than plasma viral load and, at treatment interruption, predicted time to plasma virus rebound. HIV-1 DNA may help identify individuals who could safely interrupt ART in future HIV-1 eradication trials.

Keywords: HIV-1; antiretroviral therapy; cure; human; human biology; infectious disease; medicine; microbiology; primary infection; reservoir.


Conflict of interest statement

The authors declare that no competing interests exist.

Figures

Figure 1.
Figure 1.. HIV-1 DNA correlates with baseline plasma viral load and CD4 T cell count.
Pre-therapy ‘baseline’ Total HIV-1 DNA (black points and line) (n = 154) and Integrated HIV-1 DNA (n = 111) (red points and line) correlated with log10 plasma HIV-1 RNA (A) and CD4 cell count (B). DOI: http://dx.doi.org/10.7554/eLife.03821.004
Figure 1—figure supplement 1.
Figure 1—figure supplement 1.. Distribution of log10 total and integrated HIV-1-DNA levels in untreated patients at baseline.
Kernel density plot to show distribution of Total (blue) and Integrated (red) HIV-1-DNA at baseline. DOI: http://dx.doi.org/10.7554/eLife.03821.005
Figure 1—figure supplement 2.
Figure 1—figure supplement 2.. Pearson correlation for total and integrated HIV-1 DNA levels in untreated patients at baseline.
DOI: http://dx.doi.org/10.7554/eLife.03821.006
Figure 1—figure supplement 3.
Figure 1—figure supplement 3.. Relationship between estimated time since seroconversion and HIV-1 DNA levels.
Linear regression of HIV-1 DNA levels (Total in black; Integrated in Red) vs the estimated time since seroconversion (weeks) (total n = 154, integrated n = 109). DOI: http://dx.doi.org/10.7554/eLife.03821.007
Figure 2.
Figure 2.. HIV-1 DNA predicts clinical progression in absence of ART.
Kaplan–Meier survival analyses for (A) Total (n = 51) and (B) Integrated (n = 38) HIV-1 DNA and clinical progression, based on time from randomization to the SPARTAC trial primary endpoint of a CD4 T cell count of 350 cells/μl or starting long-term ART. HIV-1 DNA data was divided into two ‘high’ and ‘low’ at the median level, which was 4.02 and 3.61 copies HIV-1 DNA per million CD4 T cells for Total and Integrated, respectively. Significance was determined by log rank test. DOI: http://dx.doi.org/10.7554/eLife.03821.008
Figure 3.
Figure 3.. Analysis of impact on HIV-1 DNA of antiretroviral therapy.
Total and Integrated HIV-1 DNA levels and plasma viral load (HIV-1 RNA) were measured at Week 0 ‘baseline’ (in participants from all three trial arms prior to any therapy) and also in those receiving 48 weeks of ART (weeks 48, 52, 60 and 108 after baseline). DNA levels (log10 copies/million CD4 T cells) and viral load (log10 copies/ml plasma) were measured at all time-points, but not all participants were sampled at all time-points dependent on sample availability. Significance was determined by unpaired Students t Tests or paired t test (marker with *) when samples at the two time-points being compared were matched. DOI: http://dx.doi.org/10.7554/eLife.03821.010
Figure 3—figure supplement 1.
Figure 3—figure supplement 1.. Impact of stopping and re-starting ART on HIV-1 DNA.
Total HIV-1 DNA levels were calculated in 15 patients on ART before TI (pre-TI) These patients subsequently started long-term ART (ltx). DNA was sampled at least 6 months post ltx start date. Significance was established using a paired students t test. DOI: http://dx.doi.org/10.7554/eLife.03821.011
Figure 4.
Figure 4.. HIV-1 DNA on ART predicts clinical progression following treatment interruption.
Kaplan–Meier survival analyses for (A) Total (n = 47) and (B) Integrated (n = 47) HIV-1 DNA and clinical progression, based on time to the SPARTAC trial primary endpoint of a CD4 T cell count of 350 cells/μl or starting back on long-term ART. HIV-1 DNA data was divided into ‘high’ and ‘low’ at the median. Significance was determined by log rank test. Participants had received a median of 48 weeks of ART and then undertook a treatment interruption. DNA levels were measured at week 48, at the point of stopping ART. Time from TI to primary endpoint is plotted on the x-axis. DOI: http://dx.doi.org/10.7554/eLife.03821.012
Figure 5.
Figure 5.. HIV-1 DNA at ART interruption predicts time to viral rebound.
Survival analyses of time to viral rebound (weeks) in participants undertaking TI after 48 weeks of ART. HIV-1 DNA levels are presented divided at the median level into high (red) and low (black). Rebound to 400 HIV-1 RNA copies (n = 46) is presented for Total (A) and Integrated (B) HIV-1 DNA. Rebound to 50 HIV-1 RNA copies (n = 45) is presented for Total (C) and Integrated (D) HIV-1 DNA. Significance was determined by log rank test. DOI: http://dx.doi.org/10.7554/eLife.03821.013

Comment in

Similar articles

Cited by

References

    1. Agosto LM, Liszewski MK, Mexas A, Graf E, Pace M, Yu JJ, Bhandoola A, O'Doherty U. Patients on HAART often have an excess of unintegrated HIV DNA: implications for monitoring reservoirs. Virology. 2011;409:46–53. doi: 10.1016/j.virol.2010.08.024. - DOI - PMC - PubMed
    1. Angel JB, Routy JP, Tremblay C, Ayers D, Woods R, Singer J, Bernard N, Kovacs C, Smaill F, Gurunathan S, Sekaly RP. A randomized controlled trial of HIV therapeutic vaccination using ALVAC with or without Remune. AIDS. 2011;25:731–739. doi: 10.1097/QAD.0b013e328344cea5. - DOI - PubMed
    1. Avettand-Fenoel V, Chaix ML, Blanche S, Burgard M, Floch C, Toure K, Allemon MC, Warszawski J, Rouzioux C, French Pediatric Cohort Study ANRS-CO 01 Group LTR real-time PCR for HIV-1 DNA quantitation in blood cells for early diagnosis in infants born to seropositive mothers treated in HAART area (ANRS CO 01) Journal of Medical Virology. 2009;81:217–223. doi: 10.1002/jmv.21390. - DOI - PubMed
    1. Bullen CK, Laird GM, Durand CM, Siliciano JD, Siliciano RF. New ex vivo approaches distinguish effective and ineffective single agents for reversing HIV-1 latency in vivo. Nature Medicine. 2014;20:425–429. doi: 10.1038/nm.3489. - DOI - PMC - PubMed
    1. Chun TW, Justement JS, Moir S, Hallahan CW, Maenza J, Mullins JI, Collier AC, Corey L, Fauci AS. Decay of the HIV reservoir in patients receiving antiretroviral therapy for extended periods: implications for eradication of virus. The Journal of Infectious Diseases. 2007;195:1762–1764. doi: 10.1086/518250. - DOI - PubMed

Publication types